Overview
Remote sensing data can be used to study vegetation dynamics, such as plant healthiness. Like all objects, plants have unique spectral characteristics, and this information can be interpreted from remote sensing data to determine a plant’s condition.
How does it work?
The sun emits a full spectrum of light to Earth. The spectrum of visible light contains red, orange, yellow, green, blue, indigo, and violet wavelengths. Beyond the visible light spectrum, there are wavelengths for radio, infrared, ultraviolet, X-rays, and gamma rays.
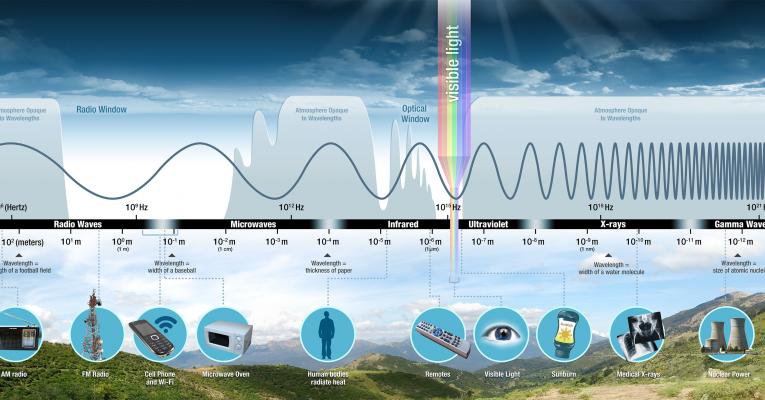
Image Source: NASA
Plants absorb most of the red and blue light that they receive as part of the process of photosynthesis. Some of the green light is absorbed and some is reflected off the leaves. This is the reason that plants look green. Chlorophyll, which cannot be detected by visible light, is sensitive to near infrared light. A high percentage of near infrared light is reflected off the leaves in healthy plants. When a plant is unhealthy, it has less chlorophyll and therefore reflects less near infrared light. Unhealthy plants also reflect more red light. The difference between red and near infrared light reflected off a plant is a good indicator of plant healthiness.
What is a vegetation index?
A common vegetation index was derived to study vegetation health and is referred to as the Normalized Difference Vegetation Index (NDVI). The NDVI formula is:
NDVI = (NIR - Red) / (NIR + Red)
Other vegetation measurement proxies include the Combined Fraction of Photosynthetically Active Radiation (FPAR) and the Leaf Area Index (LAI). FPAR is defined as the fraction of incident photosynthetically active radiation (400-700 nm) absorbed by the green elements of a vegetation canopy. LAI is defined as the one-sided green leaf area per unit ground area in broadleaf canopies and as one-half the total needle surface area per unit ground area in coniferous canopies.
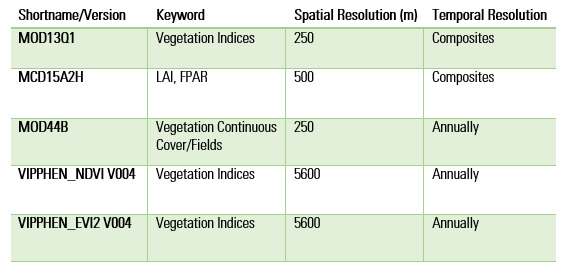
Commonly used data products to study Vegetation Dynamics:
How do others use this data?
Data in Action (DIA) stories provide examples about how different Earth Science data products have been used to study specific applications. The stories listed below are related to vegetation studies:
- Using Population and Remote Sensing Data to Study Reforestation
- Detecting Vegetation Loss in Hail Scars using MODIS Data and AppEEARS
- MODIS Vegetation Indices: A Zoological Approach
- Monitoring Phenology in the National Parks
Where can I find video tips or tutorials about this data?
E-Learning Materials provide more in-depth information about how to access, process, and use specific data products. The list below is related to vegetation data products distributed by the LP DAAC:
- Getting Started with MODIS Version 6 Vegetation Indices Data Part 1: All About Accessing Data
- Getting Started with MODIS Version 6 Vegetation Indices Data Part 2: Using the Data
- Getting Started with MODIS Version 6 Vegetation Indices Data Part 3: Interpreting Quality Information
The following workflows demonstrate how to develop a study related to vegetation dynamics using LP DAAC resources and data.
Example 1
Science question:
How is it possible to measure vegetation healthiness in Estes Park, Colorado using satellite data from early to late spring 2018?
Step 1: Gather background Information and broaden your understanding of this topic by reviewing relevant LP DAAC materials and resources.
Data in Action (DIA) stories, written by LP DAAC staff, explore various use cases for integrating remote sensing data into a variety of research projects. Review DIA stories related to vegetation to get ideas on data and methods used in similar research:
Review a frequently updated list of publications to learn more about research being done to study vegetation using remote sensing data:
- Observed long-term greening of alpine vegetation—a case study in the French Alps
Use the DAAC Dictionary to look up unfamiliar terms
- MODIS
- Normalized Difference Vegetation Index (NDVI)
Step 2: Select a Data Product
When choosing which data product is right for your study, consider the following questions:
- What are my spatial resolution requirements?
- My study area, Estes Park, has an area of around 7 square miles, therefore, I am searching for the highest spatial resolution data products available.
- What are my temporal resolution requirements?
- The time period of my study spans around 3 months (March-May), so frequent data observations are preferred so that I can analyze the most data possible.
- Which data products have been used in similar studies?
- As discussed in the DIA story, “Monitoring Phenology in the National Parks”, the MOD13Q1 Version 6 (MODIS Normalized Difference Vegetation Index (NDVI)) is commonly used to study changes in vegetation healthiness over time.
Step 3: Search for a Data Product
- In Search Data Catalog, apply the following search filters:
- Collection Version: 6
- Collection: Terra MODIS
- Keyword: Vegetation Indices
- Spatial Resolution: 250
- Temporal Resolution: Multi-Day
OR search the product short name: MOD13Q1
- Click on the MOD13Q1 card to be taken to the DOI landing page. Here you will find detailed information about the data product as well as links to the User Guide and ATBD.
Step 4: Select a Tool
The tools icon on the DOI landing page shows what types of tools are available with the MOD13Q1 data product. When choosing which tool is right for your study, consider the following questions:
- Do I want to spatially subset my data (i.e. do I want data that only covers a particular area?)
- Yes. In this case, we are looking at vegetation healthiness only over Estes Park so we only need data for a small area.
- Do I want to visualize data values over my study area?
- Yes. In this case, we are interested in vegetation healthiness overtime so we are looking to do a time-series analysis of data values over our study area.
- Do I want to directly download the data?
- No. In this case, we are more interested in visualizing the data values in a graph rather than downloading the data products.
In this particular case, the most relevant tool that can be used to answer the example science question is AppEEARS, which offers a simple and efficient way to access and transform geospatial data. MOD13Q1 is available in AppEEARS the ability to generate time-series graphs over a particular area. Use this tool to upload a shapefile or create a region of interest over Estes Park and explore NDVI values in that area over the study period. More information on how to use AppEEARS can be found here.
Results
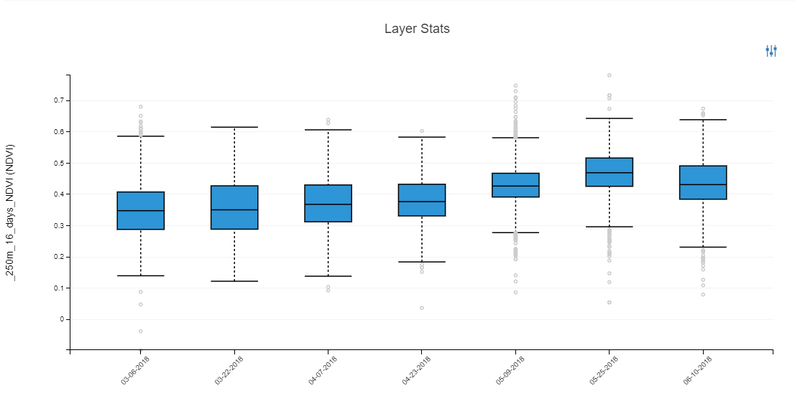
The NDVI values over Estes Park from March to June 2018 are shown in the image above.