Showing 61 - 120 of 674 results
ECOSTRESS Tiled Land Surface Temperature and Emissivity Instantaneous L2 Global 70 m
ECOSTRESS Tiled Ancillary NDVI and Albedo L2 Global 70 m
ECOSTRESS Swath Land Surface Temperature and Emissivity Instantaneous L2 Global 70 m
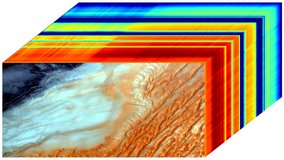
EMIT L1B At-Sensor Calibrated Radiance and Geolocation Data 60 m
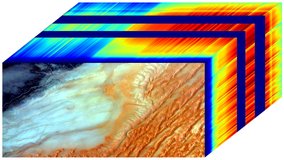
EMIT L2A Estimated Surface Reflectance and Uncertainty and Masks 60 m
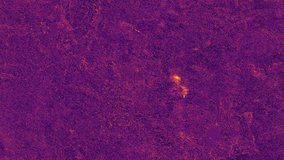
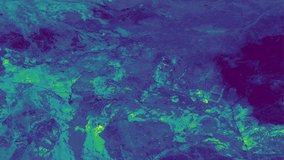
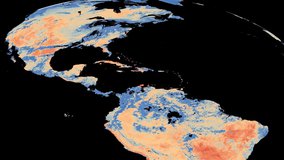
EMIT L2B Methane Enhancement Data 60 m
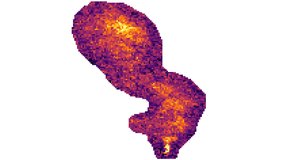
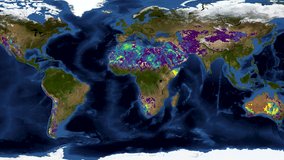
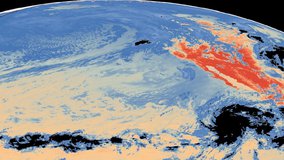
EMIT L2B Estimated Methane Plume Complexes 60 m
EMIT L2B Estimated Mineral Identification and Band Depth and Uncertainty 60 m
EMIT L3 Aggregated Mineral Spectral Abundance and Uncertainty 0.5 Deg
GEDI L1B Geolocated Waveform Data Global Footprint Level
GEDI L1B Geolocated Waveform Data Global Footprint Level
GEDI L2A Elevation and Height Metrics Data Global Footprint Level
GEDI L2A Elevation and Height Metrics Data Global Footprint Level
GEDI L2B Canopy Cover and Vertical Profile Metrics Data Global Footprint Level
GEDI L2B Canopy Cover and Vertical Profile Metrics Data Global Footprint Level
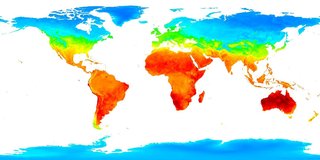
Geostationary Earth Orbit Land Surface Temperature Hourly North and South America 4 km
Geostationary Earth Orbit Land Surface Temperature Hourly North and South America 4 km
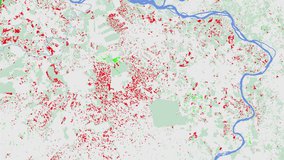
Global Forest Cover Change (GFCC) Forest Cover Change Multi-Year Global 30 m
Global Forest Cover Change (GFCC) Surface Reflectance Estimates Multi-Year Global 30 m
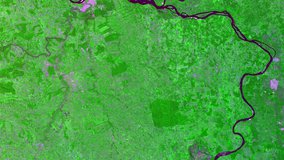
Global Forest Cover Change (GFCC) Tree Cover Multi-Year Global 30 m
Global Forest Cover Change (GFCC) Water Cover 2000 Global 30 m
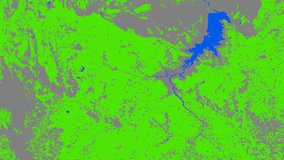
Global Food Security Support Analysis Data (GFSAD) Crop Dominance 2010 Global 1 km
Global Food Security Support Analysis Data (GFSAD) Crop Mask 2010 Global 1 km
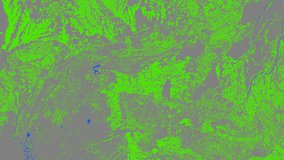
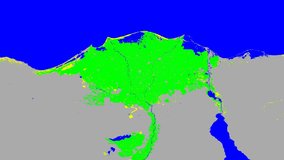
Global Food Security-support Analysis Data (GFSAD) Cropland Extent 2015 Africa 30 m
Global Food Security-support Analysis Data (GFSAD) Cropland Extent 2015 Australia, New Zealand, China, Mongolia 30 m
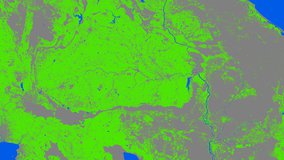
Global Food Security-support Analysis Data (GFSAD) Cropland Extent 2015 Europe, Central Asia, Russia, Middle East 30 m
Global Food Security-support Analysis Data (GFSAD) Cropland Extent 2010 North America 30 m
Global Food Security-support Analysis Data (GFSAD) Cropland Extent 2015 South Asia, Afghanistan, Iran 30 m
Global Food Security-support Analysis Data (GFSAD) Cropland Extent 2015 South America 30 m
Global Food Security-support Analysis Data (GFSAD) Cropland Extent 2015 Southeast and Northeast Asia 30 m
Global Food Security-support Analysis Data (GFSAD) Cropland Extent 2015 Validation 30 m
Global Hyperspectral Imaging Spectral-library of Agricultural crops for Central Asia

Global Hyperspectral Imaging Spectral-library of Agricultural crops for Conterminous United States


G-LiHT Metrics
Global Land Cover Mapping and Estimation Yearly 30 m
NASA Global Web-Enabled Landsat Data Monthly Global 30 m
NASA Global Web-Enabled Landsat Data Monthly Global 30 m
NASA Global Web-Enabled Landsat Data Annual Global 30 m
NASA Global Web-Enabled Landsat Data Annual Global 30 m
HLS Landsat-8 OLI Surface Reflectance and TOA Brightness Daily Global 30 m
HLS Operational Land Imager Surface Reflectance and TOA Brightness Daily Global 30m
HLS Sentinel-2 Multi-spectral Instrument Surface Reflectance Daily Global 30m
Headwall Hyperspectral Reflectance LTER Cedar Creek Minnesota Multi-Year 1 mm
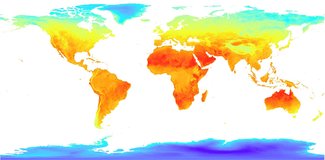
Low Earth Orbit Land Surface Temperature Monthly Global Gridded
Low Earth Orbit Land Surface Temperature Monthly Global Gridded
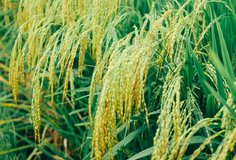
Landsat-Derived Global Rainfed and Irrigated-Cropland Product 30 m