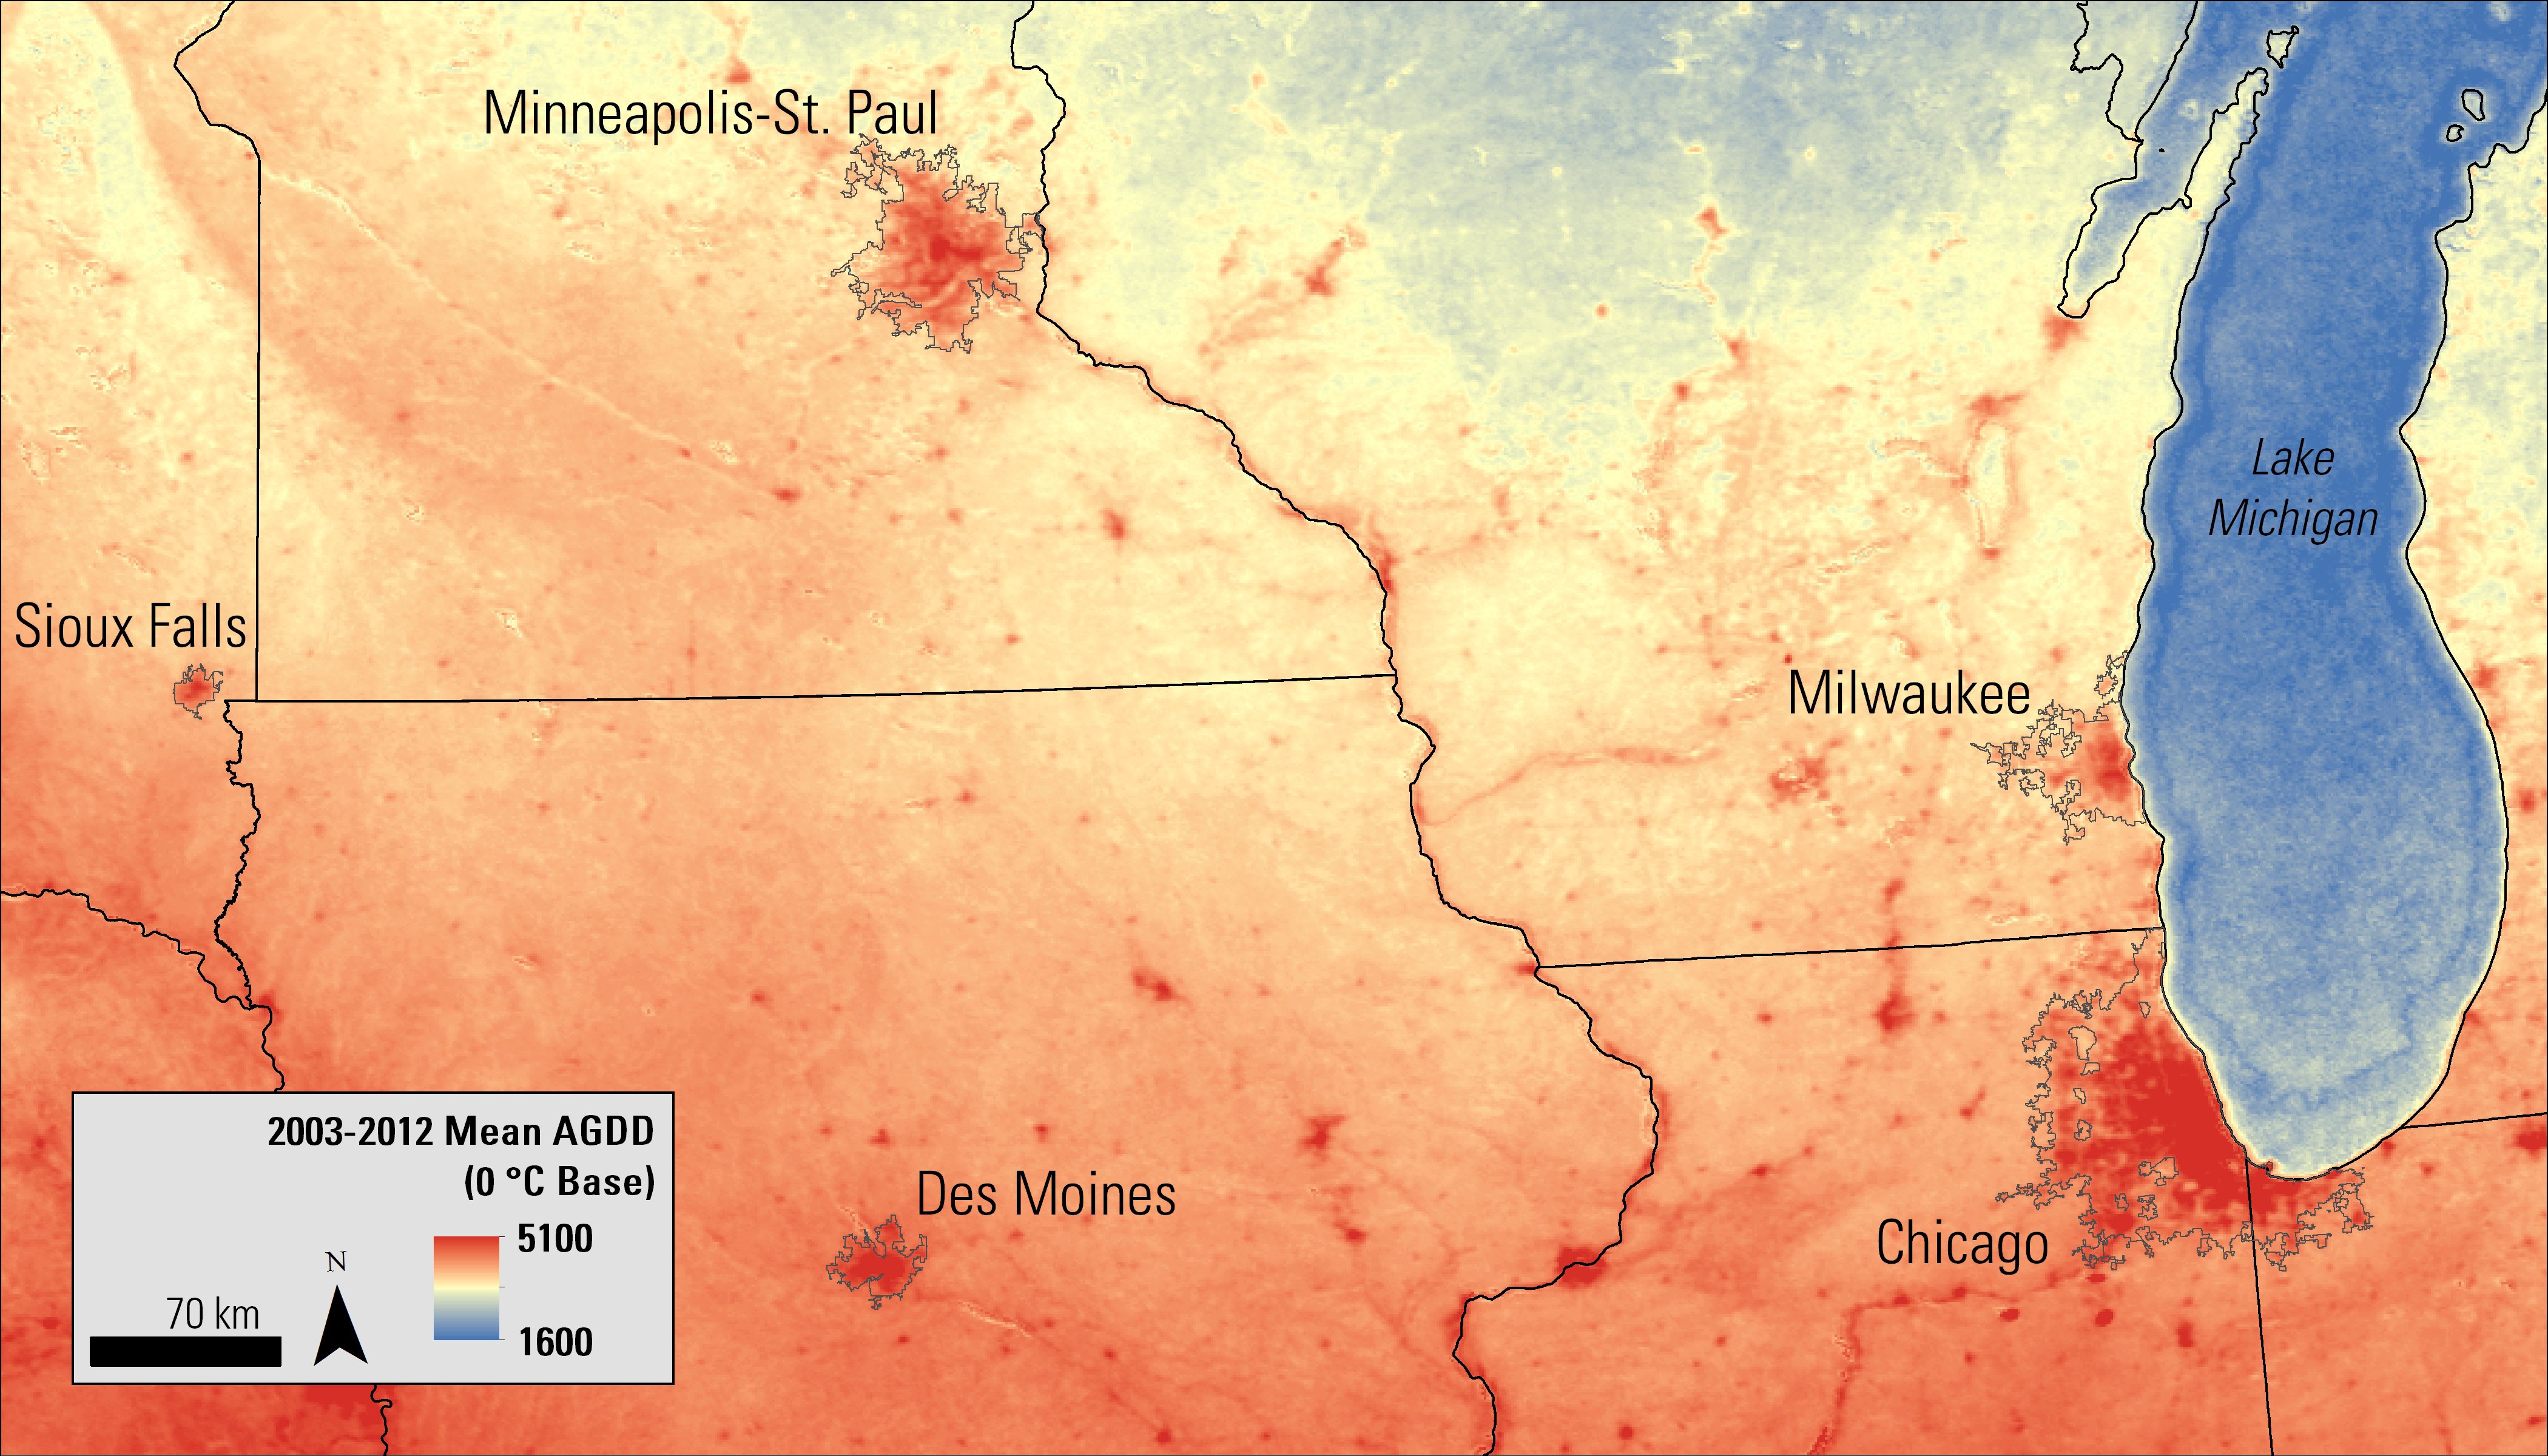
Image of annual mean accumulated growing degree-days (AGDD) for 2003-2012. AGDD is calculated from the MODIS-Aqua and MODIS-Terra 1,000 meter 8-day composites of daytime and nighttime land surface temperature (LST). Five of the eleven study sites from Krehbiel and Henebry (2016) are labeled in this image. Areas with higher mean annual AGDD are shaded red, including major cities such as Minneapolis-St. Paul, MN, and Chicago, IL.
AGDD data provided courtesy of the author.
June 21st marks the Summer Solstice, ushering in the arrival of summer, and generally warmer temperatures. The ~250 million urban dwellers in the US will feel the heat of summer even more so than their rural counterparts. Why? Because of the Urban Heat Island (UHI) effect, or the general phenomenon of higher temperatures in urban areas versus the surrounding countryside. UHIs are generally measured by urban-rural air temperature differences, whereas land surface temperatures (LST), often captured by satellite sensors, measure the Surface Urban Heat Island (SUHI). The Moderate Resolution Imaging Spectroradiometer (MODIS) is a sensor aboard the Terra and Aqua satellites that provides daily global LST observations.
Air temperature observations from weather stations in and around cities provide long-spanning records of urban temperatures at a specific location, but they suffer from poor spatial coverage throughout cities. In contrast, MODIS LST data products provide total coverage of urban and surrounding rural regions, but at a lower spatial resolution of 1,000 meters. A recent study by Krehbiel and Henebry (2016) used 8-day composites of daytime and nighttime LST from MODIS-Aqua (MYD11A2) and MODIS-Terra (MOD11A2) from 2003 to 2012 to calculate growing degree-days and accumulated growing degree-days to characterize the SUHI for eleven urban areas in the Midwest. They compared the MODIS LST-based results with corresponding air temperature-based UHI characterization from (1) weather station data from the Global Historical Climate Network (GHCN) and (2) modeled gridded Daymet temperature data. The study compared daytime vs. nighttime, urban vs. rural, and seasonal dynamics of the [S]UHI.
The MODIS LST-derived results were closer to the GHCN air temperature-derived results than the Daymet modeled air temperature results for the nighttime observations. This suggests that MODIS LST could be used for monitoring nighttime UHI dynamics for cities in the mid-latitudes. Seasonally, the study found more pronounced urban-rural differences in thermal time during the summer months, once the surrounding rural vegetation canopy developed. Understanding the thermal climate of cities is important because urban areas impact daily, seasonal, and annual weather on local to regional scales.
The LP DAAC’s Application for Extracting and Exploring Analysis Ready Samples (AppEEARS) is a data extraction tool that can be used to visualize urban vs. rural and daytime vs. nighttime differences in the SUHI effect. Below are the results from inputting the eleven urban and corresponding rural (22 total) point locations used in Krehbiel and Henebry (2016) into AppEEARS for the same time period (2003-2012) for MOD11A2 and MYD11A2 daytime LST. The boxplots labeled “Sites” show differences in the median LST between the eleven urban sites and eleven rural sites.
AppEEARS also allows the user to select a subset of their results, as seen below (2nd plot, bottom) for the Minneapolis-St. Paul, MN, urban-rural site pair. In Minneapolis-St. Paul, the median urban MODIS-Aqua daytime LST was 297.8 K (24.6 °C, 76.4 °F) compared to the median rural LST, which was 294.7 K (21.6 °C, 70.8 °F). The visualizations generated by AppEEARS provide a quick and easy way to begin exploring SUHI characteristics for any city across the world using MODIS LST data.

Example of using AppEEARS to compare categories (above) by city for all MODIS-Aqua (MYD11A2) daytime land surface temperature (LST) observations from 2003-2012 for the study sites from Krehbiel and Henebry (2016). Below, AppEEARS compares median decadal LST split between all urban and rural sites. Both Y axes are in Kelvin.
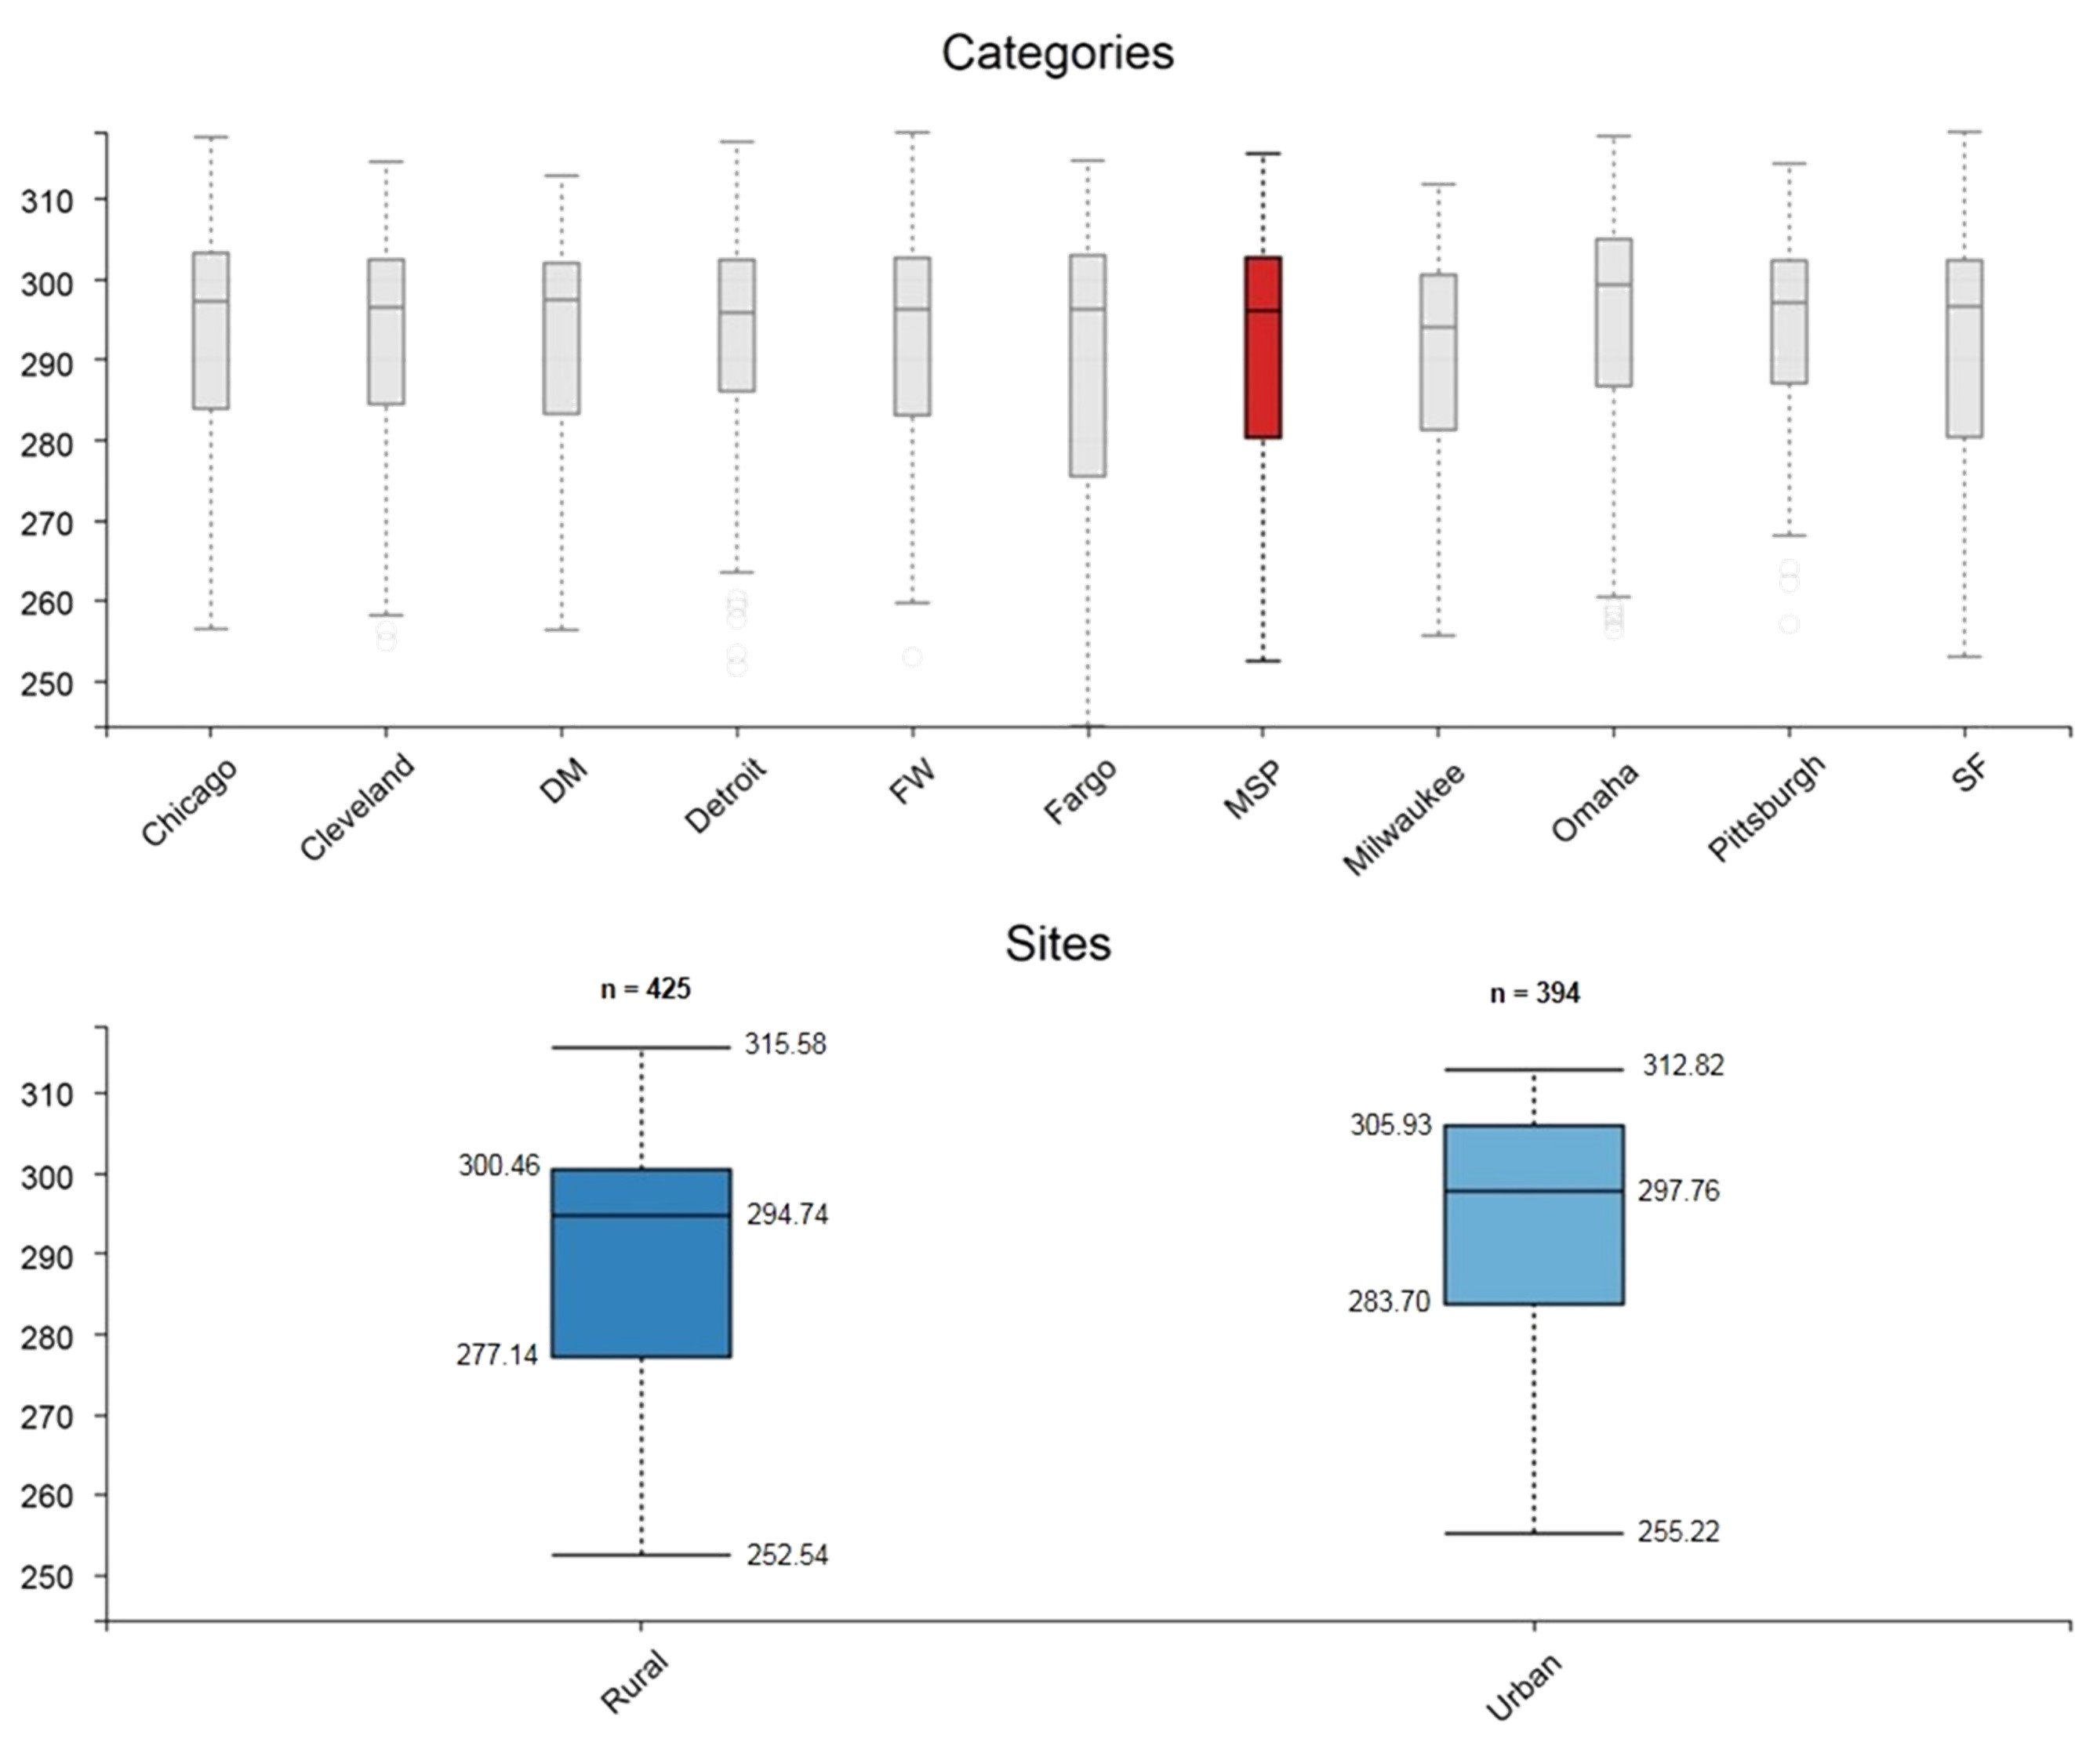
AppEEARS also allows the user to select a subset of the results to adjust the focus of their research as needed. In this example, only the Minneapolis-St. Paul (MSP) urban and rural sites are being compared. Both Y axes are in Kelvin. Additional information on how to use AppEEARS for data extraction and analysis can be found here.
Example of using AppEEARS to compare categories (above) by city for all MODIS-Aqua (MYD11A2) daytime land surface temperature (LST) observations from 2003-2012 for the study sites from Krehbiel and Henebry (2016). Below, AppEEARS compares median decadal LST split between all urban and rural sites. Both Y axes are in Kelvin.
AppEEARS also allows the user to select a subset of the results to adjust the focus of their research as needed. In this example, only the Minneapolis-St. Paul (MSP) urban and rural sites are being compared. Both Y axes are in Kelvin. Additional information on how to use AppEEARS for data extraction and analysis can be found here.

References: (Author's Note 5/15/2020: At the time of publishing these references were available online, some resources may no longer be available.)
Krehbiel, C., and Henebry, G.M., 2016, A comparison of multiple datasets for monitoring thermal time in urban areas over the US Upper Midwest: Remote Sensing, v. 8, no. 4, p. 297, at http://www.mdpi.com/2072-4292/8/4/297/htm.
Menne, M.J., Durre, I., Korzeniewski, B., McNeal, S., Thomas, K., Yin, X., Anthony, S., Ray, R., Vose, R.S., Gleason, B.E., and Houston, T.G., 2015, Global historical climatology network—Daily (GHCN-Daily): NOAA database, accessed May 10, 2016, at https://data.noaa.gov/dataset/global-historical-climatology-network-daily-ghcn-daily-version-3.
Seto, K.C., 2009, Global urban issues—A primer, chap. 1 of Gamba, P. and Herold, M., eds., Global mapping of human settlement— Experiences, datasets, and prospects: Boca Raton, Fla., CRC Press, p. 3–9, at http://dx.doi.org/10.1201/9781420083408-c1.
Thornton, P.E., Thornton, M.M., Mayer, B.W., Wilhelmi, N., Wei, Y., Devarakonda, R., and Cook, R.B., 2012, Daymet—Daily surface weather data on a 1-km grid for North America, version 2: ORNL DAAC database, accessed May 10, 2016, at http://dx.doi.org/10.3334/ORNLDAAC/1219.
U.S. Census Bureau, 2010, 2010 census urban area facts: United States Census Bureau Web page, accessed May 10, 2016, at http://www.census.gov/geo/reference/ua/uafacts.html.
Material written by Cole Krehbiel1
1 Innovate!, Inc., contractor to the U.S. Geological Survey, Earth Resources Observation and Science (EROS) Center, Sioux Falls, South Dakota, USA. Work performed under USGS contract G15PD00766 for LP DAAC2.
2 LP DAAC Work performed under NASA contract NNG14HH33I.