Data products distributed by the Land Processes Distributed Active Archive Center (LP DAAC) are used in many different Earth Science applications. LP DAAC data products play an important role in modeling, detecting changes to the landscape, and assessing ecosystem variables, to name a few. Three of those applications, published between April and June 2021, are highlighted below. A more comprehensive list is available on the LP DAAC Publications web page.
Mohamed, E., Gahalaut, V., Sekertekin, A., and Inyurt, S., 2021, Atmospheric, ionospheric and Earth-related variations associated with the 11th August 2012 earthquakes, Ahar, Iran: Journal of Atmospheric and Solar-Terrestrial Physics, v. 216, article 105595, at https://doi.org/10.1016/j.jastp.2021.105595.
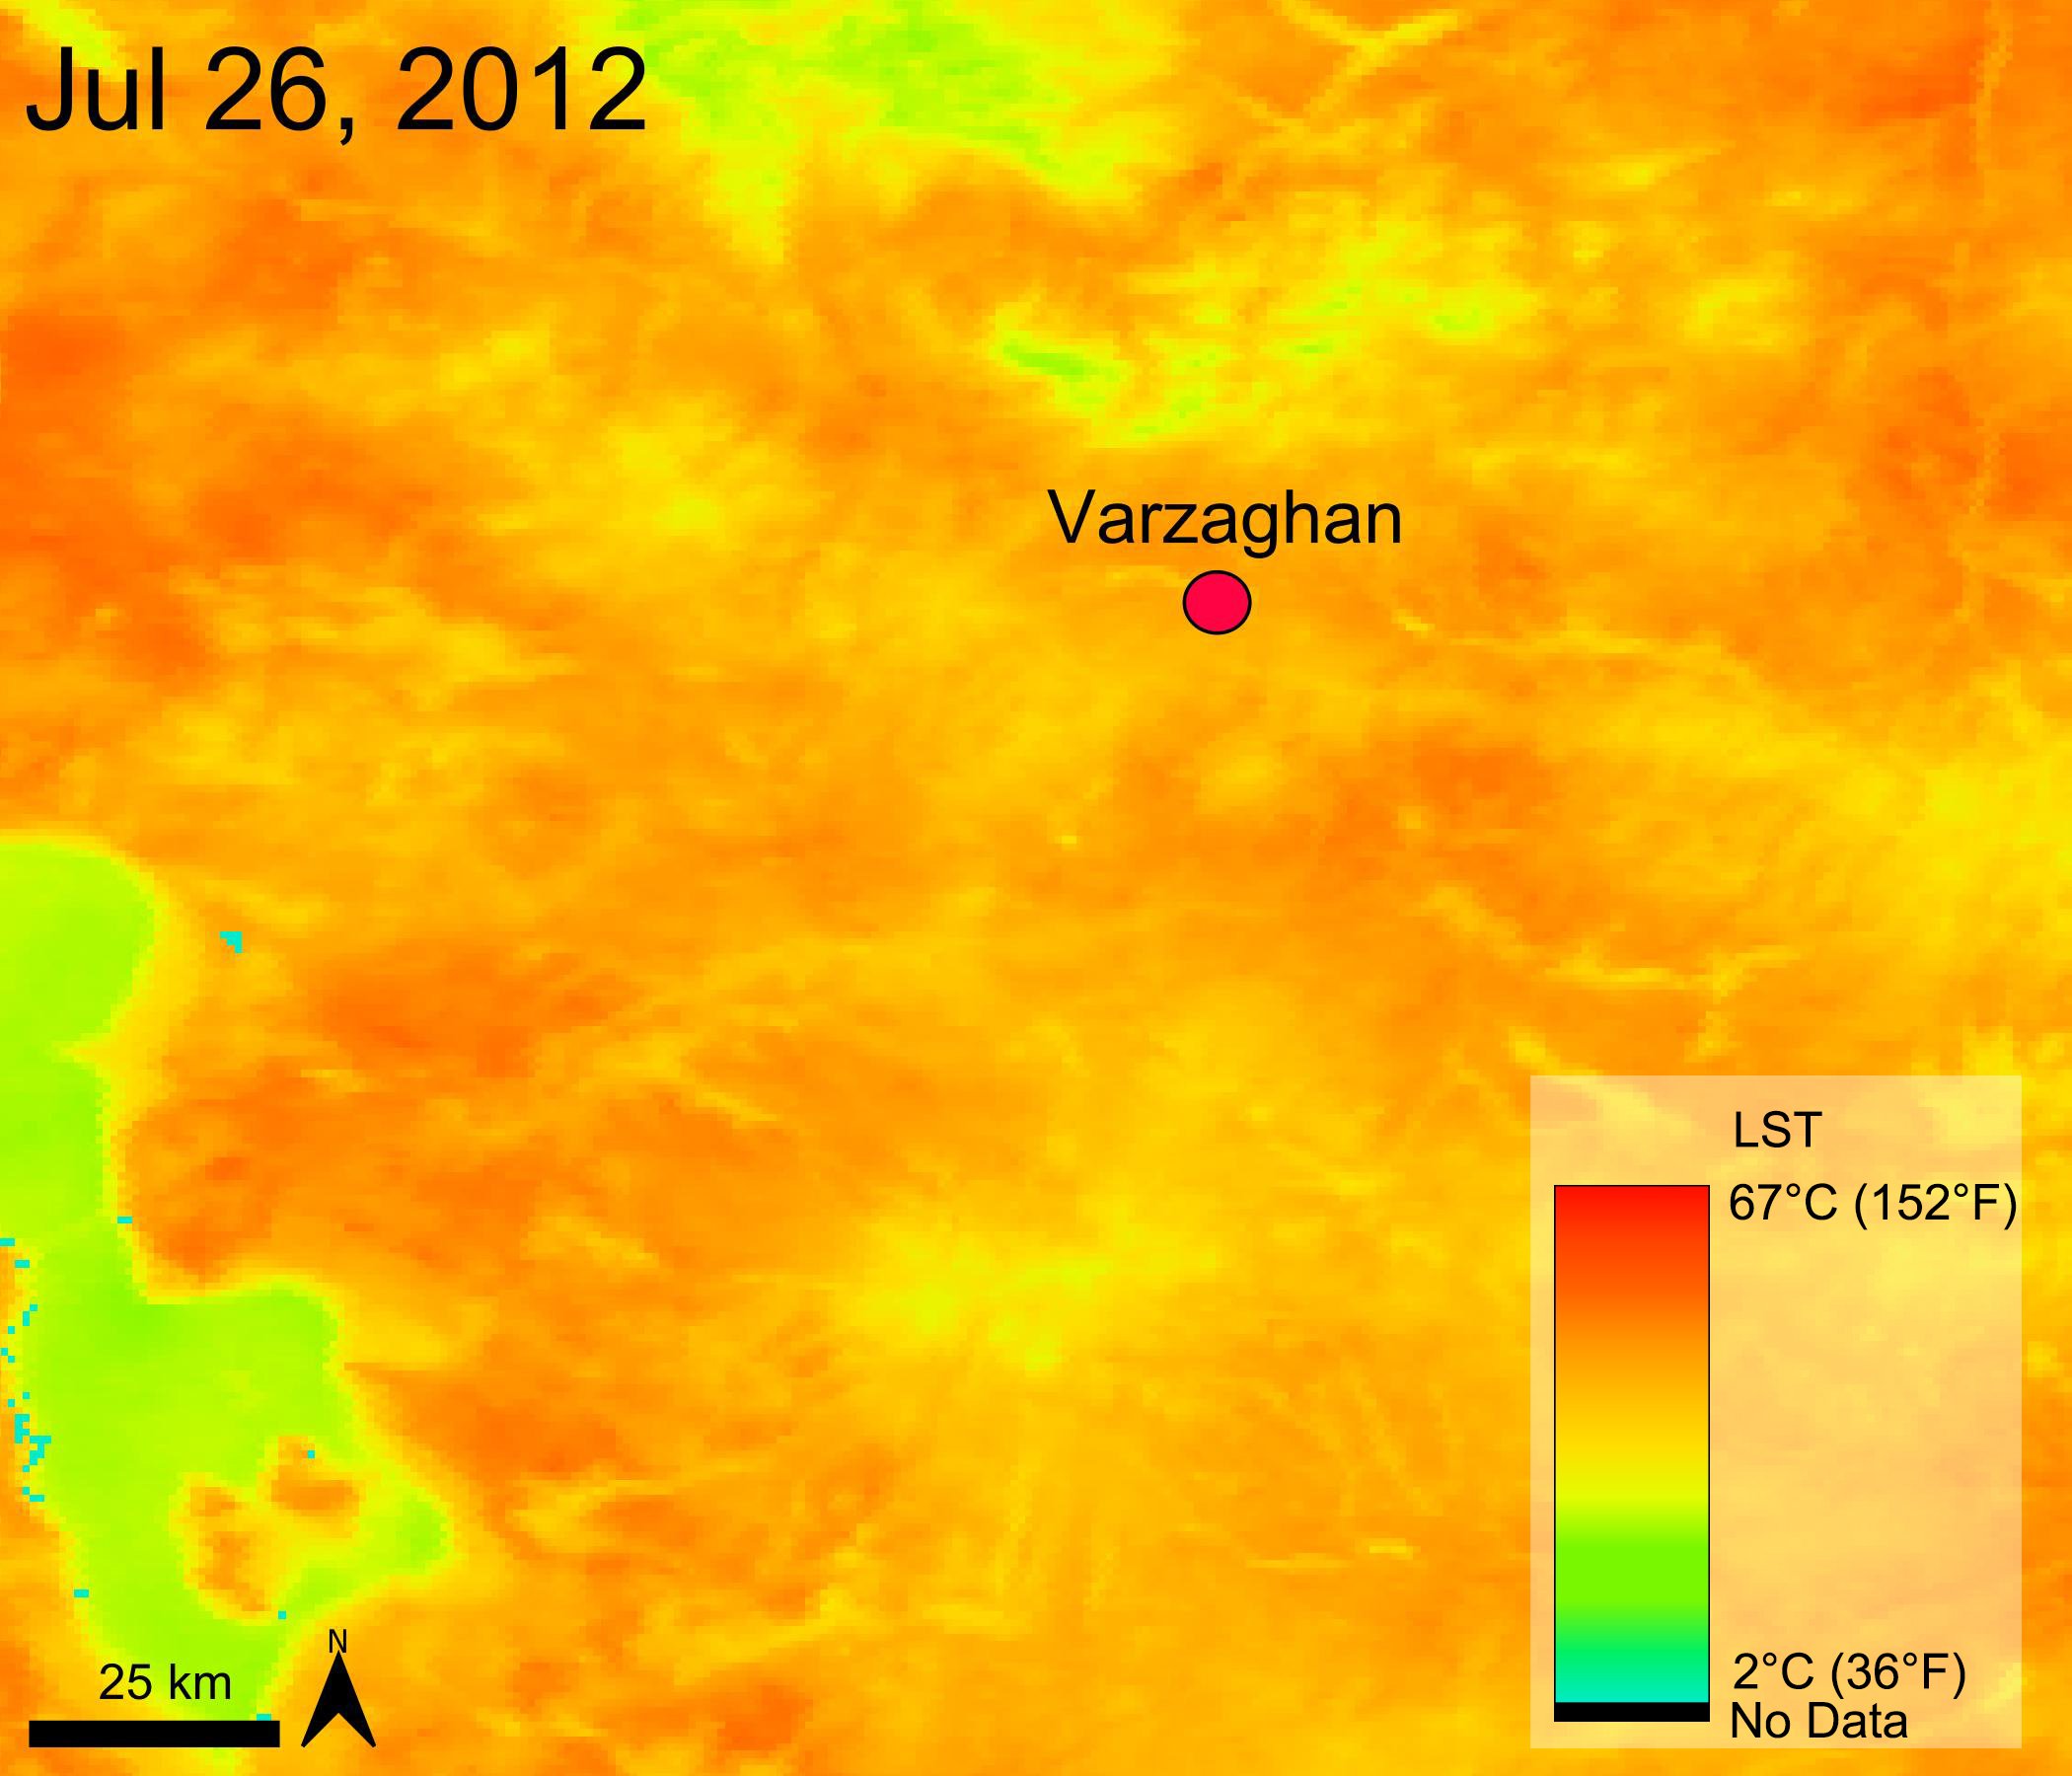
Daytime Land Surface Temperature over the study area of Mohamed and others (2021) during one of the days identified as having the highest temperatures. Varzaghan is located just northeast of the epicenters of the two earthquakes investigated in this paper.
See Data References below for more information on the data.
Earthquakes happen across the globe and are not only extremely dangerous but can also cause huge economic losses where they occur. What if we could predict when an earthquake might happen using remote sensing data? That is what Mohamed and others (2021) set out to do in their paper. The authors investigated if changes in non-seismic phenomena, including land surface temperature (LST), total electron content (TEC), outgoing longwave radiation (OLR), and air temperature (AT) are precursors for seismic activity. For their study, the authors examined data before and after two strong moment magnitude (Mw) 6.4 and Mw 6.3 earthquakes in the East Azerbaijan Province of northwest Iran that occurred on August 11, 2012. For the LST component of their study, the authors used Terra Moderate Resolution Imaging Spectroradiometer (MODIS) Daily LST (MOD11A1) data to examine the LST of the area 20 days before and 5 days after these two earthquakes. Previous research shows that an increase in stress across a causative fault line leads to micro fracturing and subsurface degassing that increases LST. Therefore, detection of an increase in LST could warn us of an impending earthquake. The authors used a generalized split-window algorithm to retrieve the LST values within 30 kilometers (19 miles) of the epicenter and then identified the standard deviation of the values. A ±2 standard deviation (95 percent confidence level) interval was considered to be an anomaly indicator measure. The highest daytime LST values observed were on July 24 and 26, shown in the image to the left, as well as August 9 and 16. The values on August 16 were attributed to aftershocks and additional moderate earthquakes at the epicenter. The highest nighttime LST values were observed two days before and two days after the earthquakes. The mean daytime LST increased from July 30 to the day of the earthquakes, but after the earthquakes the LST was more stable. A decrease in nighttime LST of 5.5-6.3 °C was found compared to the mean LST within 10 to 12 days before the earthquakes occurred, which was consistent with an anomaly observed in OLR on July 29, 2012. The LST results were identical to the AT analysis as well. According to the authors, this highlights the importance of potential corresponding precursors for seismologists. The authors note that additional research on other methods, data types, and statistical analyses should still be conducted.
(Author’s note: Mohamed and others (2021) used Terra MODIS Daily LST Version 6 data. The LP DAAC recently released Terra MODIS Version 6.1 data. The corresponding data product can be found here: https://doi.org/10.5067/MODIS/MOD11A1.061.)
Poulos, H.M., Barton, A.M., Koch, G.W., Kolb, T.E., and Thode, A.E., 2021, Wildfire severity and vegetation recovery drive post-fire evapotranspiration in a southwestern pine-oak forest, Arizona, USA: Remote Sensing in Ecology and Conservation, Early View article posted May 8, 2021, 13 p., accessed June 25, 2021, at https://doi.org/10.1002/rse2.210.
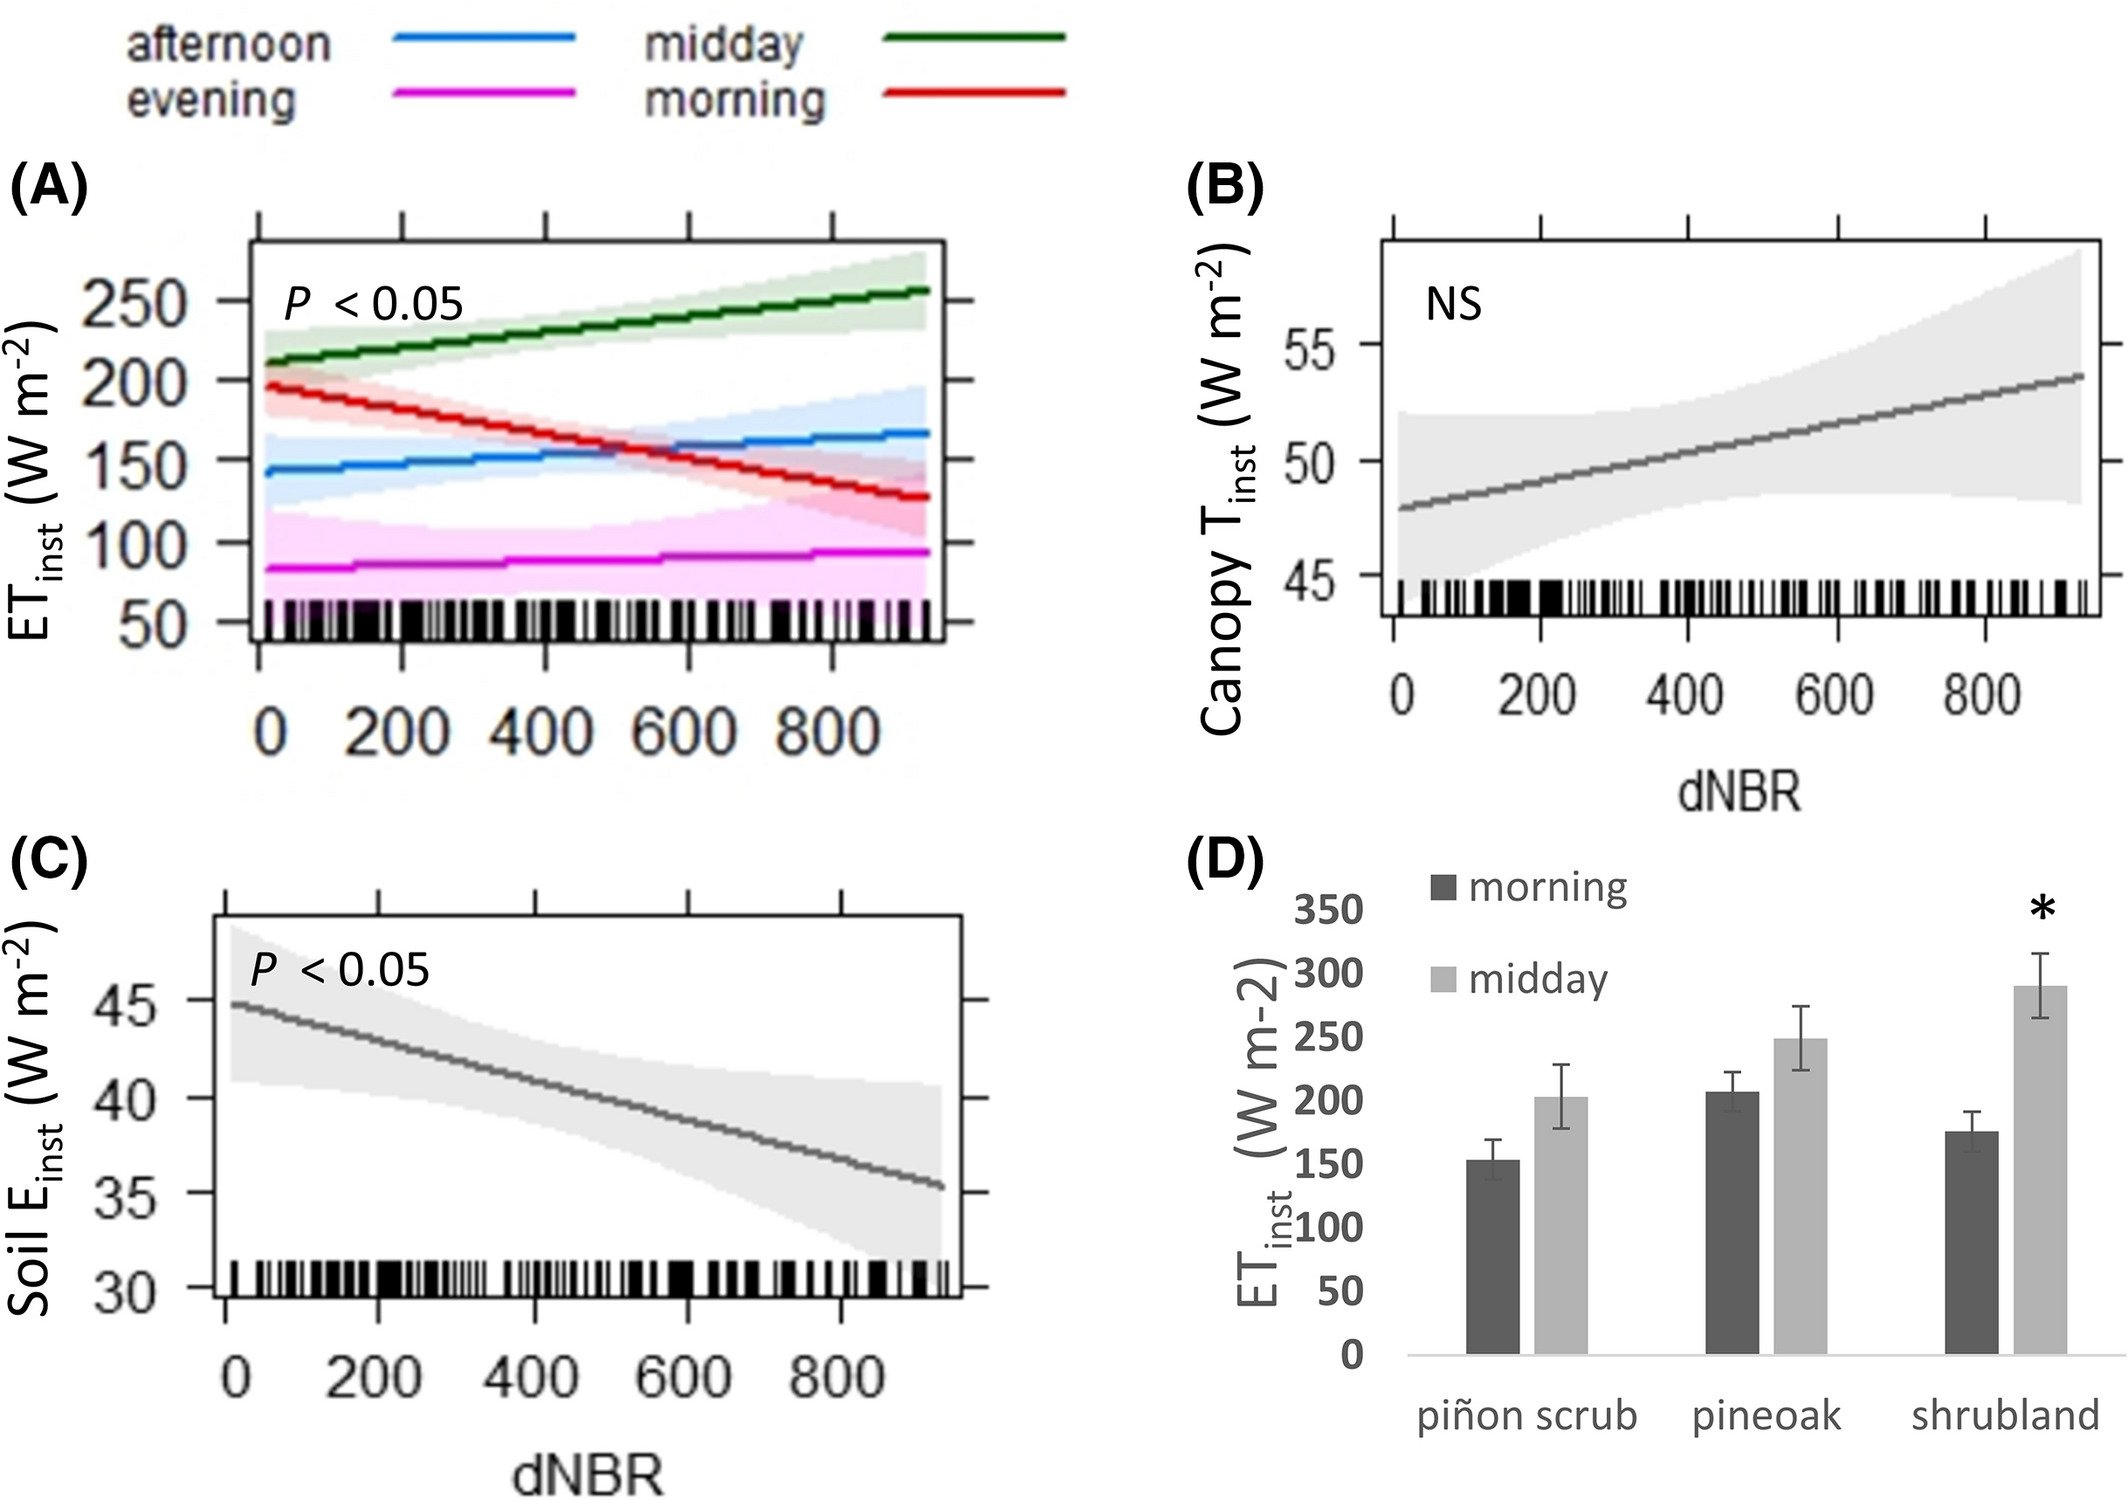
Effects plots of (A) diurnal variation in instantaneous evapotranspiration (ETinst), which differed across the day, (B) morning canopy transpiration (Tinst) and (C) morning soil evaporation (Einst), and (D) mean ETinst‑for morning and midday by vegetation type.
Graphs and caption provided by the authors, Poulos and others (2021).
Poulos and others (2021) looked at examining post-fire physiological responses of vegetation by combining field vegetation data with remotely sensed estimates of fire severity and evapotranspiration (ET). For their study, the authors examined vegetation in the Cave Creek Canyon of the Coronado National Forest in Arizona after the 2011 Horseshoe Two Fire. The remote sensing data the authors used included daily ECOsystem Spaceborne Thermal Radiometer Experiment on Space Station (ECOSTRESS) Evapotranspiration and Priestly-Taylor Jet Propulsion Laboratory (PT-JPL) ET (ECO3ETPTJPL) data as a proxy for in-situ ET measurements, as well as Landsat Enhanced Thematic Mapper Plus (ETM+) using a raster delta normalized burn ratio to evaluate the influence of fire severity on post-fire ET, and Landsat 8 for annual Enhanced Vegetation Index (EVI) composite values. The authors obtained the ECOSTRESS data using the Application for Extracting and Exploring Analysis Ready Samples (AρρEEARS). They chose to use ECOSTRESS-based ET estimates due to its 70 meter resolution, which they believe is crucial for measuring ET in fine-grained environments. First the authors filtered for cloud-free images, then they performed a series of linear mixed effects analyses to assess the relationship between ECOSTRESS ET and fire severity, woody plant species composition after the fire, and EVI. The authors also used separate models to examine ET over diurnal cycles and seasons between various vegetation types. They found that post-fire ET was significantly related to plant species composition, and that fire severity was not a significant driver of post-fire daily ET. Values of ET were significantly higher in the morning and midday in the denser shrublands as compared to the pine-dominated forests. They also found functional traits of plant species, including resprouting and desiccation tolerance, drove ET patterns in a post-fire area. Finally, the authors found ECOSTRESS’ frequent and large spatial coverage provided an important opportunity to evaluate landscape-scale patterns of vegetation-influenced ET after a fire. However, since this was the first study of its kind, the authors believe future field validation of ECOSTRESS is needed.
Jarrett, C., Smith, T.B., Claire, T.T.R., Ferriera, D.F., Tchoumbou, M., Elikwo, M.N.F., Wolfe, J., Brzeski, K., Welch, A.J., Hanna, R., and Powell, L.L., 2021, Bird communities in African cocoa agroforestry are diverse but lack specialized insectivores: Journal of Applied Ecology, v. 58, no. 6, p. 1237–1247, at https://doi.org/10.1111/1365-2664.13864.
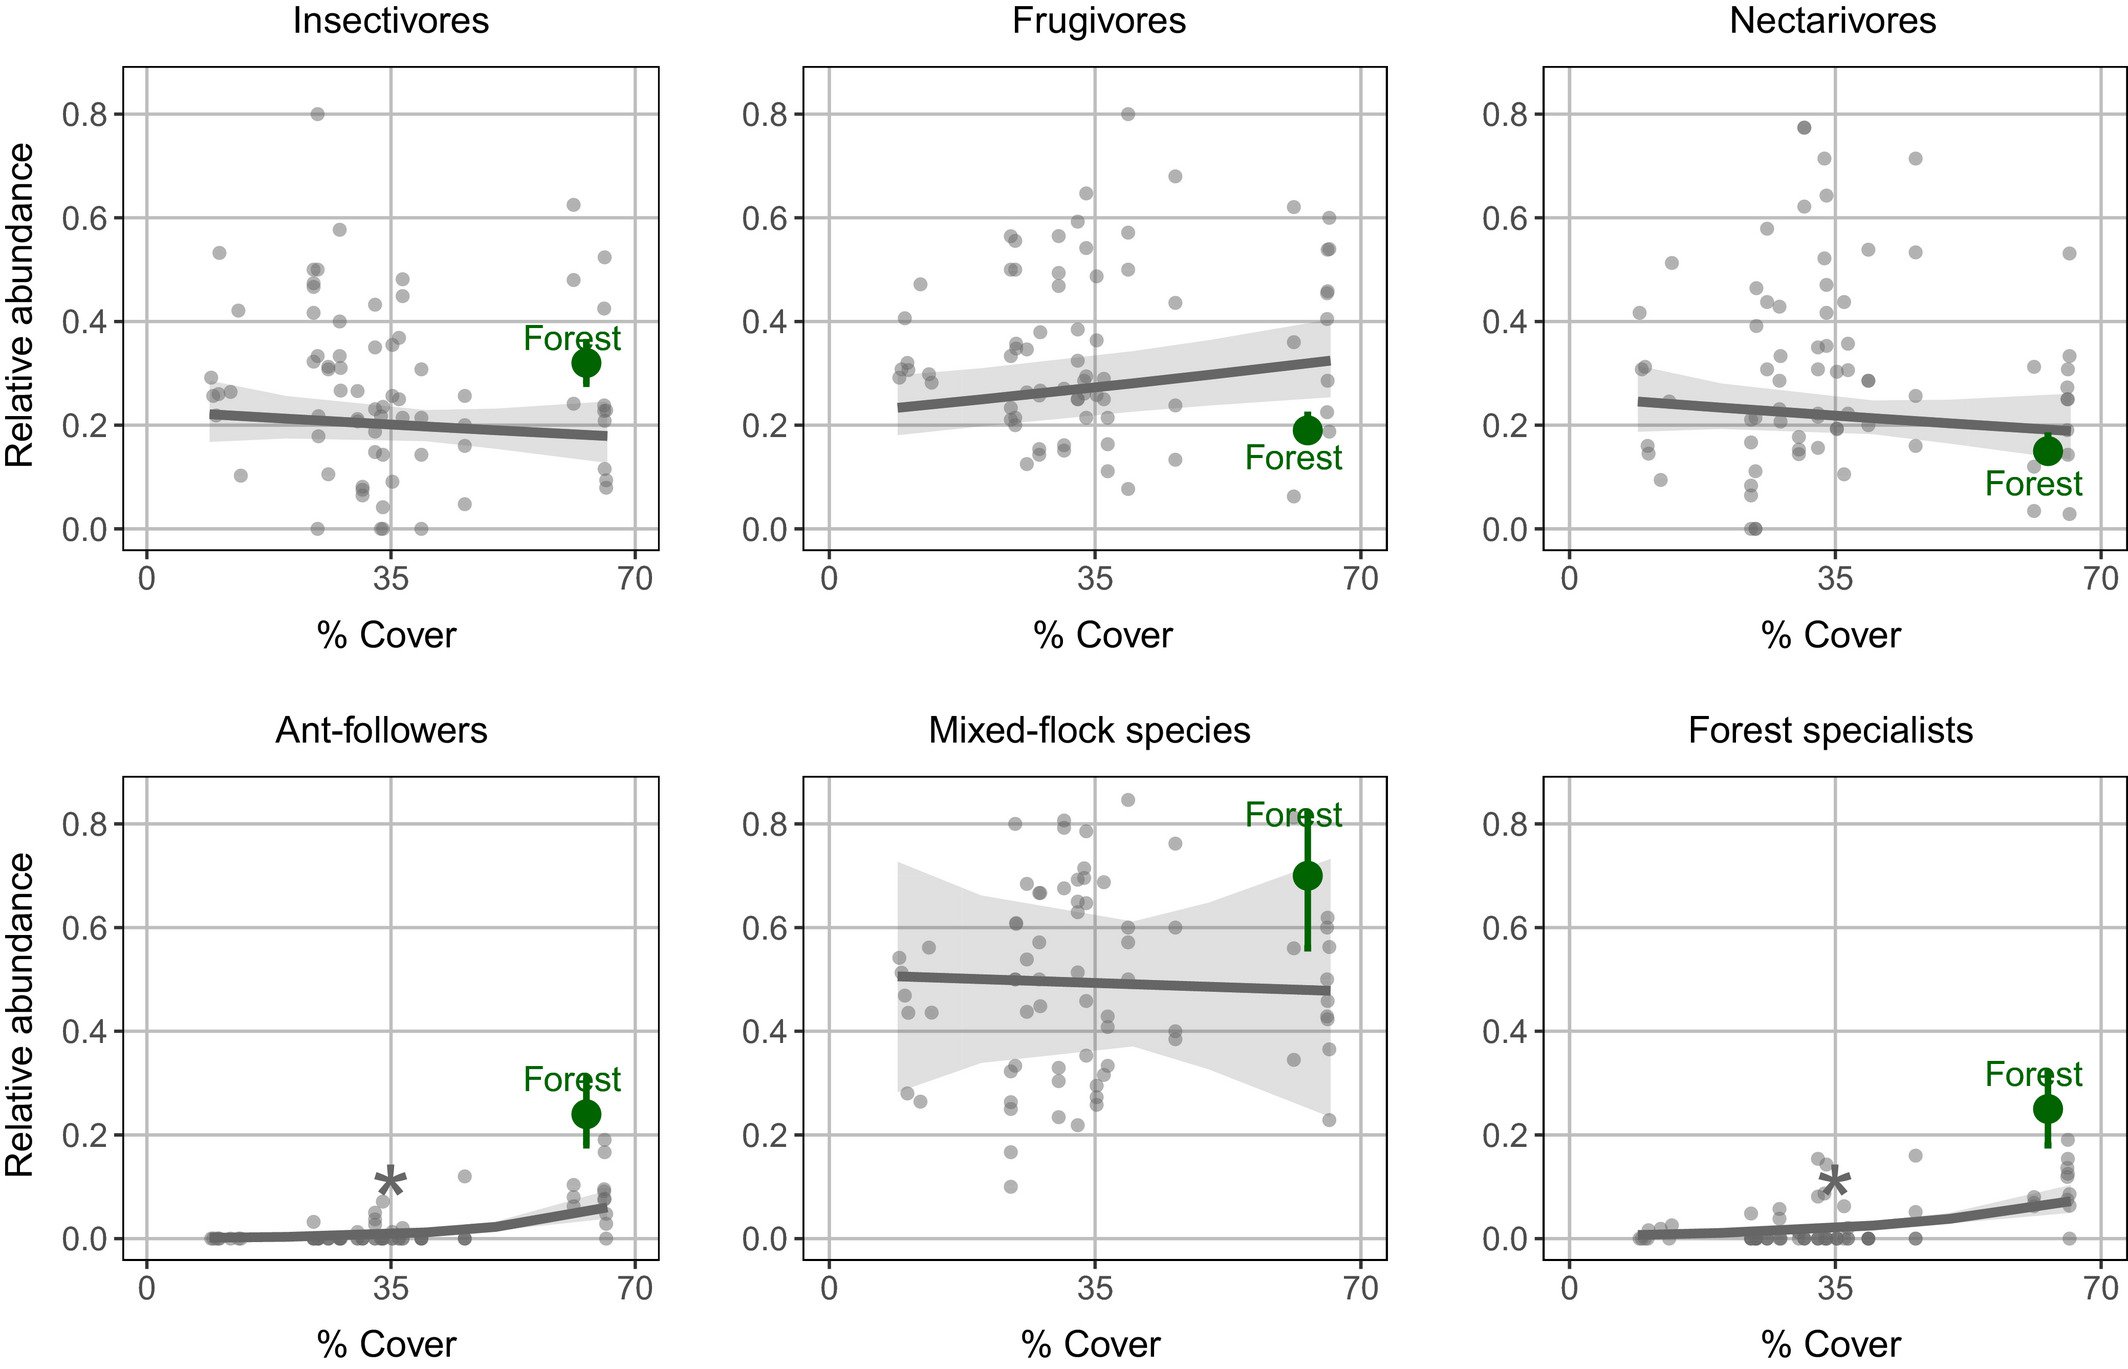
Effect of landscape forest cover on the relative abundance of foraging guilds. The line indicates the effect size predicted by the minimal adequate model and the shading corresponds to the 95% CIs. The asterisks indicate statistical significance. The point represents the relative abundance of the corresponding foraging guild in mature forest, with associated CIs. The dots correspond to the raw data
Image and caption provided by the authors, Jarrett and others (2021).
According to Jarrett and others (2021), cocoa is the fastest growing export crop in the Afrotropics, leading to an ongoing expansion of cocoa agriculture. This growth is contributing to the loss of 80 percent of rainforest cover in some African countries. The conversion of forest to cocoa agriculture, which removes vegetation understory, is impacting the animals that live there. This includes understory birds, causing a decline in both their population numbers and population diversity. In this paper, the authors provided an in-depth look at bird diversity and community composition, mainly of ant-followers and mixed-flock species, in African cocoa farms in southern Cameroon and Equatorial Guinea. The authors were particularly interested in the diversity of bird communities and composition in cocoa farms vs forests and how shade and forest cover influenced bird communities in the cocoa farms. To answer that last question, the authors used Combined Moderate Resolution Imaging Spectroradiometer (MODIS) Vegetation Continuous Fields (MOD44B) data from the year 2018 to measure forest cover. First, they created a 1.4, 2.5 and 4 kilometer (0.8, 1.5, 2.5 mile) radius buffer around each cocoa farm and then extracted the mean percentage tree cover from the pixels in the buffer. They found the forest cover ranged from 65.8 percent in farms next to a forest reserve to just 9 percent in urbanized areas. Then they used generalized linear mixed models (GLMMs) to examine the differences in bird communities between forest and cocoa and the effect of shade and forest cover on bird community compositions for 28 farms. Through their use of in-situ bird and shade data they found that sunny African cocoa farms were less able to support more sensitive bird guilds, as compared to shaded farms near forests. They also found that certain species that rely on specific ecological and dietary parameters, such as the ant-followers, are disproportionately impacted by land-use change. While shade and forest cover had no effect on relative overall species richness of several different types of birds, the ant-followers were found to significantly increase, 5 to 18 percent, at high forest cover farms. The authors believe results from their study can provide policymakers with information for more wildlife-friendly cocoa farm systems that can maximize bird diversity. Based on their research they found low intensity, shaded cocoa farms do provide habitat for forest birds but also produce high yields and income due to having less pests and more trees with a longer productive lifespan. They note future studies should consider demographic and morphological data to show the value of agroforestry systems that serve as a habitat buffer and corridor for wildlife.
Data References
Image 1:
MOD11A1 data access via AppEEARS.
AppEEARS Team. (2021). Application for Extracting and Exploring Analysis Ready Samples (AppEEARS). Ver. 2.61. NASA EOSDIS Land Processes Distributed Active Archive Center (LP DAAC), USGS/Earth Resources Observation and Science (EROS) Center, Sioux Falls, South Dakota, USA. Accessed June 25, 2021. https://lpdaacsvc.cr.usgs.gov/appeears
Data Granule IDs:
MOD11A1.A2012208.h21v05.006.2016115095248
MOD11A1.A2012208.h22v05.006.2016115095252
Wan, Z., S. Hook, G. Hulley. MOD11A1 MODIS/Terra Land Surface Temperature/Emissivity Daily L3 Global 1km SIN Grid V006. 2015, distributed by NASA EOSDIS Land Processes DAAC, . Accessed 2021-06-25.
Material written by Danielle Golon1
1C2G, contractor to the U.S. Geological Survey, Earth Resources Observation and Science (EROS) Center, Sioux Falls, South Dakota, USA. Work performed under USGS contract G0121D0001 for LP DAAC2.
2 LP DAAC Work performed under NASA contract NNG14HH33I.