Data products distributed by the EOSDIS Land Processes Distributed Active Archive Center (LP DAAC) are used in many Earth Science applications and play an important role in earth system modeling, detecting changes to the landscape, and assessing ecosystem variables. Three applications of LP DAAC data products published between April and June 2022 are highlighted below. A more comprehensive list is available on the LP DAAC Publications web page.
Cooley, S.S., Fisher, J.B., and Goldsmith, G.R., 2022, Convergence in water use efficiency within plant functional types across contrasting climates: Nature Plants, v. 8, no. 4, p. 341–345, at https://doi.org/10.1038/s41477-022-01131-z.
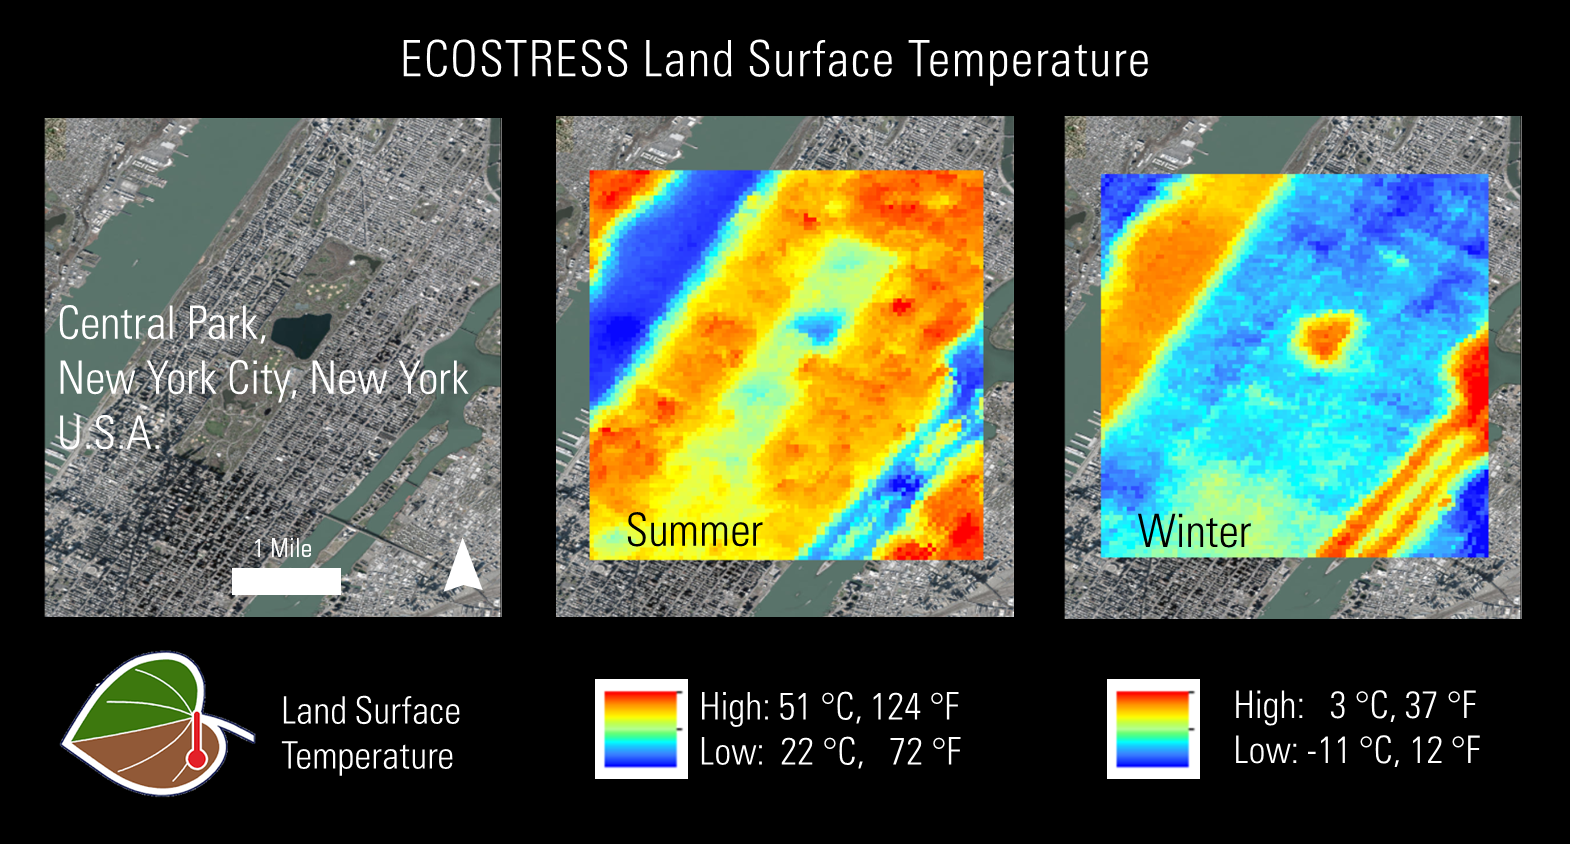
Example of temperature differences recorded by ECOSTRESS within seasons, using Central Park in New York City (a large area of vegetation surrounded by city and with a lake) in the summer (August 2018) and winter (January 2021).
Granule ID:
ECOSTRESS_L1B_GEO_02929_005_20190111T043638_0601_02.h5
ECOSTRESS_L2_LSTE_02929_005_20190111T043638_0601_02.h5
ECOSTRESS_L1B_GEO_06447_008_20190825T170920_0601_02.h5
ECOSTRESS_L2_LSTE_06447_008_20190825T170920_0601_02.h5
Citation:
Hook, S., and Hulley, G., 2019, ECOSTRESS Land Surface Temperature and Emissivity Daily L2 Global 70 m V001: NASA EOSDIS Land Processes Distributed Active Archive Center (LP DAAC), accessed August 4, 2022, at https://doi.org/10.5067/ECOSTRESS/ECO2LSTE.001.
Data were accessed through AppEEARS (v. 3.6):
AppEEARS Team, 2022, Application for Extracting and Exploring Analysis Ready Samples (AppEEARS), Ver. 3.6: NASA EOSDIS Land Processes Distributed Active Archive Center (LP DAAC), USGS/Earth Resources Observation and Science (EROS) Center, Sioux Falls, South Dakota, USA, accessed July 28, 2022, at https://appeears.earthdatacloud.nasa.gov.
Water use efficiency is the ratio of energy produced (photosynthesis) to the amount of water evaporated (transpiration): in other words, how well plants grow when receiving a certain amount of water (based on climate and weather patterns). Understanding water use efficiency helps scientists predict how systems will respond to climate change. Until recently, insights were limited by the difficulty of capturing accurate and globally comparable measurements; however, with the presence of the ECOsystem Spaceborne Thermal Radiometer Experiment on Space Station (ECOSTRESS) onboard the International Space Station, that is changing. ECOSTRESS was first added to the International Space Station in 2018 and now has nearly four years of data available. ECOSTRESS data is distributed by NASA’s Land Processes Distributed Active Archive Center (LP DAAC) and is available for download at no cost and accessible through NASA’s Application for Extracting and Exploring Analysis Ready Samples (AppEEARS). Scientist Savannah Cooley and others (2022) recently used ECOSTRESS-derived measurements (daily evapotranspiration ECO3ETPTJPL, daily evaporative stress index ECO4ESIPTJPL, daily water use efficiency ECO4WUE, and daily land surface temperature, ECO2LSTE) to compare water use efficiency at multiple locations around the world. ECOSTRESS measurements are particularly useful because they provide access to frequent information (approximately every 5 days) about water use efficiency at a high spatial resolution (70 meters (m)) throughout the year. Cooley and others used ECOSTRESS data to document substantial local variation in water use efficiency. They also learned that many of the ecosystems studied, including wetlands, savannas, and forests, have similar water use efficiency values despite their location in different climatic zones. This suggests that the form and function of plants, rather than only climate, plays a strong role in controlling the ability of ecosystems to convert light into energy while using water—water use efficiency.
Musthafa, M., and Singh, G., 2022, Forest above-ground woody biomass estimation using multi-temporal space-borne LiDAR data in a managed forest at Haldwani, India: Advances in Space Research, v. 69, no. 9, p. 3245–3257, at https://doi.org/10.1016/j.asr.2022.02.002.
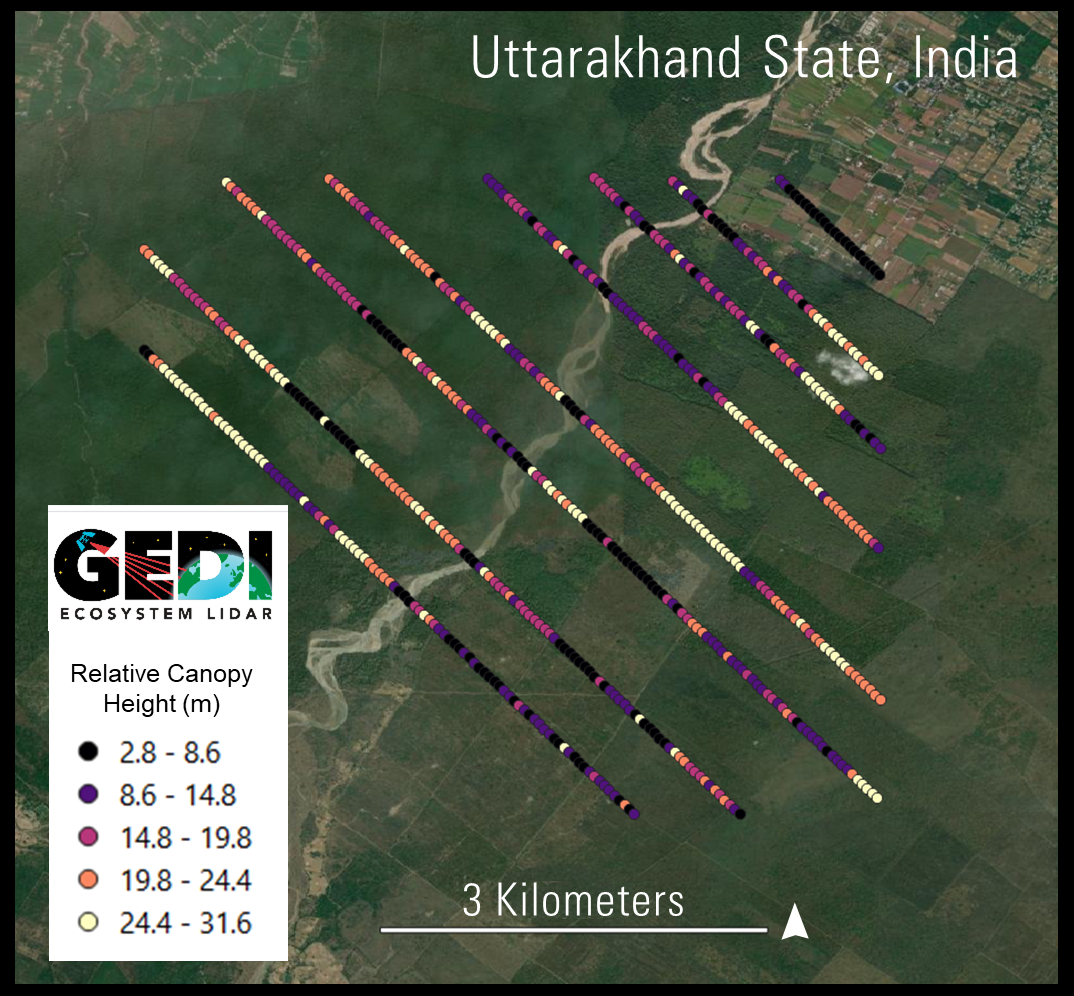
GEDI tracks in study area (Uttarakhand State, India) showing the relative height of tree canopies in meters.
Granule ID:
GEDI02_A_2021249010758_O15481_03_T07863_02_003_02_V002
Data Citation:
Dubayah, R., Hofton, M., Blair, J., Armston, J., Tang, H., and Luthcke, S., 2021, GEDI L2A Elevation and Height Metrics Data Global Footprint Level V002: NASA EOSDIS Land Processes Distributed Active Archive Center (LP DAAC), accessed August 4, 2022, at https://doi.org/10.5067/GEDI/GEDI02_A.002.
Trees store carbon in their trunks and root systems. Efforts to quantify, monitor, and map trees have peaked recently with the introduction of carbon offset markets—an economic incentive system to reduce carbon emissions and impact the trajectory of climate change. In large part, carbon markets depend on accurate information about how much carbon, i.e., tree biomass, is stored in a forest. Field measurements alone cannot accommodate this need; however, by pairing field data on tree species and biomass with satellite-derived tree height measurements, scientists are able to model and accurately estimate tree biomass and, thus, forest wide carbon stocks over vast areas. Musthafa and Singh (2022) recently developed an above-ground biomass model for trees in an area of managed forest in India that estimates forest-wide biomass using satellite-based Light Detection And Ranging (LiDAR) data from the Global Ecosystem Dynamics Investigation instrument (GEDI) on the International Space Station, which they paired with field data. GEDI is a full-waveform LiDAR instrument that sends out laser pulses from space that travel to Earth and bounce off the ground, trees, and other structural elements. Portions of the laser pulse ultimately make their way back to the sensor and create waveforms that quantify the vertical structure of the landscape from which tree canopy height can be derived (see GEDI video). Using the Geolocated Elevation and Height Metrics Product (GEDI02_Av002) and field data, Musthafa and Singh (2022) calibrated a biomass model for a managed forest in the Terai Central Forest Division in India, achieving 75 percent accuracy. Their success demonstrates the feasibility of developing high-quality forest biomass models without the use of additional plane or ground-based LiDAR sensors for calibration.
Pascolini‐Campbell, M., Lee, C., Stavros, N., and Fisher, J.B., 2022, ECOSTRESS reveals pre‐fire vegetation controls on burn severity for Southern California wildfires of 2020: Global Ecology and Biogeography, in press, at https://doi.org/10.1111/geb.13526.

ECOSTRESS imagery from the 2020 Apple Fire in southern California.
Granule ID:
ECOSTRESS_L1B_GEO_11753_001_20200801T211556_0601_01.h5
ECOSTRESS_L1B_GEO_11753_002_20200801T211648_0601_01.h5
ECOSTRESS_L2_LSTE_11753_001_20200801T211556_0601_01.h5
ECOSTRESS_L2_LSTE_11753_002_20200801T211648_0601_01.h5
Citation:
Hook, S., and Hulley, G., 2019, ECOSTRESS Land Surface Temperature and Emissivity Daily L2 Global 70 m V001: NASA EOSDIS Land Processes Distributed Active Archive Center (LP DAAC), accessed August 4, 2022, at https://doi.org/10.5067/ECOSTRESS/ECO2LSTE.001.
Data were accessed through AppEEARS (v. 3.6):
AppEEARS Team, 2022, Application for Extracting and Exploring Analysis Ready Samples (AppEEARS), Ver. 3.6: NASA EOSDIS Land Processes Distributed Active Archive Center (LP DAAC), USGS/Earth Resources Observation and Science (EROS) Center, Sioux Falls, South Dakota, USA, accessed July 28, 2022, at https://appeears.earthdatacloud.nasa.gov.
Wildfires are an growing burden and ongoing threat to many western regions in the United States. As climate and water availability patterns change and expand the frequency of wildfires, it is becoming increasingly important to understand fire events. Using the ECOsystem Spaceborne Thermal Radiometer Experiment on Space Station (ECOSTRESS), scientists are now able to evaluate pre-fire vegetation moisture conditions, including daily evapotranspiration (ECO3ETPTJPL), daily evaporative stress index (ECO4ESIPTJPL), and daily water use efficiency (ECO4WUE) to investigate how these conditions impact the spatial distribution and severity of fires. Pascolini-Campbell and others (2022) recently capitalized on the high frequency (approximately every 5 days) and spatial resolution (70 meters (m)) of ECOSTRESS to characterize pre- and post- fire vegetation moisture in several areas that recently experienced fires in southern California. They used these characterizations, along with other relevant fire predictors, to model and better understand the factors that most strongly contribute to fire severity (completeness of burn). They found that quantifying pre-fire moisture conditions with ECOSTRESS-derived variables contributed considerably to burn severity models, especially for grasslands, savannas, and shrublands. ECOSTRESS data and models have the potential to directly inform fire management practices by providing high quality information on fuel loads (flammable materials) and how moisture content of those fuels varies. With improved information, fire fighters, community officials, and individuals are better prepared to meet ongoing fire-related challenges.
Material written by Bri Lind1
1KBR, contractor to the U.S. Geological Survey, Earth Resources Observation and Science (EROS) Center, Sioux Falls, South Dakota, USA. Work performed under USGS contract G0121D0001 for LP DAAC2.
2LP DAAC Work performed under NASA contract NNG14HH33I.