Data products distributed by the Land Processes Distributed Active Archive Center (LP DAAC) are used in many different Earth Science applications. LP DAAC data products play an important role in modeling, detecting changes to the landscape, and assessing ecosystem variables, to name a few. Three of those applications, published between January and March 2022, are highlighted below. A more comprehensive list is available on the LP DAAC Publications web page.
Leite, R.V., Silva, C.A., Broadbent, E.N., do Amaral, C.H., Liesenberg, V., de Almeida, D.R.A., Mohan, M., Godinho, S., Cardil, A., Hamamura, C., de Faria, B.L. et al., 2022, Large scale multi-layer fuel load characterization in tropical savanna using GEDI spaceborne lidar data: Remote Sensing of Environment, v. 268, article 112764, at https://doi.org/10.1016/j.rse.2021.112764.
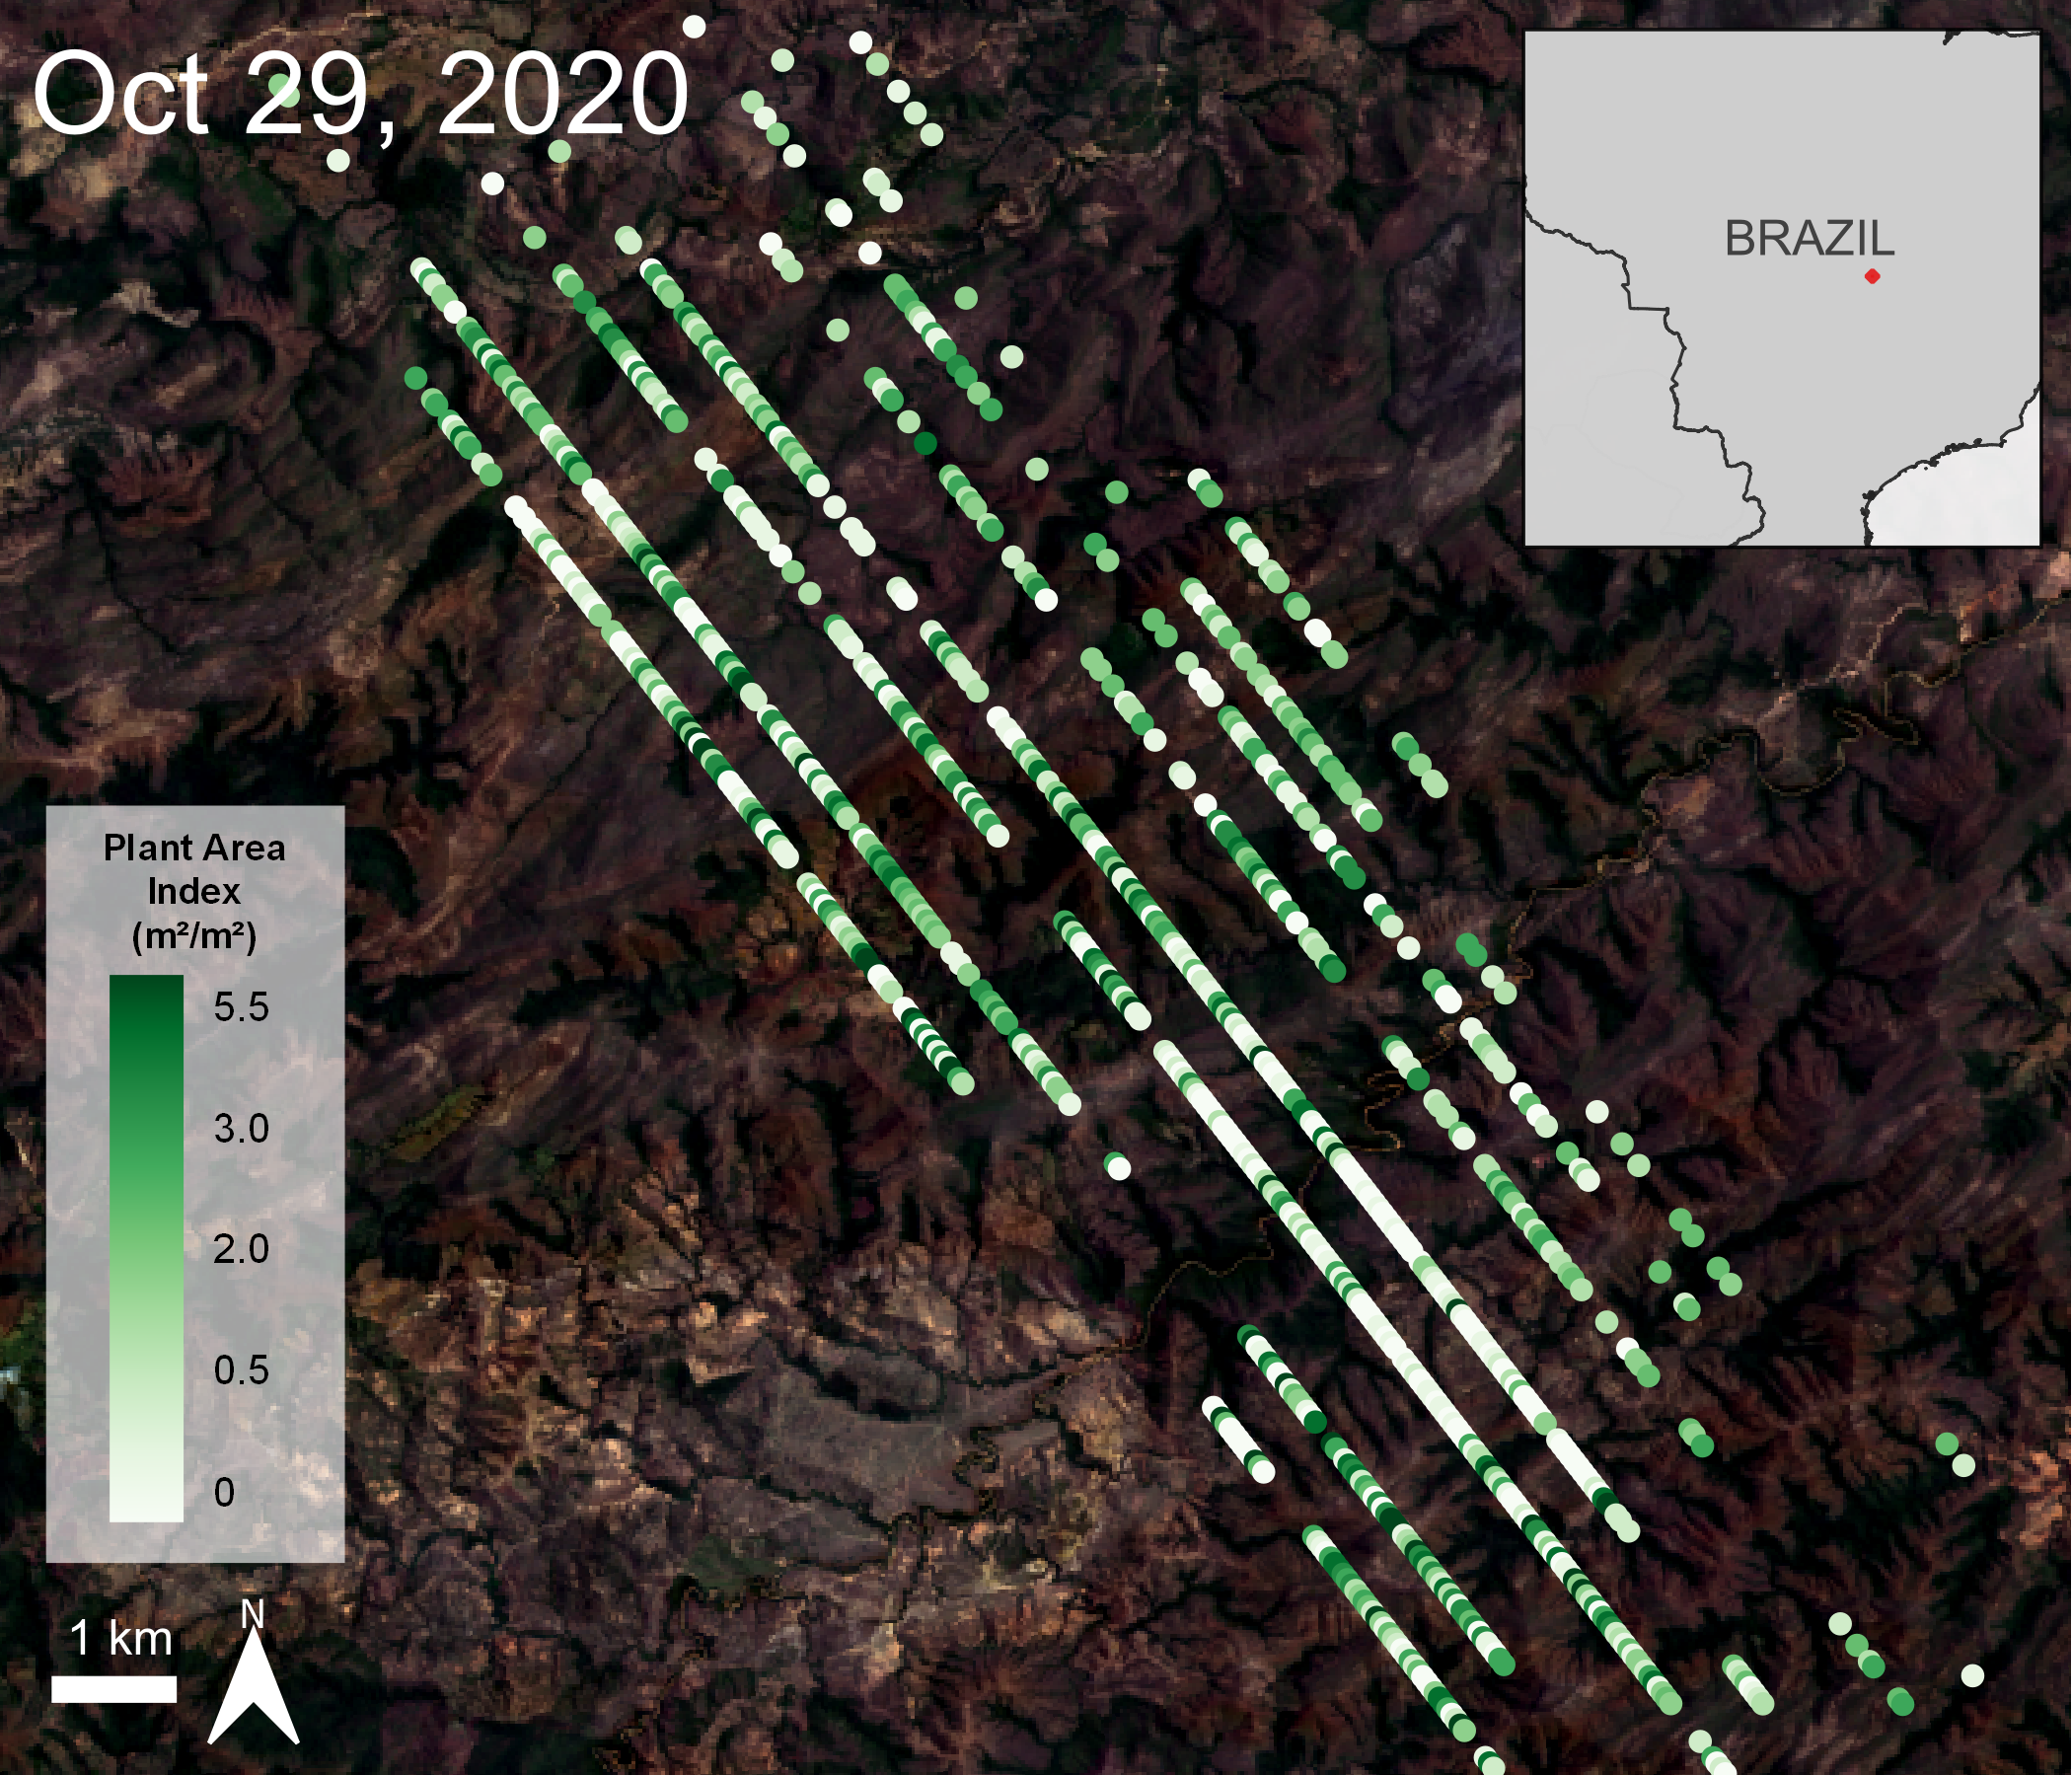
GEDI Level 2B Plant Area Index southwest of Chapada dos Veadeiros National Park, Brazil, on October 29, 2020, the last day in the study period of Liete and others (2022) with Harmonized Landsat Sentinel-2 (HLS) Sentinel-2 Multi-spectral Instrument Surface Reflectance as a basemap. The HLS tile location is shown in red on the inset map.
Granule IDs:
GEDI02_B_2020303150451_O10654_04_T09400_02_003_01_V002
HLS.S30.T22LGJ.2020288T133229.v2.0.B02
Citations:
Dubayah, R., Tang, H., Armston, J., Luthcke, S., Hofton, M., and Blair, J., 2021, GEDI L2B Canopy Cover and Vertical Profile Metrics Data Global Footprint Level V002: NASA EOSDIS Land Processes DAAC, accessed February 25, 2022, at https://doi.org/10.5067/GEDI/GEDI02_B.002.
Masek, J., Ju, J., Roger, J., Skakun, S., Vermote, E., Claverie, M., Dungan, J., Yin, Z., Freitag, B., and Justice, C., 2021, HLS Sentinel-2 Multi-spectral Instrument Surface Reflectance Daily Global 30m v2.0: NASA EOSDIS Land Processes DAAC, accessed March 1, 2022, at https://doi.org/10.5067/HLS/HLSS30.002.
Source of Administrative Boundaries: Global Administrative Unit Layers (GAUL) dataset, implemented by FAO within the CountrySTAT and Agricultural Market Information System (AMIS) projects.
Data accessed via Earthdata Search:
Earthdata, 2019, Earth Science Data and Information System (ESDIS) Project, Earth Science Projects Division (ESPD), Flight Projects Directorate, Goddard Space Flight Center (GSFC) National Aeronautics and Space Administration (NASA), accessed February 25, 2022, at https://search.earthdata.nasa.gov.
Minimizing the harmful effects of wildfires to biodiversity and ecosystem function requires an understanding of fuel load, or the quantity of combustible material present in a unit of area. In addition, regional fuel loads offer insight into climate-based regulation of carbon sources and sinks. Here, Liete and others (2022) utilize International Space Station (ISS) Global Ecosystem Dynamics Investigation (GEDI) Level 2A Geolocated Elevation and Height Metrics data (GEDI02_A), and Level 2B Canopy Cover and Vertical Profile Metrics (GEDI02_B) data to estimate fuel loads within the Cerrado, a wildfire-prone region in Brazil. The authors first collected lidar data using an unmanned aerial vehicle (UAV) over sample plots within the region associated with differing fuel loads, such as grassland, savannah, and forest. Within these regions, sample vegetation plots were measured to calculate surface fuel, herbaceous fuel, shrub and small tree fuel, woody fuel, and total fuel load. Next, the UAV-based lidar data was transformed into simulated GEDI data, and random forest models were constructed using the fuel measurements as response variables and GEDI metrics as predictors. After the models were constructed, GEDI Level 2A and 2B Version 2 data products, collected across the Cerrado between April 18, 2019, and October 29, 2020, were used to estimate the fuel loads across the entire region. The models performed well according to the authors, with an R2 > 0.78, root mean square error < 10.38 megagrams per hectare (Mg ha-1), and mean difference < 0.17 Mg ha-1. They performed best at estimating woody fuel (R2 = 0.88) and total fuel loads (R2 = 0.71). The models did not perform as well for the lower stratum fuels (closer to the ground) such as surface; herbaceous; and shrub and small tree. Across the Cerrado, fuel load quantities were observed to be associated with different vegetation formations; for example, woody fuels and total fuel estimates were higher in forested areas, while herbaceous fuels were higher in grasslands. The mean estimated values of surface, herbaceous, shrub and small trees, woody, and total fuels were: 7.63 ± 1.63, 7.87 ± 1.78, 7.58 ± 1.64, 10.29± 9.97 and 28.55 ± 11.4 Mg ha-1, respectively. Uncertainty was similar across the entire region, with higher uncertainty associated with regions having fewer GEDI footprints. The authors clearly demonstrated the successful use of GEDI Level 2A and 2B products to estimate multi-layer fire fuel loads at a large scale, an important contribution to wildfire prevention and planning.
Williams, D.B. and Ramsey, M.S., 2022, Analysis of ash emissions from the 2020 Nishinoshima eruption using ASTER thermal infrared orbital data: Journal of Volcanology and Geothermal Research, v. 421, article 107424, at https://doi.org/10.1016/j.jvolgeores.2021.107424.
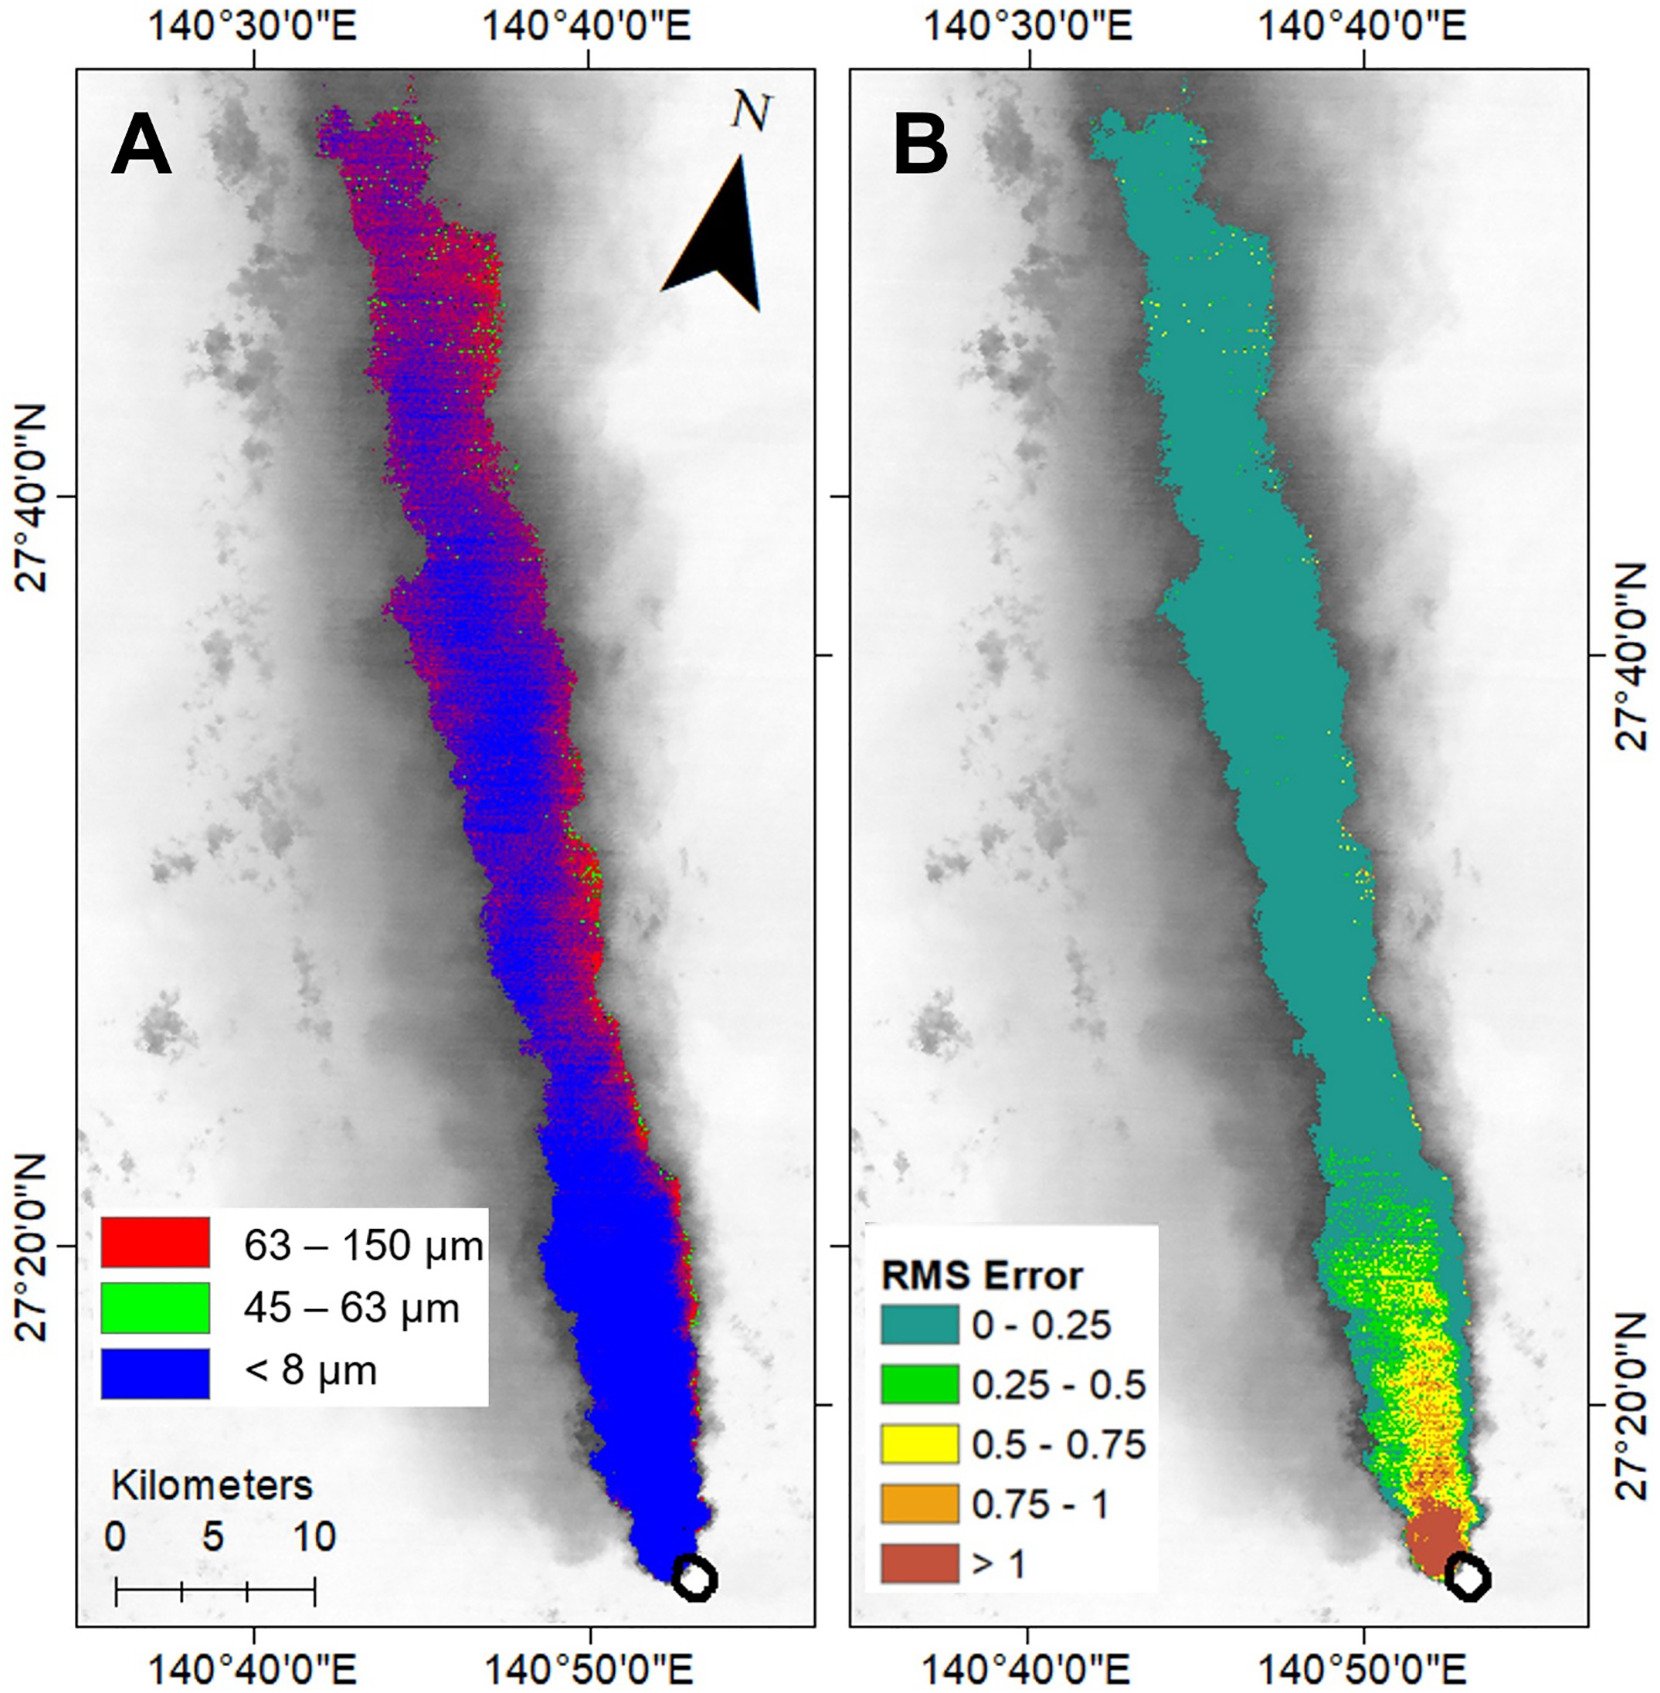
Maps of plume particles and root mean square (RMS) error created by Williams and Ramsey (2022).
Linear deconvolution results for the ASTER images acquired on 8 July 2020. The data were unmixed using the Santiaguito andesite end-member. (A) The three most dominant particle sizes, (B) The per-pixel RMS error result.
Image and caption provided by Williams and Ramsey (2022).
Volcanic activity resumed at the Nishinoshima Island located south of Japan in 2017. From December 2019–2020, eruptions produced new lava flows, and ash and gas plumes erupted up to 8.3 kilometers (5.2 miles) into the atmosphere. Williams and Ramsey (2022) used Terra Advanced Spaceborne Thermal Emission and reflection Radiometer (ASTER) Surface Emissivity (AST_05) to determine ash cloud composition and particle sizes from the eruptions in July 2020. The ASTER volcanic ash library (AVAL) is a series of spectral libraries containing infrared spectra of mineral samples in varying compositions from different eruptions. The authors applied a linear deconvolution model to the ASTER images of the eruption collected on July 8, 24, and 30, 2020, to approximate plume particle sizes and composition based upon the AVAL reference data. Two of the AVAL samples, one from the Santiaguito volcano in Guatemala, left image, and one from the Sakurajima volcano in Japan provided the best model fits, suggesting both plumes are composed of andesite (58.46–60.16 percent by weight silicon dioxide (SiO2)). The three most common particle sizes estimated from the images captured in July were 63–150 micrometers (µm), 45–63 µm, and < 8 µm. The smaller < 8 µm particles were found closest to the vent, with the two larger particle sizes appearing more toward the edges of the plume. The larger plumes from July 8 and 30 contained more < 8 µm particles. The estimated plume composition and particle sizes within agreed with other research focused on Nishinoshima, and, according to the authors, highlights the potential for Terra ASTER usage in estimating volcanic plume particle size and composition, as well as the use and expansion of the AVAL to further improve plume composition predictive capability.
Gelybó, G., Barcza, Z., Dencső, M., Potyó, I., Kása, I., Horel, Á, Pokovai, K., Birkás, M., Kern, A., Hollós, R., and Tóth, E. , 2022, Effect of tillage and crop type on soil respiration in a long-term field experiment on chernozem soil under temperate climate: Soil and Tillage Research, v. 216, article 105239, at https://doi.org/10.1016/j.still.2021.105239.
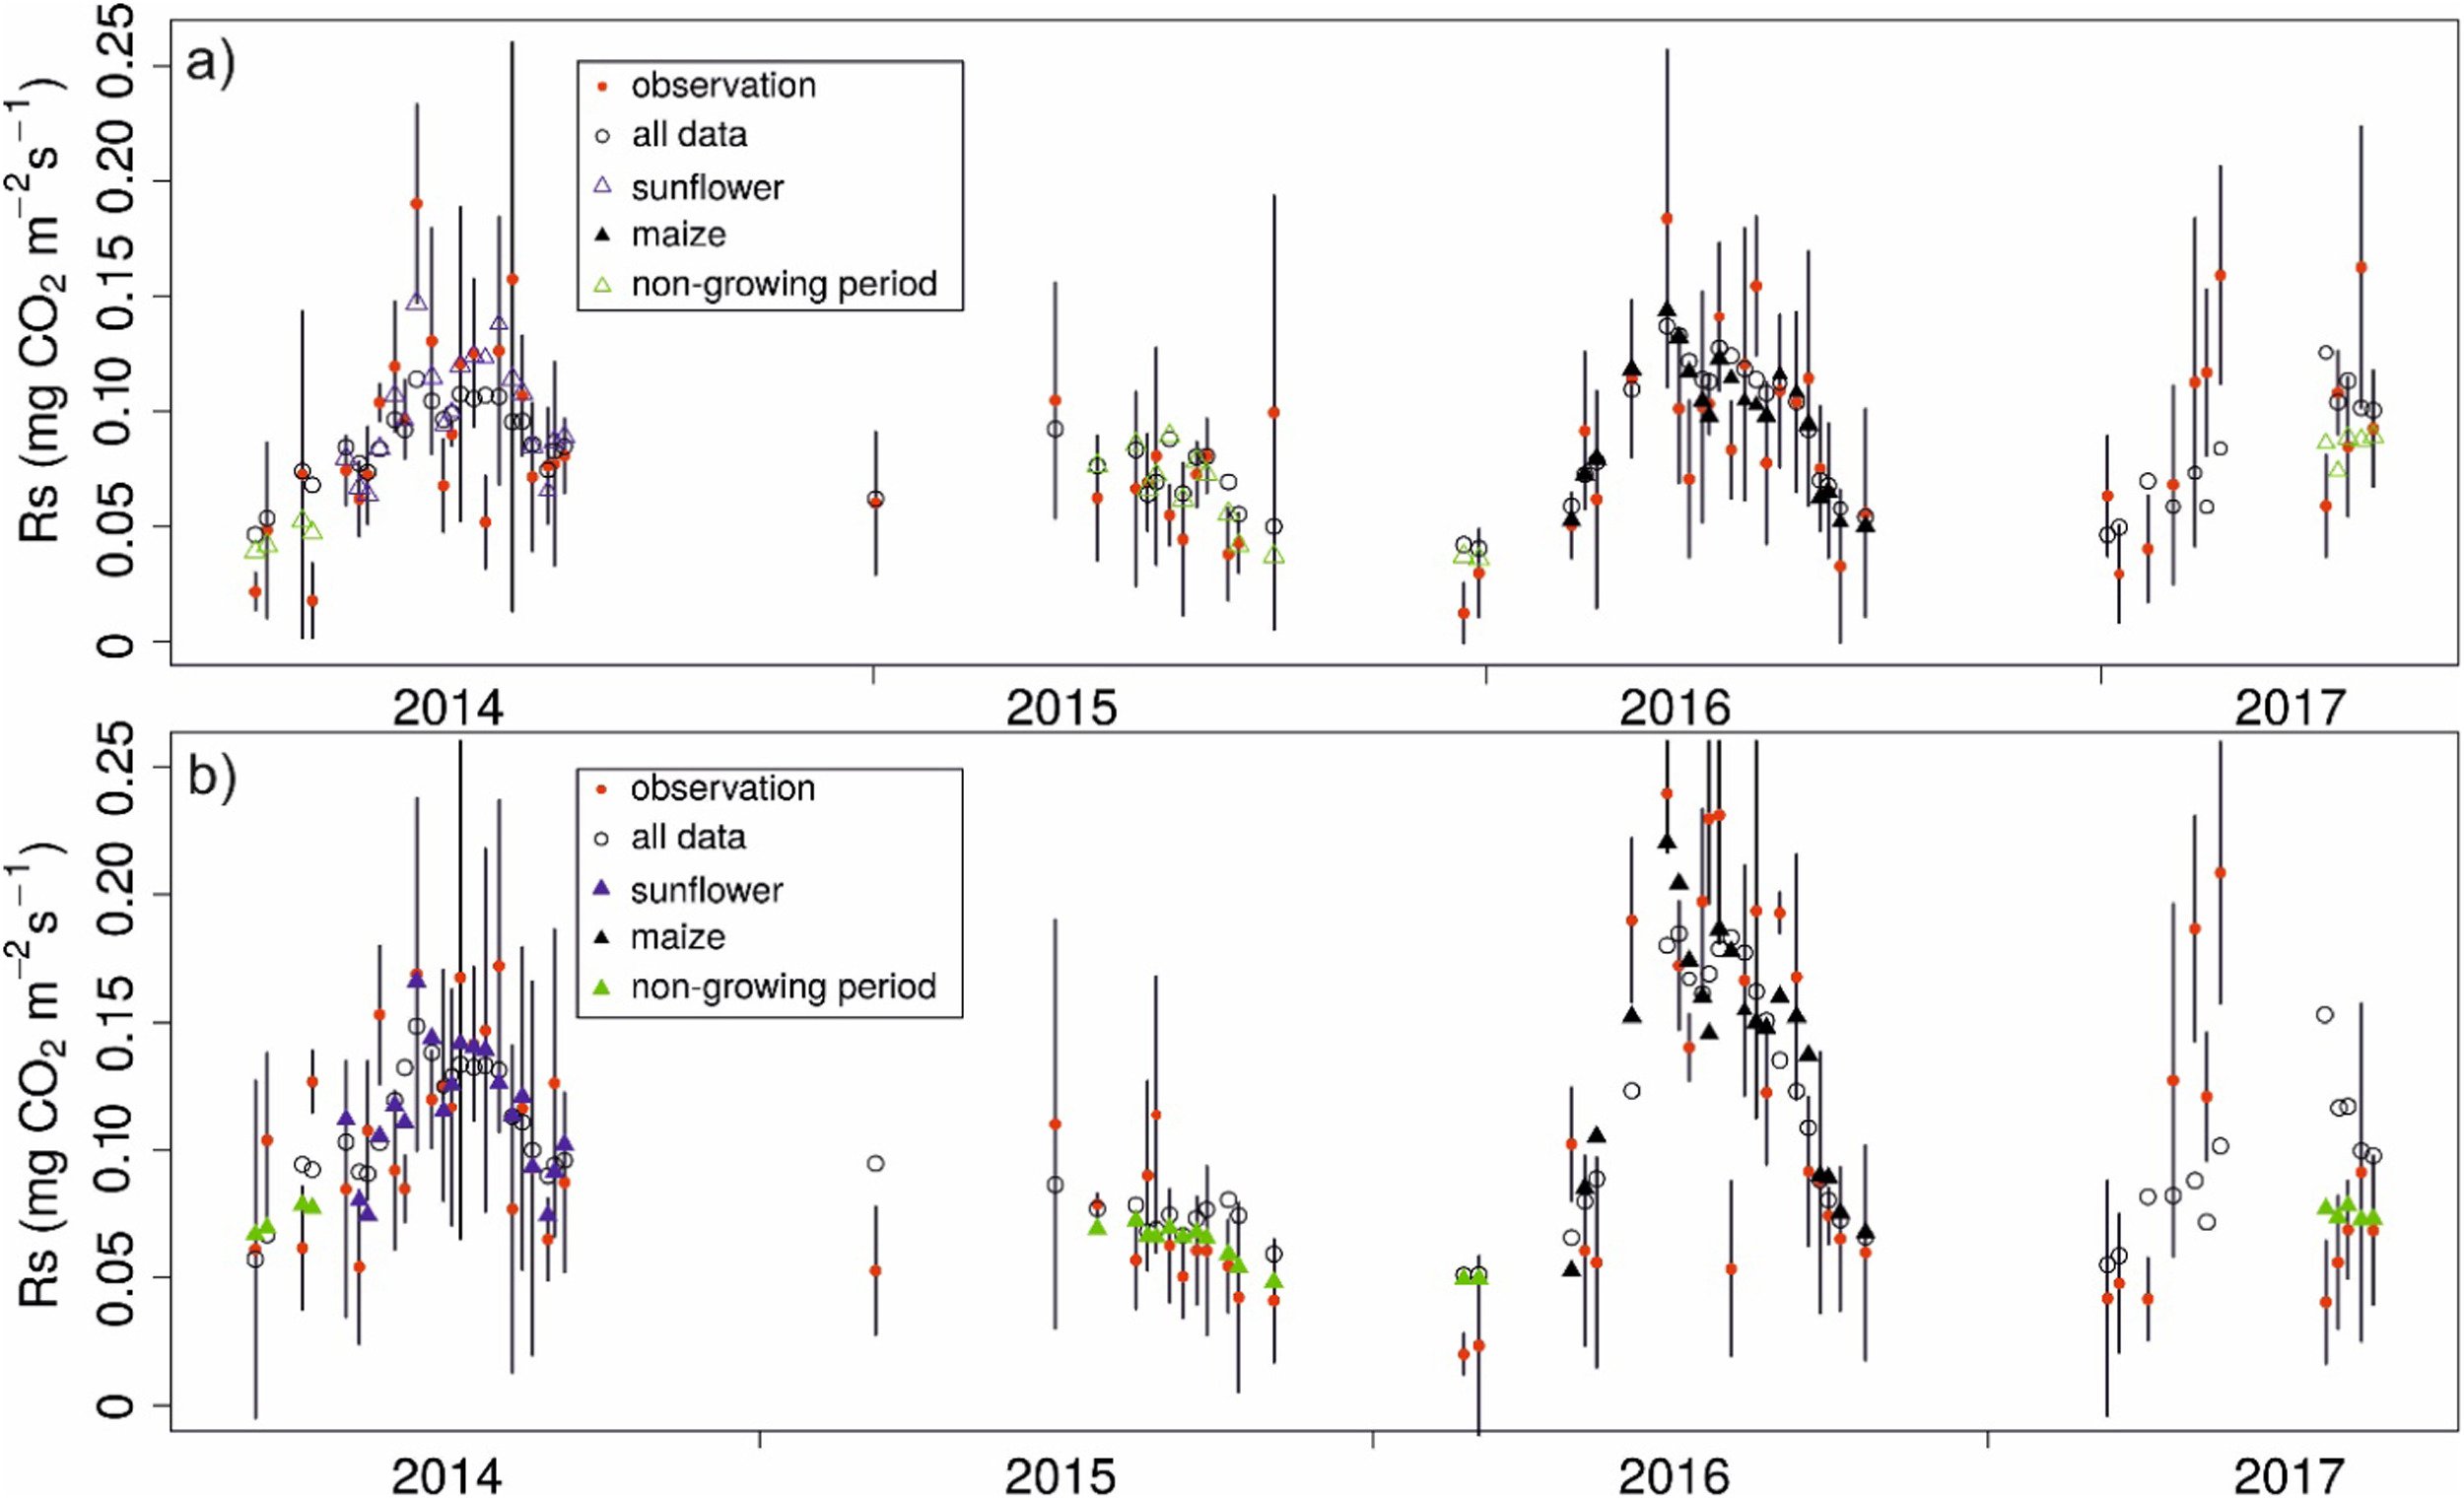
Modelled soil respiration for plowing and no-tillage created by Gelybó and others (2022).
Model results based upon the preferred model for the entire dataset, for sunflower, for maize, and for the non-growing period for (a) plowing and (b) no-tillage treatments. Observations are also plotted with uncertainty bounds (±SD of the observations per day). See text for details.
Image and caption provided by Gelybó and others (2022).
Carbon dioxide that is emitted from soils is a sizable component of the global carbon cycle. Soil respiration, the process by which this carbon dioxide is emitted or released, is driven by the decomposition of surface litter through microbial activity. Gelybó and others (2022) measured soil respiration and additional environmental variables related to soil respiration, including soil organic carbon, soil temperature, soil water content, and total inorganic nitrogen at the Józsefmajor Experimental and Training Farm near Hatvan, Hungary, from 2013–2017. Two experimental treatments, mouldboard plowing (MP) and no-tillage (NT), were used to determine tillage effects on soil respiration and the associated environmental variables. The authors used Terra Moderate Resolution Imaging Spectrometer (MODIS) Surface Reflectance 8-Day Version 6 (MOD09Q1) data products to build an NDVI time series of the adjacent fields during the study period to use as a proxy for root activity in modelling soil respiration. Six models were built with the goal of capturing temporal variability, the latter four of which used NDVI as a predictor. Over the observation period, soil respiration showed an annual peak in summer followed by a low in winter. Average soil respiration values were higher in NT treatment at 0.093 micrograms of carbon dioxide per square meter per second (mg CO2 m-2s-1) versus 0.086 mg CO2 m-2s-1 for MP, but over the course of the study this difference was only statistically significant some years. The authors believe this is a result of the higher soil water content present in the NT treatment. Crop type also impacted soil respiration, with summer crops in 2013 and 2016 showing an increased range of soil respiration between MP and NT treatments. To evaluate model performance the authors used linear correlation coefficient, root mean square error, bias, and Akaike information criteria. From the six models used the authors identified a model that broadly performed the best for both MP and NT treatments, but performance was dependent on crop, season, and treatment. The authors concluded that the addition of NDVI improved the performance of the models but suggest that crop and treatment-specific models may be helpful in improving predicted soil respiration because of inherent differences between crop types and the effects these variables had on model performance.
(Note: Gelybó and others (2022) used Terra MODIS 8-day Surface Reflectance Version 6 data. The LP DAAC recently released Terra MODIS Version 6.1 data. The corresponding data products can be found here: https://doi.org/10.5067/MODIS/MOD09Q1.061).
Material written by Erik Bolch1
1KBR, contractor to the U.S. Geological Survey, Earth Resources Observation and Science (EROS) Center, Sioux Falls, South Dakota, USA. Work performed under USGS contract G0121D0001 for LP DAAC2.
2LP DAAC Work performed under NASA contract NNG14HH33I.