Data products distributed by the Land Processes (LP) Distributed Active Archive Center (DAAC) are used in many different applications. They play an important role in modeling, helping to detect changes to the landscape, and assessing ecosystem variables, to name a few. Three of those applications, published between April and June 2017, are highlighted below. A more exhaustive, albeit not complete, list can be accessed via the LP DAAC Publications webpage.
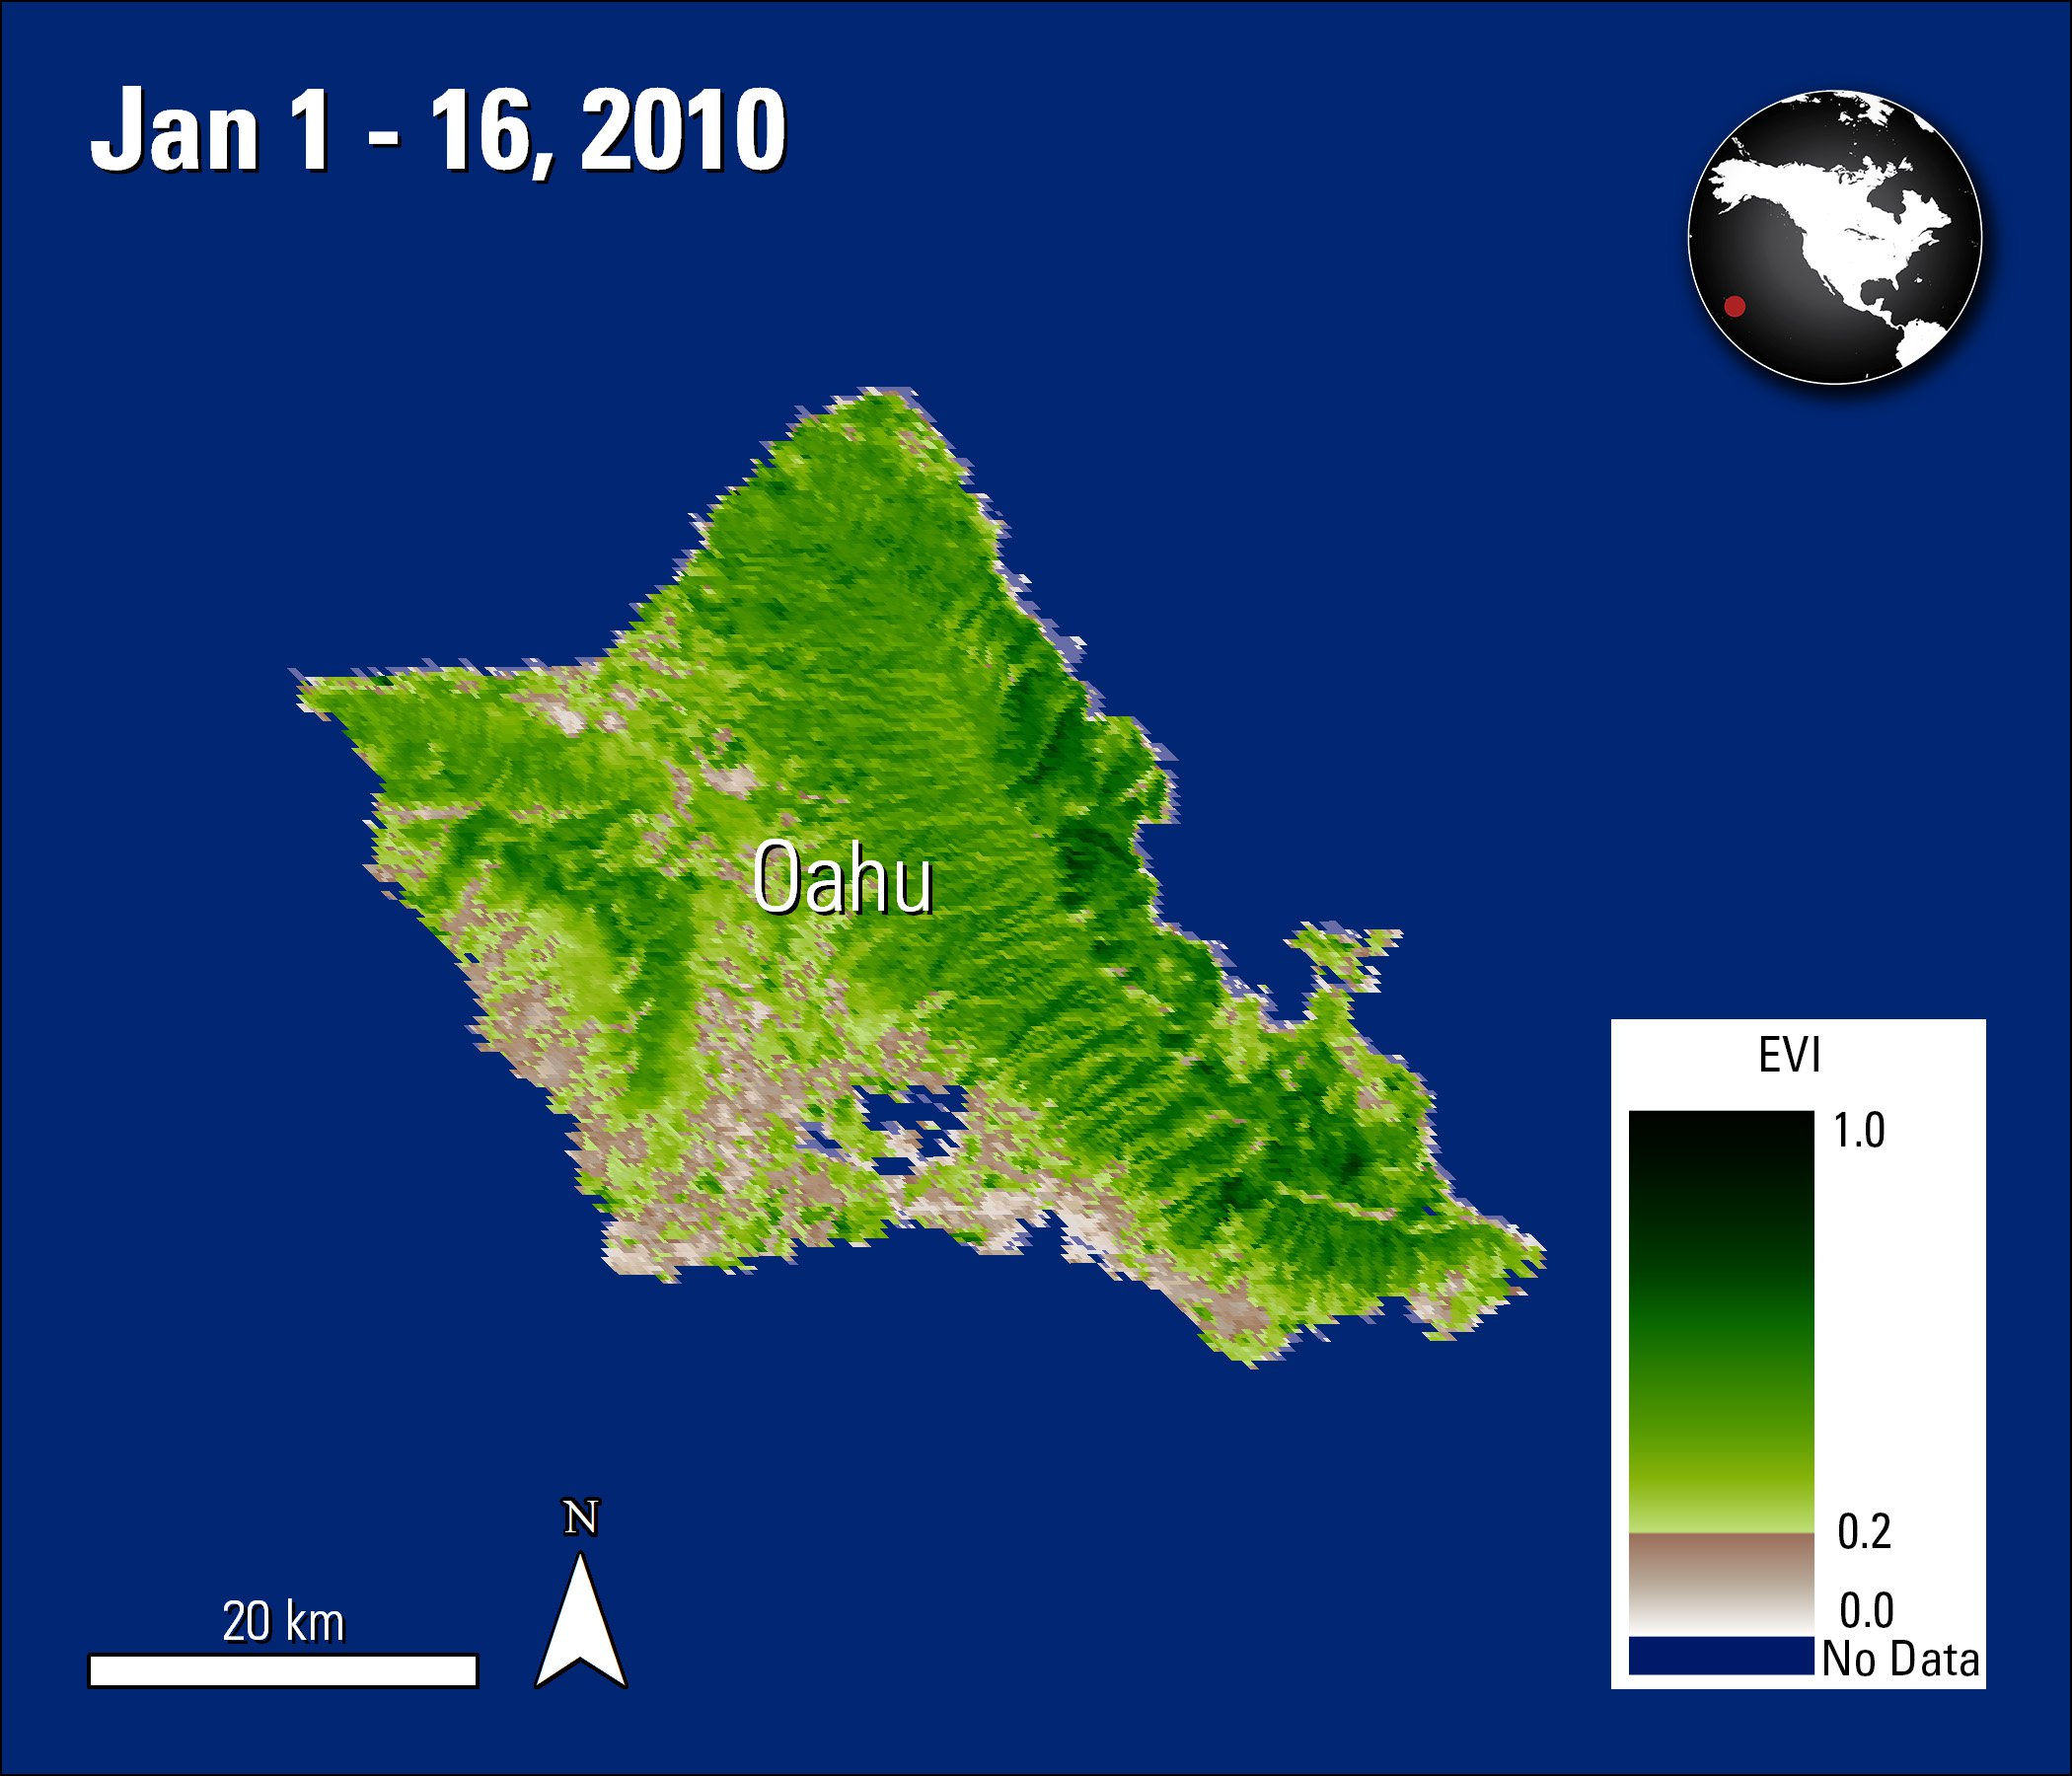
A Terra MODIS Enhanced Vegetation Index (EVI) map showing the vegetation greenness of Oahu, Hawaii for the 16 day period of January 1 to 16, 2010.
Granule ID:
MOD13Q1.A2010001.h03v06.006.2015198104312
DOI:
10.5067/MODIS/MOD13Q1.006
A Terra MODIS Enhanced Vegetation Index (EVI) map showing the vegetation greenness of Oahu, Hawaii for the 16 day period of January 1 to 16, 2010.
Granule ID:
MOD13Q1.A2010001.h03v06.006.2015198104312
DOI:
10.5067/MODIS/MOD13Q1.006
Ellsworth, L., Dale, A., Litton, C., and Miura, T., 2017, Improved fuel moisture prediction in non-native tropical Megathyrsus maximus grasslands using Moderate-Resolution Imaging Spectroradiometer (MODIS)-derived vegetation indices: International Journal of Wildland Fire, v. 26, p. 384-392. [Also available at https://doi.org/10.1071/WF16131].
In this paper, Ellsworth and others (2017) evaluate ways to predict live and dead fuel moistures, a key input to studying and predicting the risk of forest fires in the tropical grasslands of Oahu, Hawaii between October 2009 and October 2010. Currently in Hawaii, the National Fire Danger Rating System (NFDRS) and Keetch-Byram Drought Index (KDBI) are the most commonly used tools to assess the potential for fire ignition, where fires may spread, and how difficult fires will be to control. However, these tools rely on inputs that change rapidly over short temporal and spatial scales and can sometimes be unreliable. In addition, in-situ field monitoring is commonly used to quantify fuel moisture, but this method also only provides a snapshot of a specific area at a specific time and is very labor intensive. To circumvent these issues the authors create several MODIS models to find a more efficient way to study fuel moistures that could lead to potential fires. The models are based on Terra MODIS 16-Day Vegetation Indices (VI) Normalized Difference Vegetation Index (NDVI) and Enhanced Vegetation Index 2 (EVI2) data (MOD13Q1) and EVI data derived from the Terra MODIS 8-Day Surface Reflectance data (MOD09Q1). The MODIS based models are then compared to in-situ data, NFDRS calculations, and KBDI values from the Weather Information Management System (WIMS) to determine which method provides the strongest relationship with observing fuel moistures. The authors find that all of the MODIS-based indices are better predictors that offer significant improvements in estimating fuel moisture content. They also find the continuous spatial coverage of MODIS provides an additional advantage over some of the remote regions and steep topography areas, where normal measuring methods are either sparse or provide inaccurate results. It is understood also that the MODIS models could have applicability in similar tropical grasslands in other areas of the world and that additional site-specific research will need to be conducted in the future.
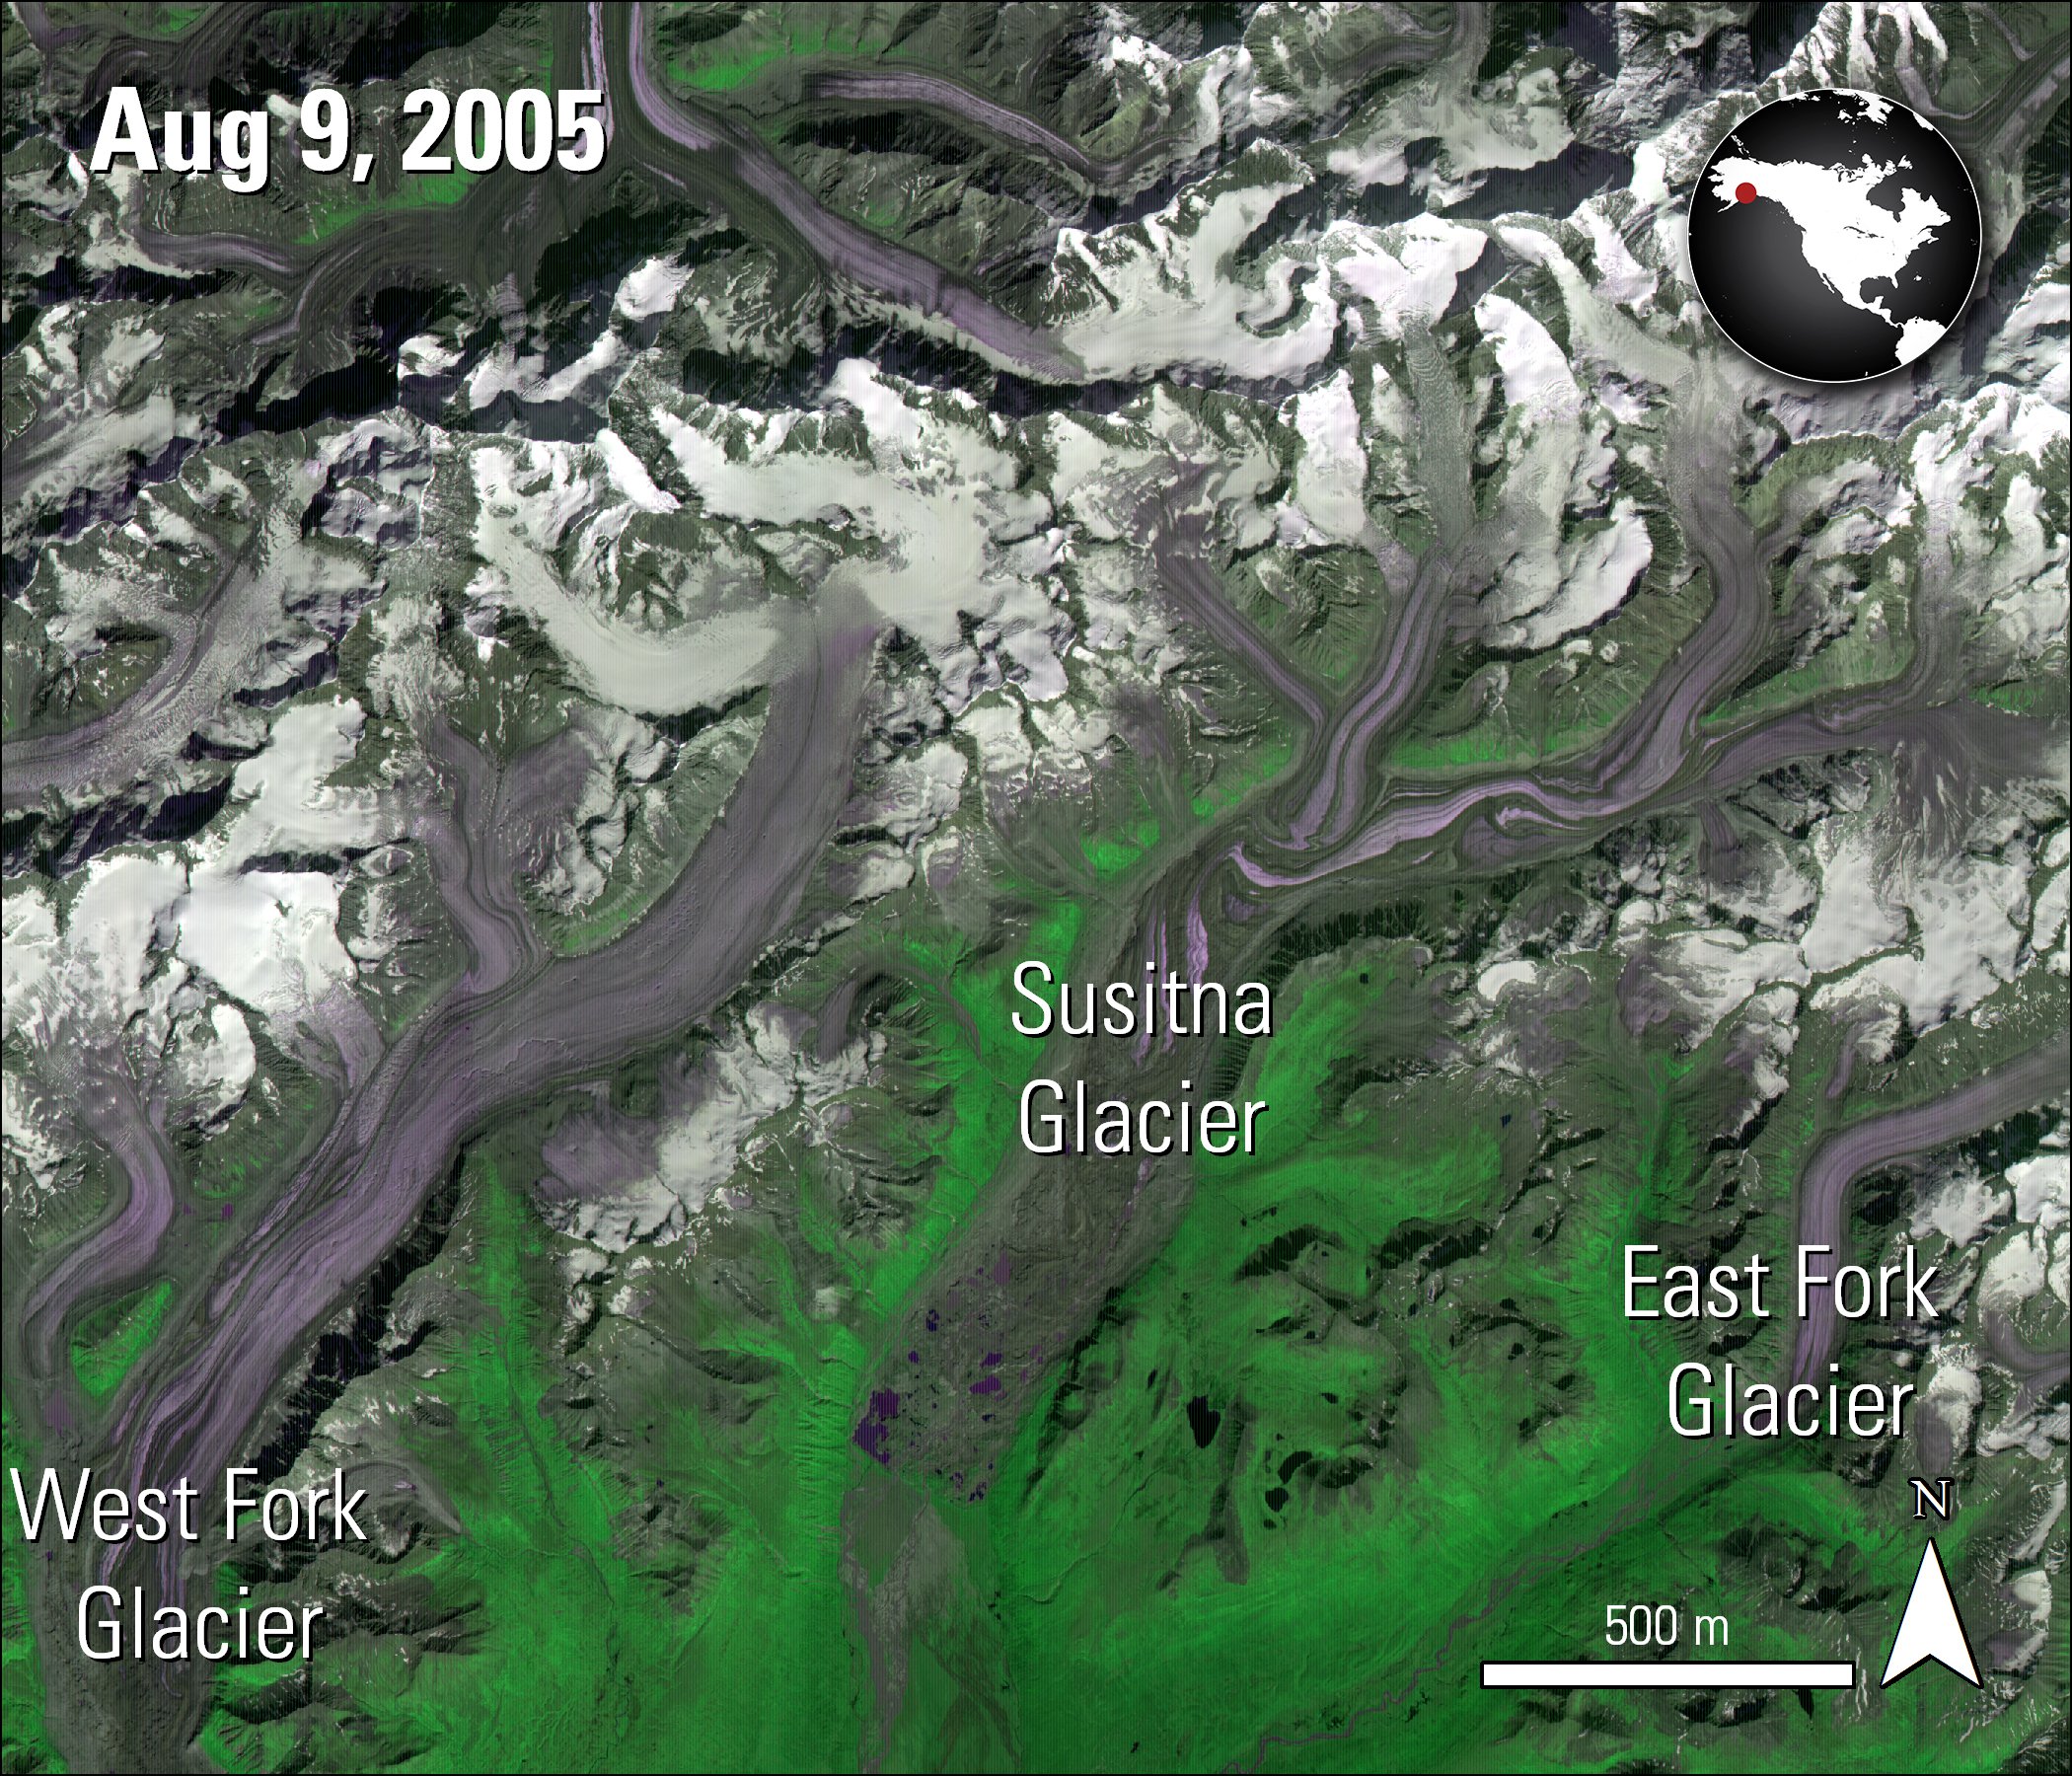
An image of one of the ASTER scenes used by the authors to compute a digital elevation model. Three of the glaciers from the study period are visible in this image.
Granule ID:
AST_L1A_00308092005211740_20170707134543_8874
DOI:
10.5067/ASTER/AST_L1A.003
An image of one of the ASTER scenes used by the authors to compute a digital elevation model. Three of the glaciers from the study period are visible in this image.
Granule ID:
AST_L1A_00308092005211740_20170707134543_8874
DOI:
10.5067/ASTER/AST_L1A.003
Wastlhuber, R., Hock, R., Kienholz, C., and Braun, M., 2017, Glacier changes in the Susitna Basin, Alaska, USA, (1951-2015) using GIS and remote sensing methods: Remote Sensing, v. 9, i. 5 p. 1–17. [Also available at http://dx.doi.org/10.3390/rs9050478].
According to Wastlhuber and others (2017), Alaskan glaciers are important contributors to sea level rise and have been for recent decades. For this study, the authors examine glacier changes in the Susitna River basin on the Central Alaska Range by combining various satellite and airborne data collected between 1951 to 2015. The data sources include Landsat 5 Thematic Mapper (TM), Landsat 7 Enhanced Thematic Mapper Plus (ETM+) and Landsat 8 Operational Land Imager (OLI); the Advanced Spaceborne Thermal Emission and Reflection Radiometer (ASTER) unprocessed instrument data (AST_L1A), which they compute into a digital elevation model (DEM); the National Elevation Dataset (NED); USGS aerial photographs and topographic maps; the Randolph Glacier Inventory; and Airborne Interferometric Synthetic Aperture Radar (IfSAR). The authors use Landsat data to digitize snowline altitudes between 1999 and 2015, and elevation data are used to study elevation and mass changes over time, specifically between 1951 (NED), 2005 (ASTER), and 2010 (IfSAR). The authors find the glaciers’ area loss between 1951 and 2010 was approximately 16 percent of the initial area (128 ± 15 km2), with the thinning rate of all the glaciers combined almost tripling between 1951 to 2005 (0.41 ± 0.07 m per year ) and 2005 to 2010 (1.20 ± 0.25 m per year). While the authors find little change in the uppermost areas of the glaciers, their results show an increase in thinning rates towards the front of the glaciers, with the highest rate being in the West Fork Glacier. The authors believe results from this study provide valuable data for mass balance modeling that should accompany additional mass balance data to further study annual and seasonal variations.
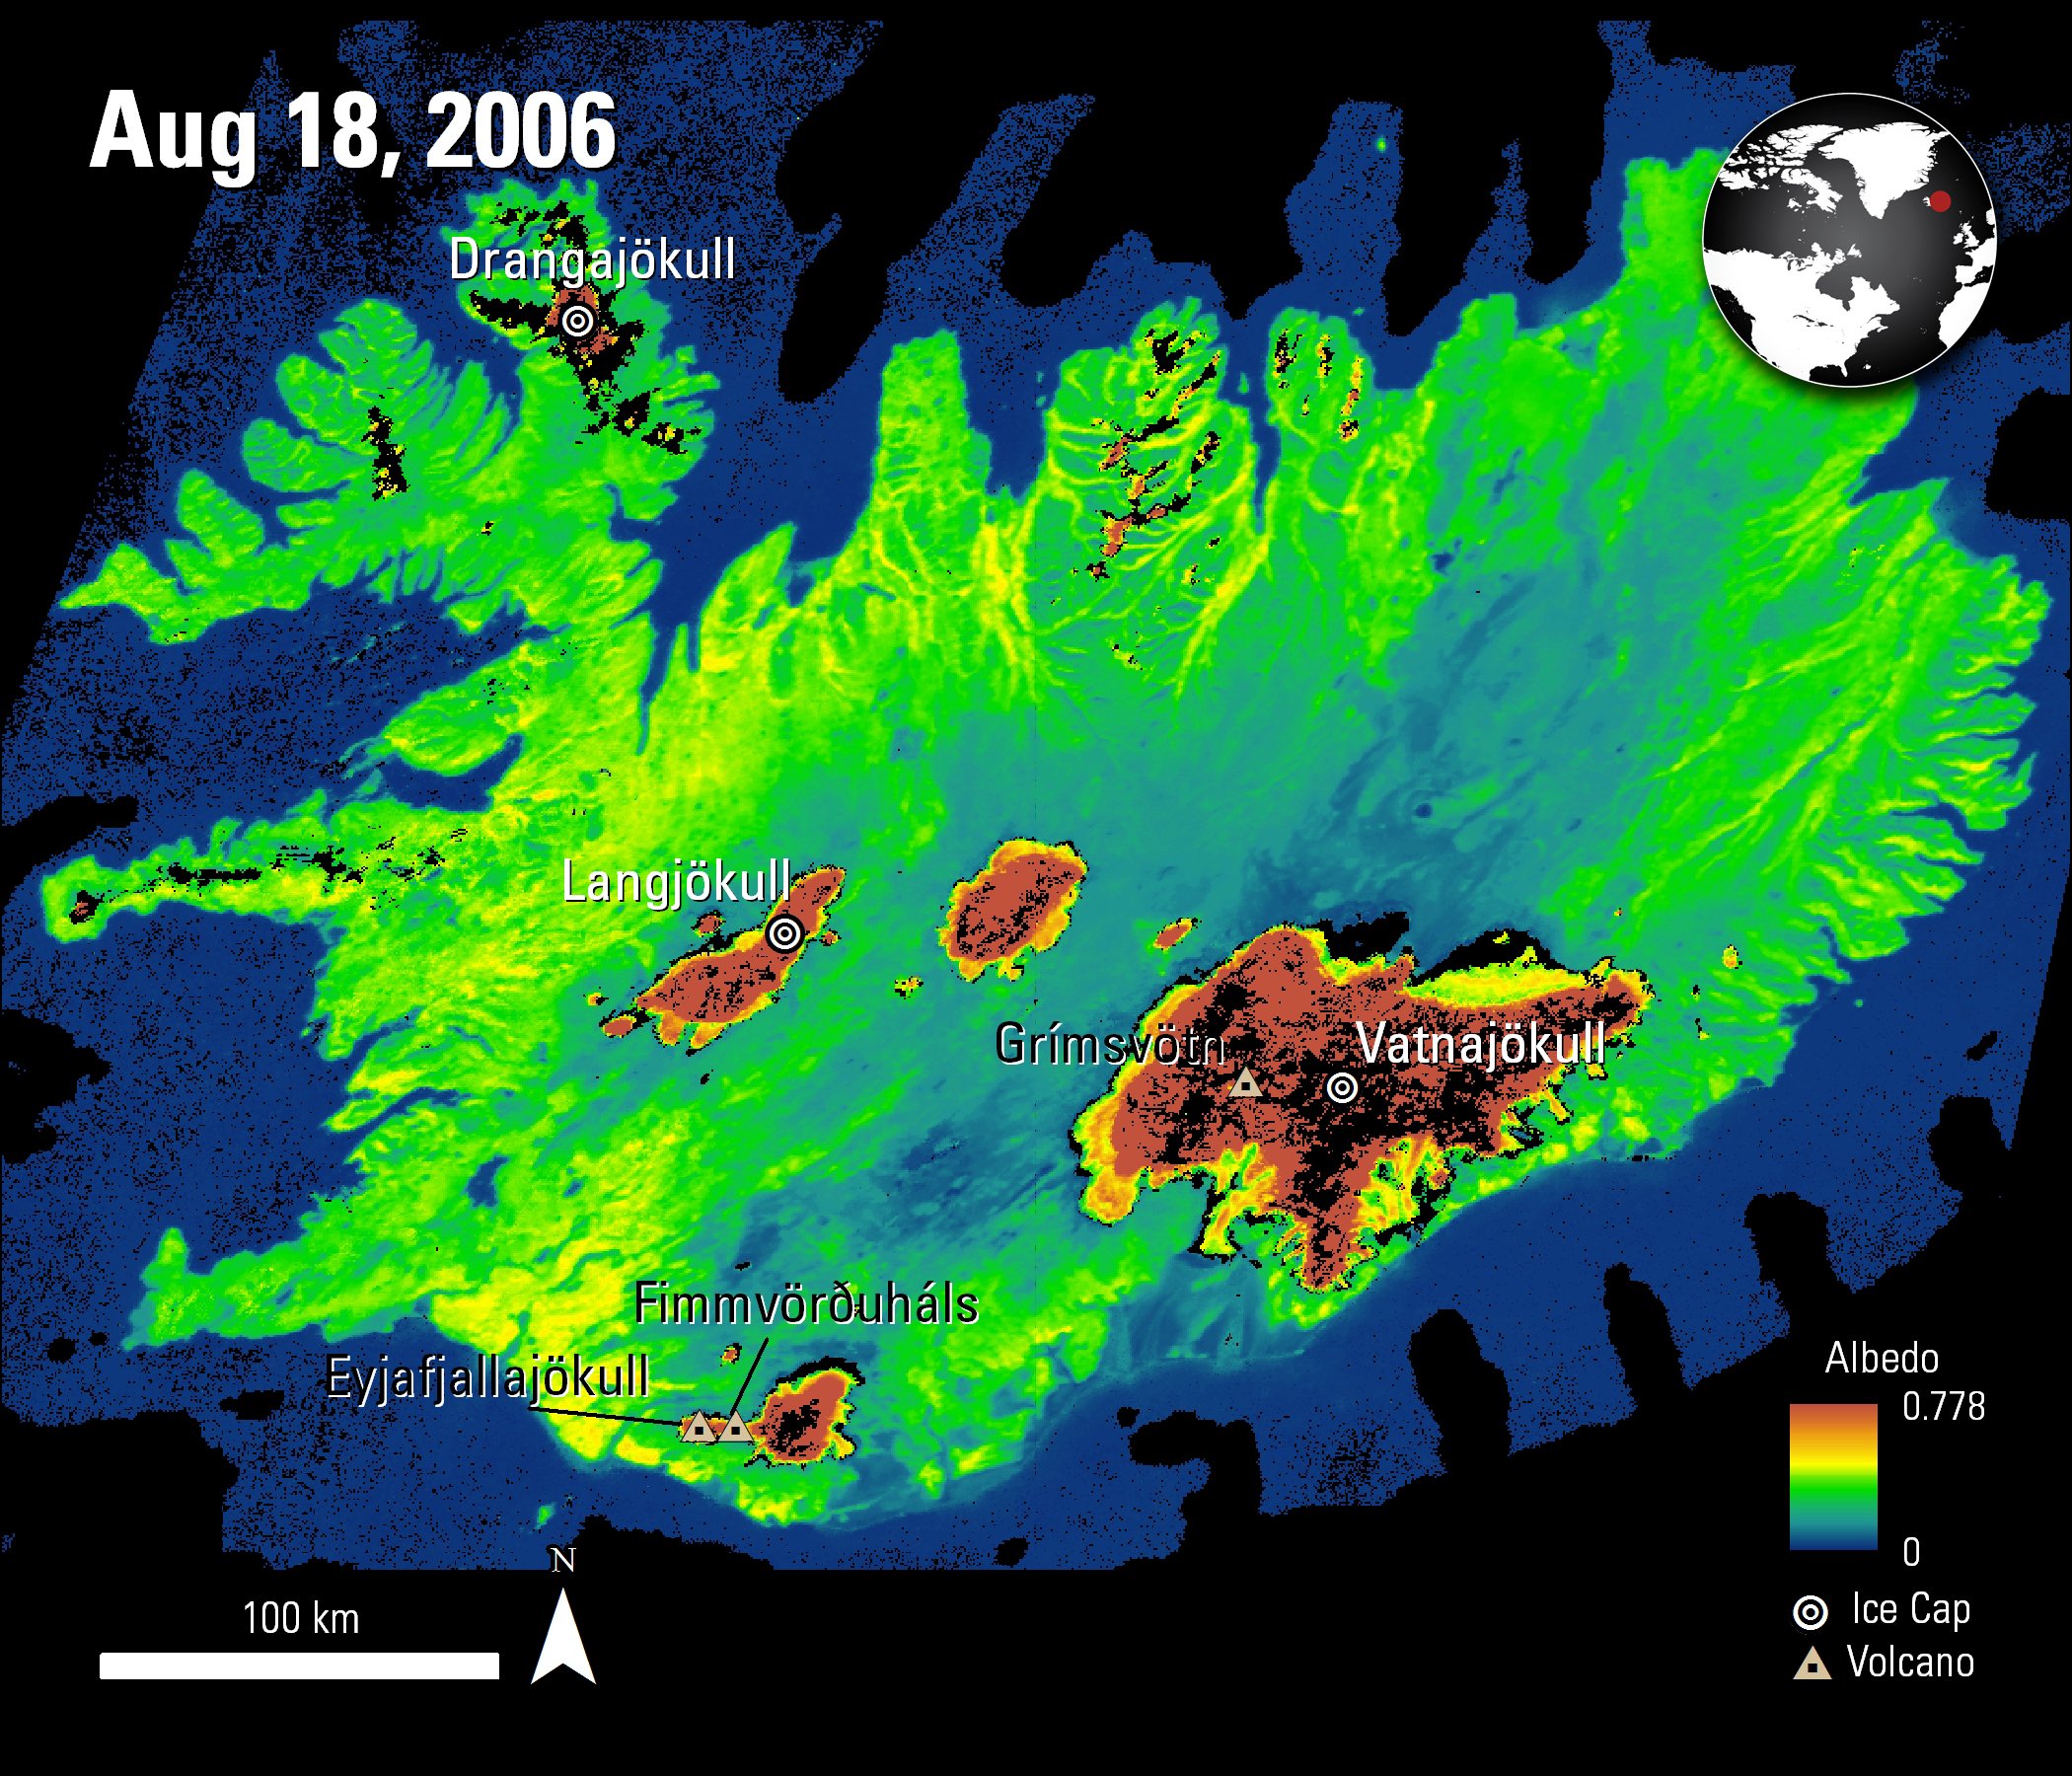
Map of Iceland using black sky albedo for shortwave broadband data for a 16-day moving window centered on August 18, 2006, about the mid-point of the study period. The ice caps (denoted with a circle symbol) have a much higher albedo than their surroundings, as indicated by the reddish hue. After the volcanic eruptions in 2010 and 2011, all ice caps, with the exception of Drangajökull to the north, experienced decreases in albedo. Note: albedo is a unitless measurement.
Granule IDs:
MCD43A3.A2006230.h16v02.006.2016107035830
MCD43A3.A2006230.h17v02.006.2016107012413
DOI:
10.5067/MODIS/MCD43A3.006
Gascoin, S., Guðmundsson, S., Aðalgeirsdóttir, G., Pálsson, F., Schmidt, L., Berthier, E., Björnsson, H., 2017, Evaluation of MODIS Albedo Product over Ice Caps in Iceland and Impact of Volcanic Eruptions on Their Albedo: Remote Sensing, v. 9, i. 5, p. 1–18. [Also available at http://dx.doi.org/10.3390/rs9050399].
In this study the authors evaluate the reliability of using remote sensing data for measuring changes in albedo of ice caps in Iceland between 2001 and 2012. Albedo, the reflection of the sun from the Earth’s surface, is a way to understand the response of glaciers to climate and in the case of Iceland – response to debris from volcanic eruptions. Iceland is unique in that it has several ice caps located within a close proximity of active volcanoes. The authors use in-situ data collected every 10 minutes from 10 weather stations located on two of its largest ice caps, Vatnajökull and Langjökull, along with black sky albedo for shortwave broadband data from the Version 6 Terra and Aqua Combined Moderate Resolution Imaging Spectroradiometer (MODIS) Daily Albedo data product (MCD43A3) at 500 meter spatial resolution. Broadband albedo values were calculated from Landsat Surface Reflectance data at 30 meter spatial resolution to identify sub-pixel variability in the MODIS data. Towards the end of the study period, two significant volcanic eruptions occur: Fimmvörðuháls (March 20 to April 12, 2010) and neighboring Eyjafjallajökull volcano (April 14 to May 22, 2010), and then Grímsvötn volcano (May 21 to May 28, 2011). The eruptions ejected mass amounts of ash into the sky, covering glaciers and disrupting air traffic. Findings from the study indicate that post-2010 and 2011 eruptions average summertime (July – August) albedo decreased for all ice caps, with the exception of Drangajökull. The albedo of the ice caps on Eyjafjallajökull are noted as having experienced the greatest decrease in albedo. In conclusion, the authors find the Version 6 Terra and Aqua Combined MODIS Albedo data product (MCD43A3) a good data source for capturing the variability of albedo of Icelandic ice caps.
Material written by Danielle Golon1 and Lindsey Harriman2
1 Innovate!, Inc., contractor to the U.S. Geological Survey, Earth Resources Observation and Science (EROS) Center, Sioux Falls, South Dakota, USA. Work performed under USGS contract G15PC00012 for LP DAAC3.
2 SGT, Inc., contractor to the U.S. Geological Survey, Earth Resources Observation and Science (EROS) Center, Sioux Falls, South Dakota, USA. Work performed under USGS contract G15PC00012 for LP DAAC3
3 LP DAAC Work performed under NASA contract NNG14HH33I.