Data products distributed by the Land Processes Distributed Active Archive Center (LP DAAC) are used in many different Earth Science applications. LP DAAC data products play an important role in modeling, detecting changes to the landscape, and assessing ecosystem variables, to name a few. Three of those applications, published between April and June 2020, are highlighted below. A more comprehensive list is available on the LP DAAC Publications webpage.
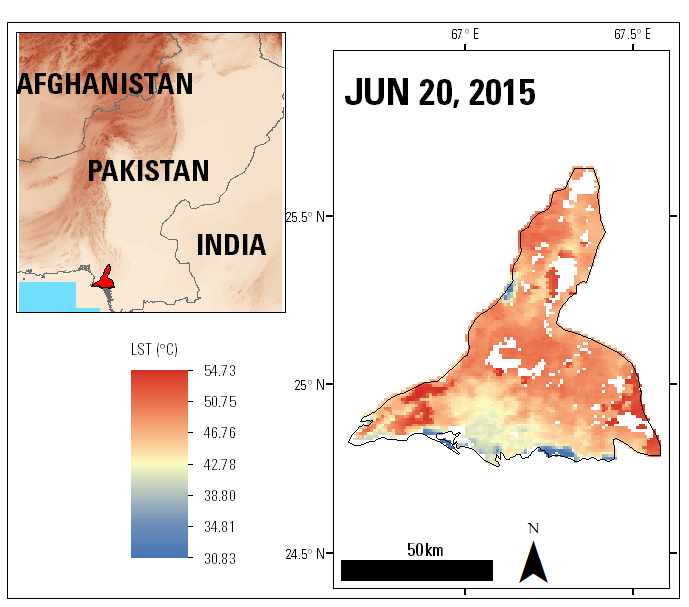
The basemap shows an overview of the area of interest in Pakistan using Aster Digital Elevation Model (ASTGTM_NC). The map on the right shows the LST on June 20, 2015, in Karachi. Atif and others (2020) mentioned the temperature on this day was relatively high in Karachi.
Granule IDs: (Author's note: MODIS Version 6 data have since been decommissioned. Users are encouraged to use the Version 6.1 equivalent product.)
MOD11A1.A2015171.h24v06.006.2016222131906
Granule IDs (Basemap):
ASTGTMV003_N<21-34>E<061-077>
Data Citation:
Wan, Z., Hook, S., and Hulley, G., 2015, MOD11A1 MODIS/Terra Land Surface Temperature/Emissivity Daily L3 Global 1km SIN Grid V006 dataset: NASA EOSDIS Land Processes DAAC, accessed July 30, 2020, at https://doi.org/10.5067/MODIS/MOD11A1.006
NASA/METI/AIST/Japan Spacesystems, and U.S./Japan ASTER Science Team, 2019, ASTER Global Digital Elevation Model V003 dataset: NASA EOSDIS Land Processes DAAC, accessed July 31, 2020, at https://doi.org/10.5067/ASTER/ASTGTM.003
Boundary source:
Global Administrative Unit Layers (GAUL) dataset, implemented by FAO within the CountrySTAT and Agricultural Market Information System (AMIS) projects. Accessed 2014-12-19 from http://www.fao.org/geonetwork/srv/en/metadata.show?id=12691
Atif, S., Hussain, E., and Khan, J., 2020, Surface urban heat islands in the mega city of Karachi, their spatial distribution and health emergency response infrastructure: The Journal of the Pakistan Medical Association, v. 70, no. 4, p.705–712. [Also available at https://doi.org/10.5455/jpma.5478.]
Heat waves resulting from climate change impact the quality of life and health of individuals and communities. In 2015 the city of Karachi, located on the south of Pakistan, experienced its worst heat wave since 1979. In June, 1,200 Karachi residents died of heat related illnesses as temperatures reached 45ºC (113 ºF). Atif and others (2020) examine if the 2015 heat wave was abnormal, to determine whether the spatial inequality in the distribution of basic facilities —such as water, power, and healthcare—contributed to the unprecedented number of heat related deaths during this period. Terra MODIS day and night Land Surface Temperature (LST) (MOD11A1) data from March 2000 to August 2016 are used to study the spatial variability of temperature and identify regions that experienced above normal temperatures in 2015. Using the MODIS LST data to map the surface urban heat islands and a spatial density map of health facilities across Karachi, the authors found that the temperature trends across the city in 2015 were not significantly higher than historical records, suggesting that the lack of utility and health services in areas contributed to the large number of deaths during the heat wave.
Campbell, T., Dixon, K., Dods, K., Fearns, P., and Handcock, R., 2020, Machine learning regression model for predicting honey harvests: Agriculture, v. 10, no. 4, art. no. 118, at https://doi.org/10.3390/agriculture10040118.
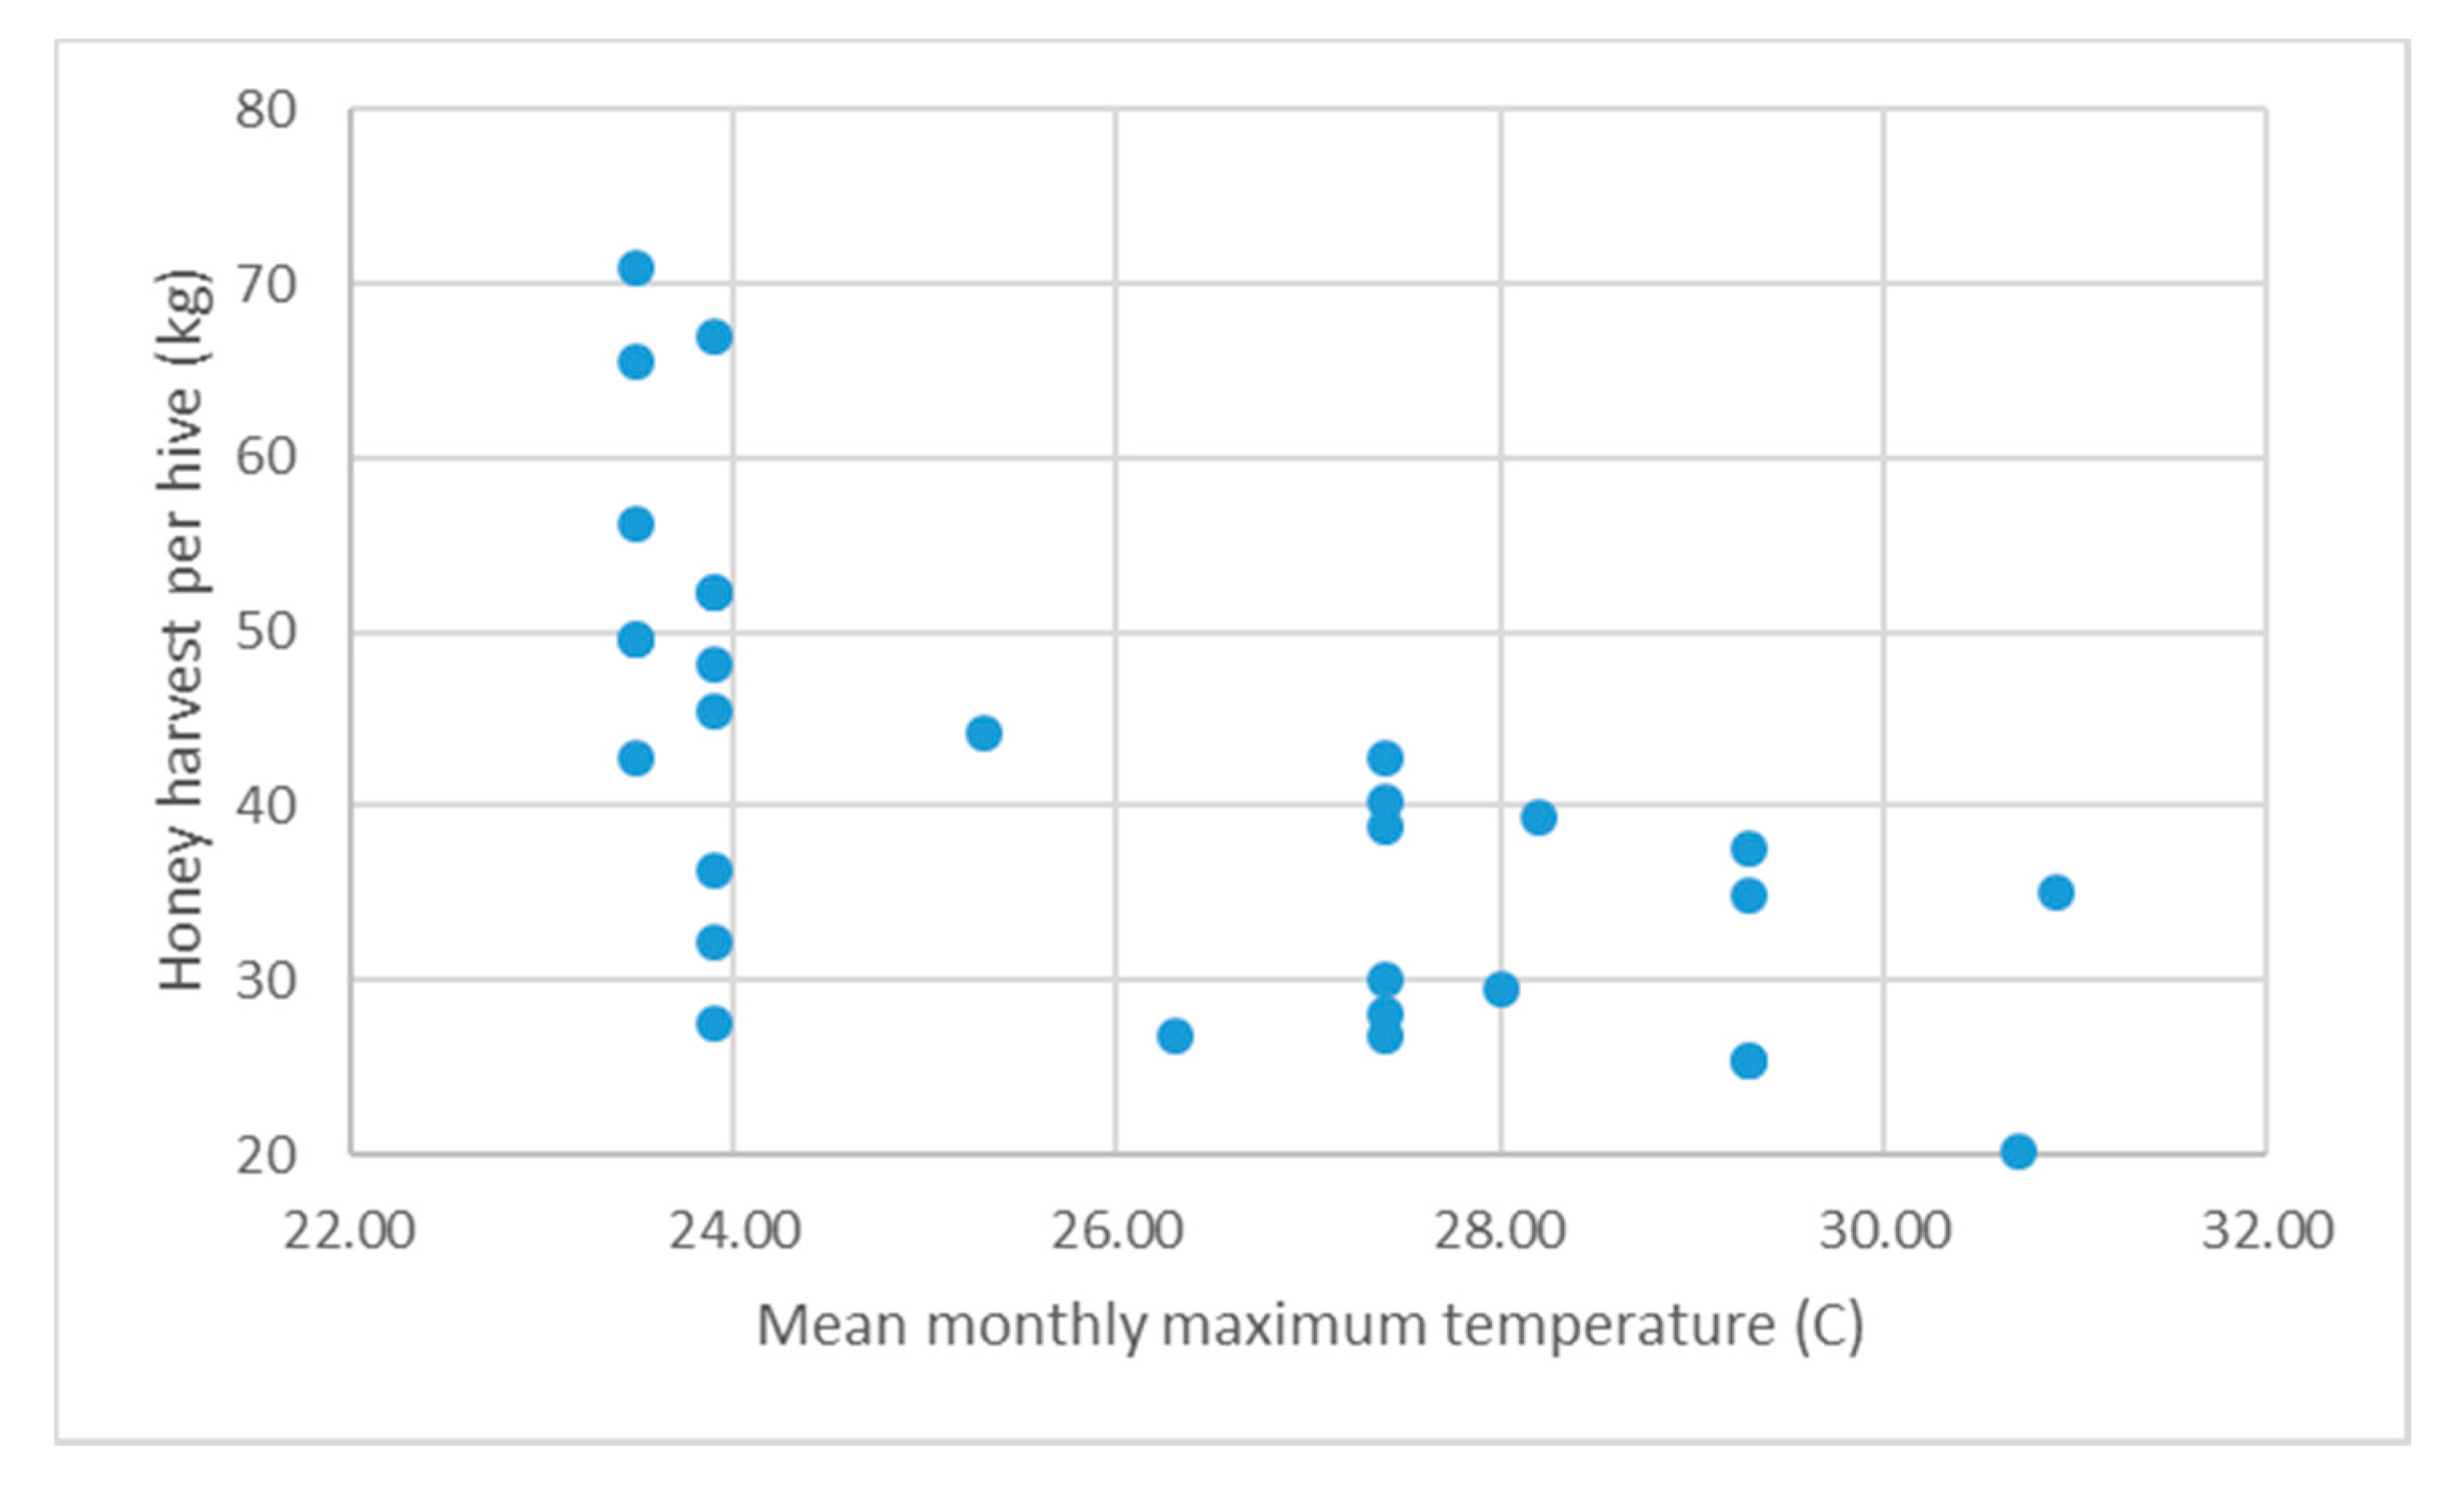
Scatterplot from Campbell and others (2020) showing the relationship between honey harvest weight and mean monthly maximum temperature for the month of November.
Scatterplot from Campbell and others (2020) showing the relationship between honey harvest weight and mean monthly maximum temperature for the month of November.
Beekeeping has been a fast-growing industry during the past decade in Western Australia. Considerable variation in the amount of honey yielded every year from apiaries makes managing the honey production and hive health difficult. Campbell and others (2020) use honey harvest data, weather data, and vegetation-related datasets from satellite sensors as input features of machine learning algorithms to develop a model to predict the potential honey production (per hive) of the main nectar source of honeybees (marri trees) in South West Australia. A multi-dimensional database with 115 items is created and used as input features of two regression and classification approaches tested in this study, including Gradient Boosted Regression (GBR) Trees and Random Forest Trees. The Application for Extracting and Exploring Analysis Ready Samples (AρρEEARS) is used to download remote sensing data in this study, including Terra MODIS Gross Primary Production (GPP) (MOD17A2H) data, Net Evapotranspiration (MOD16A2) data, and Normalized Difference Vegetation Index (NDVI) and Enhanced Vegetation Index (EVI) (MOD13Q1) data. The GBR models attained the highest predictive accuracy when all input features from the multi-dimensional dataset were used, with an average error of ±10.33 kg and 82 percent accuracy for the weight of the harvest. The model is tested with various combinations of input features. The analysis showed that when the November mean maximum temperature was the only input feature into the GBR algorithm, the honey harvest weight per hive can be predicted with a mean average error of 11.72 9 kg and 100 percent accuracy for the years with more than 40 kg honey production per hive and 75 percent accuracy for other years. This information can provide apiarists with reliable predictors of what kind of season they can expect two months prior to nectar producing by marri trees, allowing them to prepare for honey production that year. The authors suggest that access to more spatially accurate weather data may improve the regression model’s predictive accuracy. Furthermore, they believe more accurate honey harvest estimation can be obtained by adding the honey harvest data from other regions and for other forage species.
Nguyen, H., Nguyen, L., de Bie, C., Ciampitti, I., Nguyen, D., Nguyen, M., Nieto, L., Schwalbert, R. and Nguyen, L., 2020, Mapping maize cropping patterns in Dak Lak, Vietnam through MODIS EVI time series: Agronomy, v. 10, no. 4, art. no. 478, at https://doi.org/10.3390/agronomy10040478.
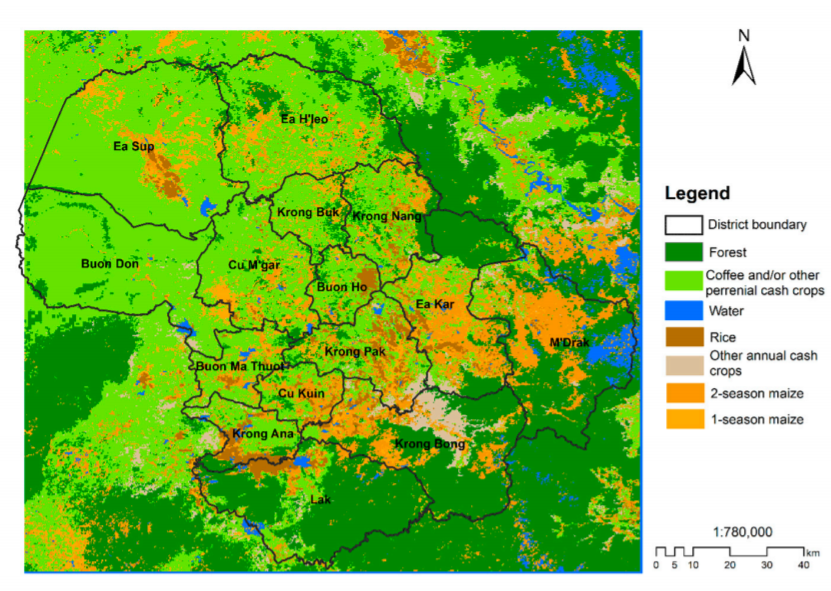
This land use map extracted from EVI time series between 2003–2018 shows the distribution of maize cropping patterns and other vegetation cover types in Dak Lak, Vietnam, as mapped by Nguyen and others (2020). 1-season and 2-season maize are differentiated in this map.
This land use map extracted from EVI time series between 2003–2018 shows the distribution of maize cropping patterns and other vegetation cover types in Dak Lak, Vietnam, as mapped by Nguyen and others (2020). 1-season and 2-season maize are differentiated in this map.
Maize is an important crop for Vietnam’s economy. Growing demand for maize for animal feed and food companies has led to an increase in maize cultivation. In 2018, more than 1,100,000 hectares (2,718,159 acres) in Vietnam were dedicated to cultivating maize. Traditionally, methods such as a census household-based survey or a cadastral ground survey have been used to estimate the total crop area in Vietnam. However, these methods are neither time nor cost effective. Because of the need for up-to-date crop information to inform forestry and agricultural management decisions in the country, Nguyen and others (2020) use remotely sensed data to make an updated maize map for the Dak Lak province, which accounts for around 10 percent of the total maize area in Vietnam. The authors use Terra MODIS Enhanced Vegetation Index (EVI) (MOD13Q1) data from 2003 to 2018 to identify maize cropping patterns in Dak Lak. The authors use a Savitzky-Golay (SG) filter on the EVI data to reconstruct the EVI time series and utilize the Support Vector Machine (SVM) approach to classify the gap-filled and smoothed EVI time series in order to identify the patterns of maize cropping. The authors found that the maize cropping pattern map produced by the SVM led to a coefficient of correlation r of 0.93 with the 2018 official statistics. The maize cropping patterns were found to have been mapped with an overall accuracy of 78 percent. The authors suggest using high spatial resolution data in fusion with the Terra MODIS EVI data to improve the accuracy of their methods in the future.
Material written by Mahsa Jami1
1KBR, Inc., contractor to the U.S. Geological Survey, Earth Resources Observation and Science (EROS) Center, Sioux Falls, South Dakota, USA. Work performed under USGS contract G15PD00467 for LP DAAC2.
2LP DAAC Work performed under NASA contract NNG14HH33I.