Data products from the Land Processes (LP) DAAC are used in many different applications. They play an important role in modeling, help to detect changes to the landscape, and are a way to assess ecosystem variables, among others. A few of these applications that were published between January and March 2015 are highlighted below. The studies highlight how data collected by the Moderate Resolution Imaging Spectroradiometer (MODIS) and Advanced Spaceborne Thermal Emission and Reflection Radiometer (ASTER) sensors can be applied to a diverse set of land remote sensing studies. Additional studies published between January and March are available here.
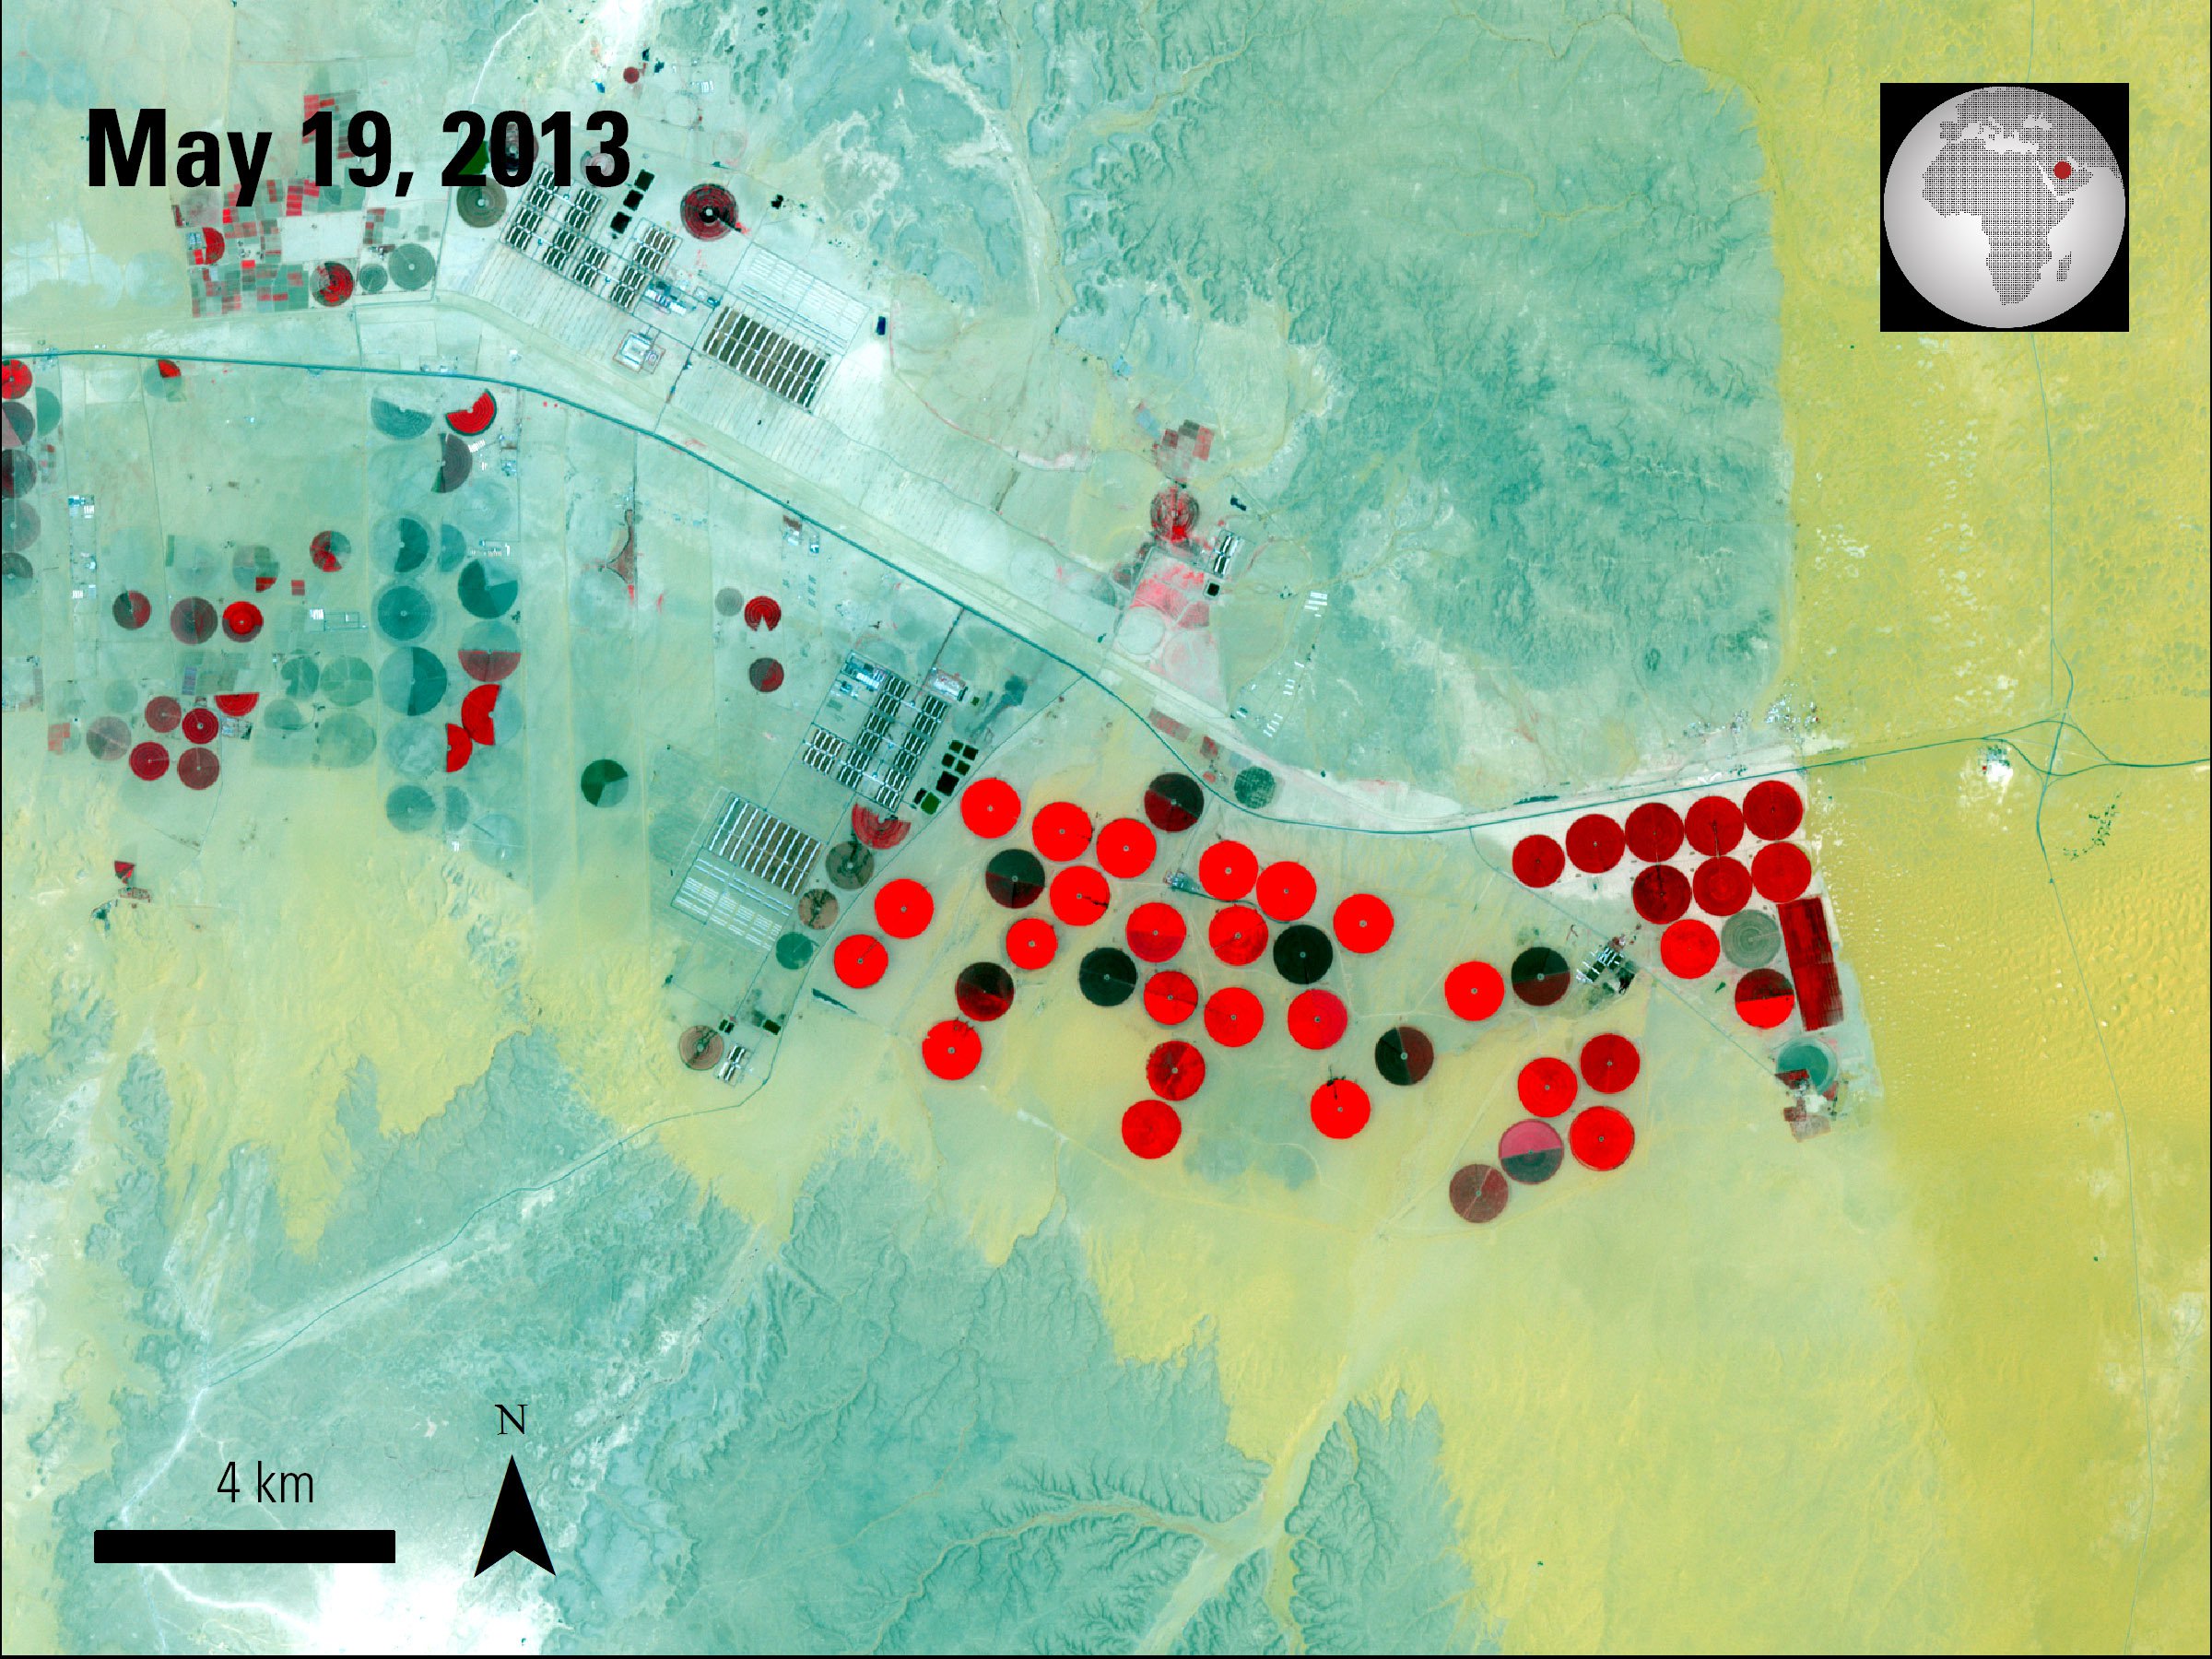
An infrared false color composite ASTER image of the Todhia Arable Farm in Saudi Arabia.
Granule ID:
AST14OTH_0030519201307285 3_20150413081437_6129
An infrared false color composite ASTER image of the Todhia Arable Farm in Saudi Arabia.
Granule ID:
AST14OTH_0030519201307285 3_20150413081437_6129
Patil, V., Al-Gaadi, K., Madugundu, R., Tola, E., Marey, S., Aldosari, A., Biradar, C., and Gowda, P., 2015, Assessing agricultural water productivity in desert farming system of Saudi Arabia: IEEE Journal of Selected Topics in Applied Earth Observations and Remote Sensing, v. 8, no. 1, p. 284-297. [Also available at http://dx.doi.org/10.1109/JSTARS.2014.2320592]
In many areas of the world, farming, industrial pursuits, and residential applications increase the demand for fresh water, while the availability of fresh water decreases. According to Patil and others (2015), this trend is observed in places like Saudi Arabia where demand for food and subsequent demand for fresh water is increasing. This study examines water productivity, the ratio between water use and crop growth. It focuses on wheat, corn, Rhodes grass, and alfalfa grown with center-pivot irrigation at the Todhia Arable Farm in the desert area of Al-Kharj, Saudi Arabia using remote sensing data from 2012 to 2013.
Data used in the study include: 14 ASTER Registered Radiance at the Sensor (AST_L1B) images, independent ground-level Normalized Difference Vegetation Index (NDVI) and Leaf Area Index (LAI) data, and meteorological data collected from the farm’s weather station. The authors use an ASTER Thermal Infrared (TIR) band (13) to computer the surface temperature of the farm. They also use ASTER data for measuring daily water use and evapotranspiration rates. These measurements are then applied to the Surface Energy Balance Algorithm for Land (SEBAL) model.
After conducting the study, the authors were able to determine that wheat was the best crop to grow when considering water productivity. The study also found that corn also has high water productivity. As a result of these findings, the Todhia Arable Farm increased corn production and decreased Rhodes grass production. The authors conclude that SEBAL and ASTER images can provide realistic estimates of water productivity for crops grown with center-pivot irrigation in Saudi Arabia.
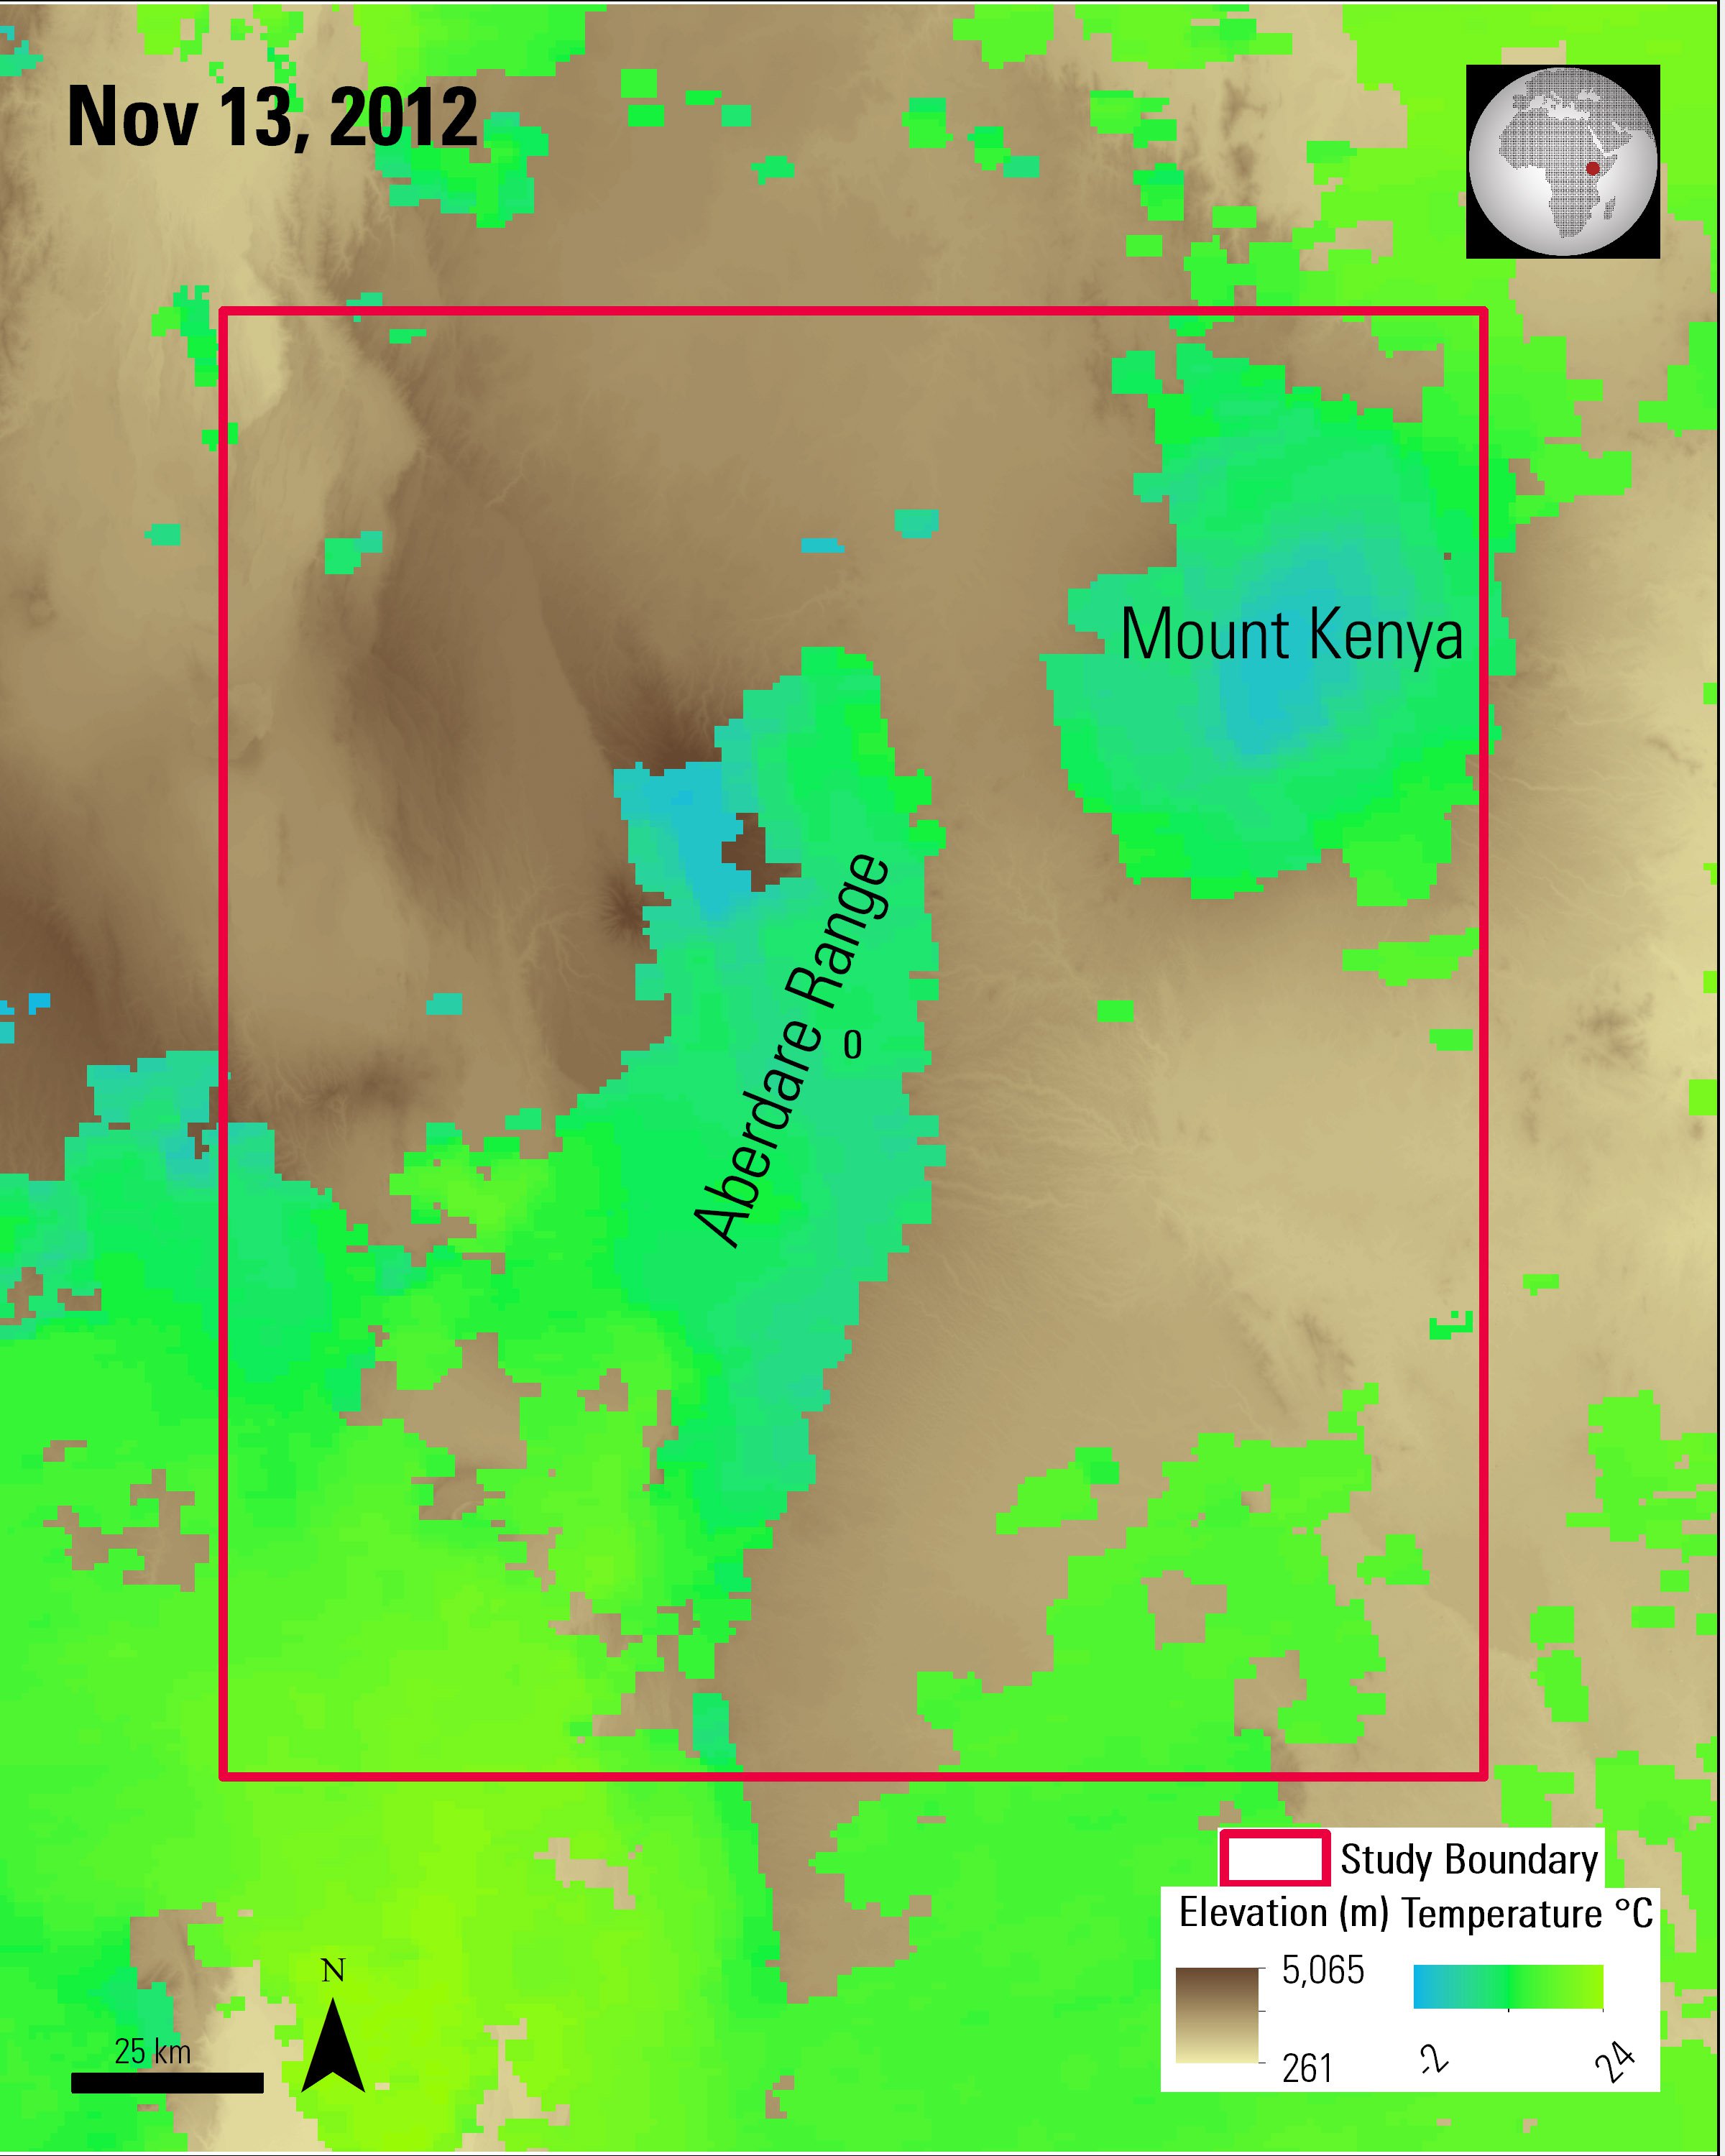
MODIS Nighttime LST data from November 13, 2012 overlaid on ASTER GDEM of the Aberdare region in Kenya. Frost occurs when temperatures are 0°C or below. The blue shading in the image indicate areas that could have a risk for frost during colder evenings. The gaps in the LST data are a result of clouds.
Granule IDs:
MOD11A1.A2012318.h21v08.005.20123210604541
MOD11A1.A2012318.h21v09.005.2012321060525
ASTER GDEM is a product of Japan’s Ministry of Economy, Trade, and Industry (METI) and NASA.
Kotikot, S., and Onywere, S., 2015, Application of GIS and remote sensing techniques in frost risk mapping for mitigating agricultural losses in the Aberdare ecosystem, Kenya: Geocarto International, v. 30, no. 1, p. 104-121. [Also available at http://dx.doi.org/10.1080/10106049.2014.965758 ]
Accounting for frost damage is one element of agricultural planning. A crop’s location may increase the risk of frost. At certain temperatures, an entire crop could be lost to frost damage. This results of study could help farmers in the Aberdare ecosystem of Kenya understand specific conditions that increase the risk of frost. The results could also help farmers predict future frost events by planning their crop planting locations accordingly, to mitigate frost damages.
The authors use several remote sensing data types to identify factors explaining frost location trends from 2000 to 2013: MODIS nighttime land surface temperature (LST), ASTER Digital Elevation Model (DEM), and land cover types derived from Landsat imagery. The authors delineate a frost map from the nighttime LST data to correlate with ASTER’s 30 meter DEM to understand the relationship between frost, LST, elevation, and land surface curvature. They found that frost risk hotspots are concentrated in areas with elevations of ~1,700 meters (~5,577 feet) above sea level, and frost primarily occurs in low-lying valleys and western slopes. In the Aberdare Forest and National Park, the authors conclude that 48.35% of the area is at risk for frost occurrences during colder nighttime temperatures in the months of April, May, and November.
Eckert, S., Hüsler, F., Liniger, H., and Hodel, E., 2015, Trend analysis of MODIS NDVI time series for detecting land degradation and regeneration in Mongolia: Journal of Arid Environments, v. 113, p. 16-28. [Also available at http://dx.doi.org/10.1016/j.jaridenv.2014.09.001]
In a country as vast as Mongolia, MODIS data can be an essential tool for monitoring the various types of land cover due to the relatively large imaging area and frequent revisit time. In this study, the authors use MODIS data to better understand why certain land change trends occur in Mongolia and can predict areas where future land cover change may occur.
Eckert and others (2015) use annual, 500 meter MODIS land cover data (MCD12Q1) and 16-day, 250 meter MODIS Normalized Difference Vegetation Index (NDVI) data (MOD13Q1) from MODIS to detect land degradation and land regeneration in Mongolia between 2001 and 2009. The authors assess how land classification changes between 2001 and 2009 for each pixel within the study area. Depending on the changes observed, the authors classify the change as either a positive or negative land change, based on the NDVI value. For example, the authors define an area that changed from grassland to forest as a positive change and an area that changed from forest to barren as a negative change.
The authors found little-to-no land change in the majority of northern Mongolia; positive land changes in the northeastern part of the country and parts of north central; and negative land changes in the far west, in some of the previously forested areas of the north and the east, and near the capital of Ulaanbaatar. The authors note some of the land changes typically occur along transition zones between land cover types, which could be due to the transition areas being more sensitive to changes in temperature, precipitation, or natural and human impacts on the area.
Note: In this study, the authors use the MODIS Land Cover Version 5.1 data product. The Version 6 product has since been released.
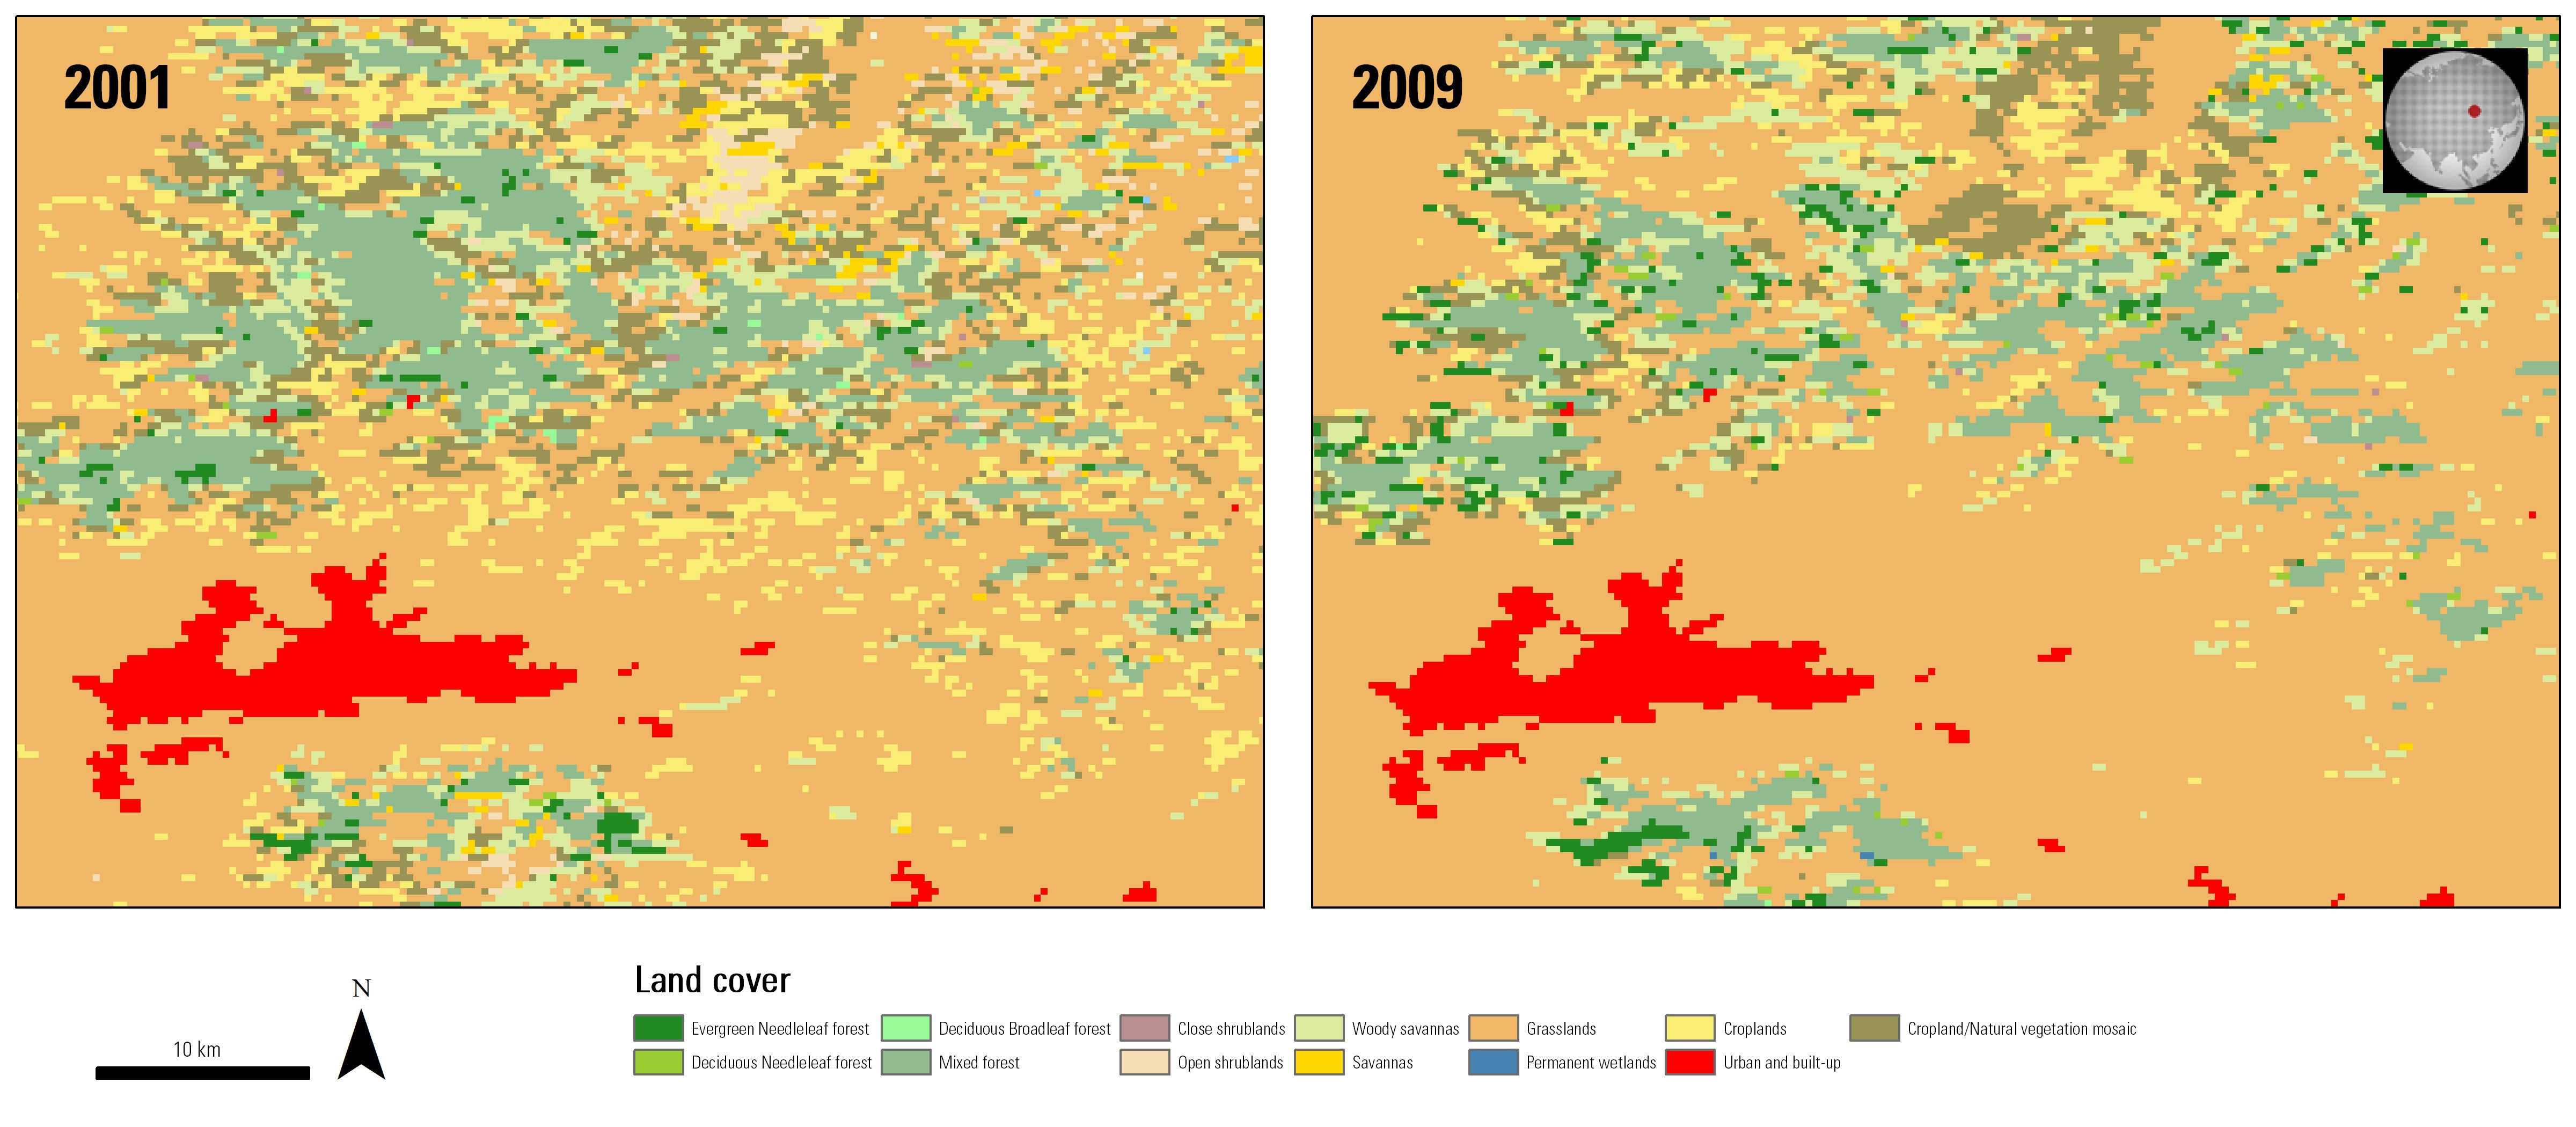
A comparison of land cover in Mongolia near the capital of Ulaanbaatar in 2001 and in 2009. The area north and northeast of Ulaanbaatar, identified as red on the image, has seen a loss of mixed forest. Several areas classified as mixed forest are now classified as grasslands.
Left Granule ID:
MCD12Q1.A2009001.h25v04.051.2014288181622
Right Granule ID:
MCD12Q1.A2001001.h25v04.051.201487164506
Material written by: Danielle Golon1
1 Innovate!, Inc., contractor to the U.S. Geological Survey, Earth Resources Observation and Science (EROS) Center, Sioux Falls, South Dakota, USA. Work performed under USGS contract G10PC00044 for LP DAAC2.
2 LP DAAC Work performed under NASA contract NNG14HH33I.