Data products from the Land Processes (LP) Distributed Active Archive Center (DAAC) are used in numerous applications. They play an important role in modeling, in detecting changes to the landscape, in assessing ecosystem variables, and in many other research endeavors. A few articles describing application of LP DAAC data products, published between January and March 2016, are highlighted below. A more exhaustive, albeit not complete, list can be accessed via the LP DAAC Publications Web Page.
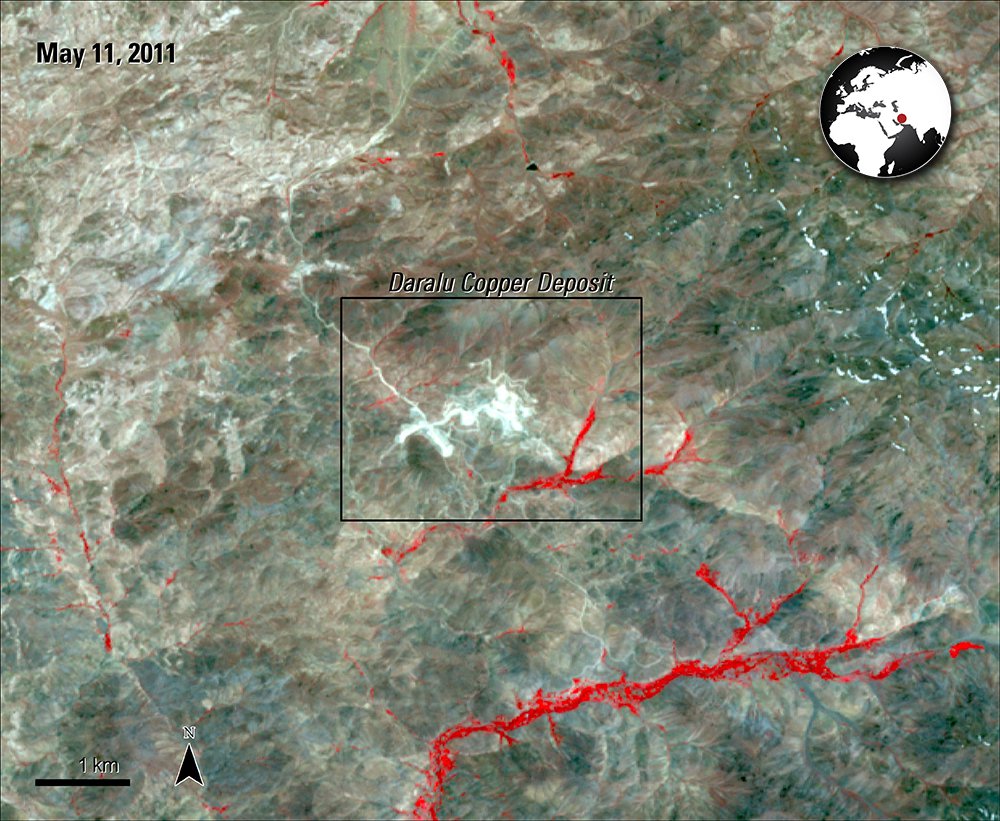
Terra ASTER Level 1 Precision Terrain Corrected Registered At-Sensor Radiance (AST_L1T) visible and near-infrared (VNIR) image of the study area (bounded in black) from May 11, 2011.
Granule ID:
AST_L1T_00305112011065621_20150605215934_122685
Terra ASTER Level 1 Precision Terrain Corrected Registered At-Sensor Radiance (AST_L1T) visible and near-infrared (VNIR) image of the study area (bounded in black) from May 11, 2011.
Granule ID:
AST_L1T_00305112011065621_20150605215934_122685
Sojdehee, M., Rasa, I., Nezafati, N., and Abedini, M. V., 2016, Application of spectral analysis to discriminate hydrothermal alteration zones at Daralu copper deposit, SE Iran: Arabian Journal of Geosciences, v. 9:41. [Also available at http://dx.doi.org/10.1007/s 12517-015-2068-0].
In recent years, mineral prospecting has incorporated the use of remote sensing data as a preliminary step when assessing a location. This paper describes several techniques applied to remote sensing imagery to highlight mineral content of soils and identify faults at the Daralu copper deposit in southeastern Iran. Data used in this study include Advanced Spaceborne Thermal Emission and Reflection Radiometer (ASTER) and Landsat Enhanced Thematic Mapper Plus (ETM+) images. Sojdehee and others (2016) use specific ASTER band ratios and band combinations to classify minerals and identify faults based on spectral enhancements. Classification using ASTER images yielded better results than similar analyses of other remote sensing data; in-field and lab measurements support the paper's findings, as do the results of a cited paper from 1970. The authors conclude that the discussed methods of analyzing remote sensing imagery are useful to identify regions of hydrothermal alterations (introductions of minerals into faults within rock formations via extremely hot water) related to copper mineralization.
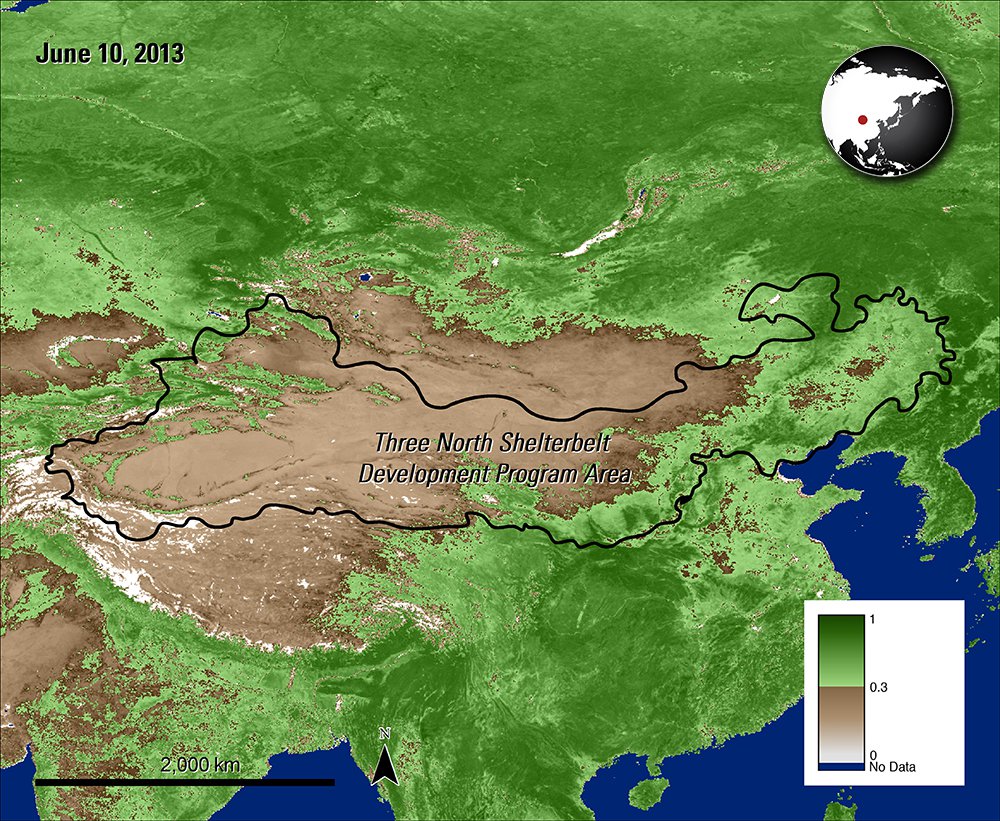
A Terra MODIS NDVI image of the Three North region (bounded in black) in northern China from June 10, 2013.
Granule ID:
MOD13C1.A2013273.005.2013304174148
A Terra MODIS NDVI image of the Three North region (bounded in black) in northern China from June 10, 2013.
Granule ID:
MOD13C1.A2013273.005.2013304174148
Zhang, Y., Peng, C., Li, W., Tian, L., Zhu, Q., Chen, H., Fang, X., Zhang, G., Liu, G., Mu, X., Li, Z., Li, S., Yang, Y., Wang, J., and Xiao, X., 2016, Multiple afforestation programs accelerate the greenness in the ‘Three North’ region of China from 1982 to 2013: Ecological Indicators, vo. 61, part 2, pp. 404-412. [Also available at http://dx.doi.org/10.1016/j.ecolind.2015.09.041].
The archive of Moderate Resolution Imaging Spectroradiometer (MODIS) data allows scientists to study long-term trends. Zhang and others (2016) use Normalized Difference Vegetation Index (NDVI) measurements to assess the effectiveness of the “Three North” Shelterbelt Development Program (TNSDP), an ecological restoration program in northern China. The TNSDP, which began in 1978, focuses on planting protective forests in arid and semi-arid areas of the northern portion of China. It is the largest afforestation program in the world, covering 42.2% of China’s total land area. The TNSDP and other afforestation programs were instituted to combat desertification, sandstorms, soil erosion, and land degradation in the dry northern regions of China. The authors apply several growth trend analyses to the calculated mean NDVI for the growing seasons (May to September) of each year from 1978 to 2013. They also use Global Inventory Modeling and Mapping Studies (GIMMS, 1982 – 2006), GIMMS third generation (GIMMS 3g, 1982 – 2012), and MODIS (MOD13C1, 2000 – 2013) data to calculate mean NDVI. Results of the study show an increase of NDVI over the 30-year study period, which is attributed to multiple afforestation programs and continued growth of planted trees.
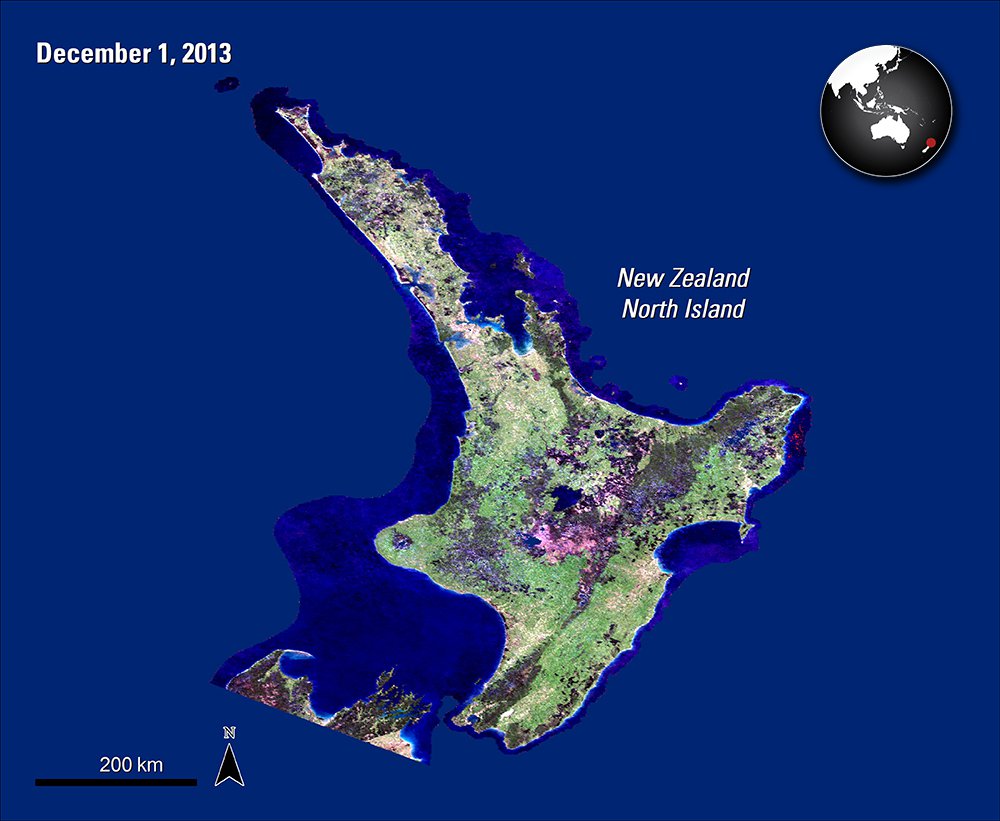
A composite Terra MODIS BRDF image of the North Island in New Zealand from December 1, 2013.
Granule IDs:
MCD43A4.A2013321.h31v12.005.2013339002443
MCD43A4.A2013321.h31v13.005.2013338225251
MCD43A4.A2013321.h32v12.005.2013339002748
A composite Terra MODIS BRDF image of the North Island in New Zealand from December 1, 2013.
Granule IDs:
MCD43A4.A2013321.h31v12.005.2013339002443
MCD43A4.A2013321.h31v13.005.2013338225251
MCD43A4.A2013321.h32v12.005.2013339002748
De Beurs, K., Owsley, B., Julian, J., 2016, Disturbance analyses of forests and grasslands with MODIS and Landsat in New Zealand. International Journal of Applied Earth Observation and Geoinformation, 45, Part A, 42-54. [Also available at http://dx.doi.org/10.1016/j.jag.2015.10.009].
MODIS data are often used to study forest disturbance. De Beurs and others (2016) examine a method of analyzing forest disturbance and extended the method to the forests and grasslands of the North Island of New Zealand. Data products used for this study include 8-day MODIS Nadir Bidirectional Reflectance Distribution Function (BRDF)-adjusted reflectance (NBAR) 500m resolution (MCD43A4) from 2000 – 2013 and Landsat data from 1999 – 2012. The authors used the LP DAAC MODIS Reprojection Tool to post-process their MODIS data. The results of the study indicate that the method of analyzing disturbance was effective for both forests and grasslands. Additionally, the adapted grassland method had comparable or higher accuracy than the analyses of the forest disturbance.
Written by: Danae Verba1
1Virtuoso, Inc., contractor to the U.S. Geological Survey, Earth Resources Observation and Science (EROS) Center, Sioux Falls, South Dakota, USA. Work performed under USGS contract G15PD00766 for LP DAAC2.
2LP DAAC Work performed under NASA contract NNG14HH33I.