Data products distributed by the Land Processes (LP) Distributed Active Archive Center (DAAC) are used in many different applications. They play an important role in modeling, helping to detect changes to the landscape, and assessing ecosystem variables, to name a few. Three of those applications, published between January and March 2018, are highlighted below. A more comprehensive list is accessible on the LP DAAC Publications webpage.
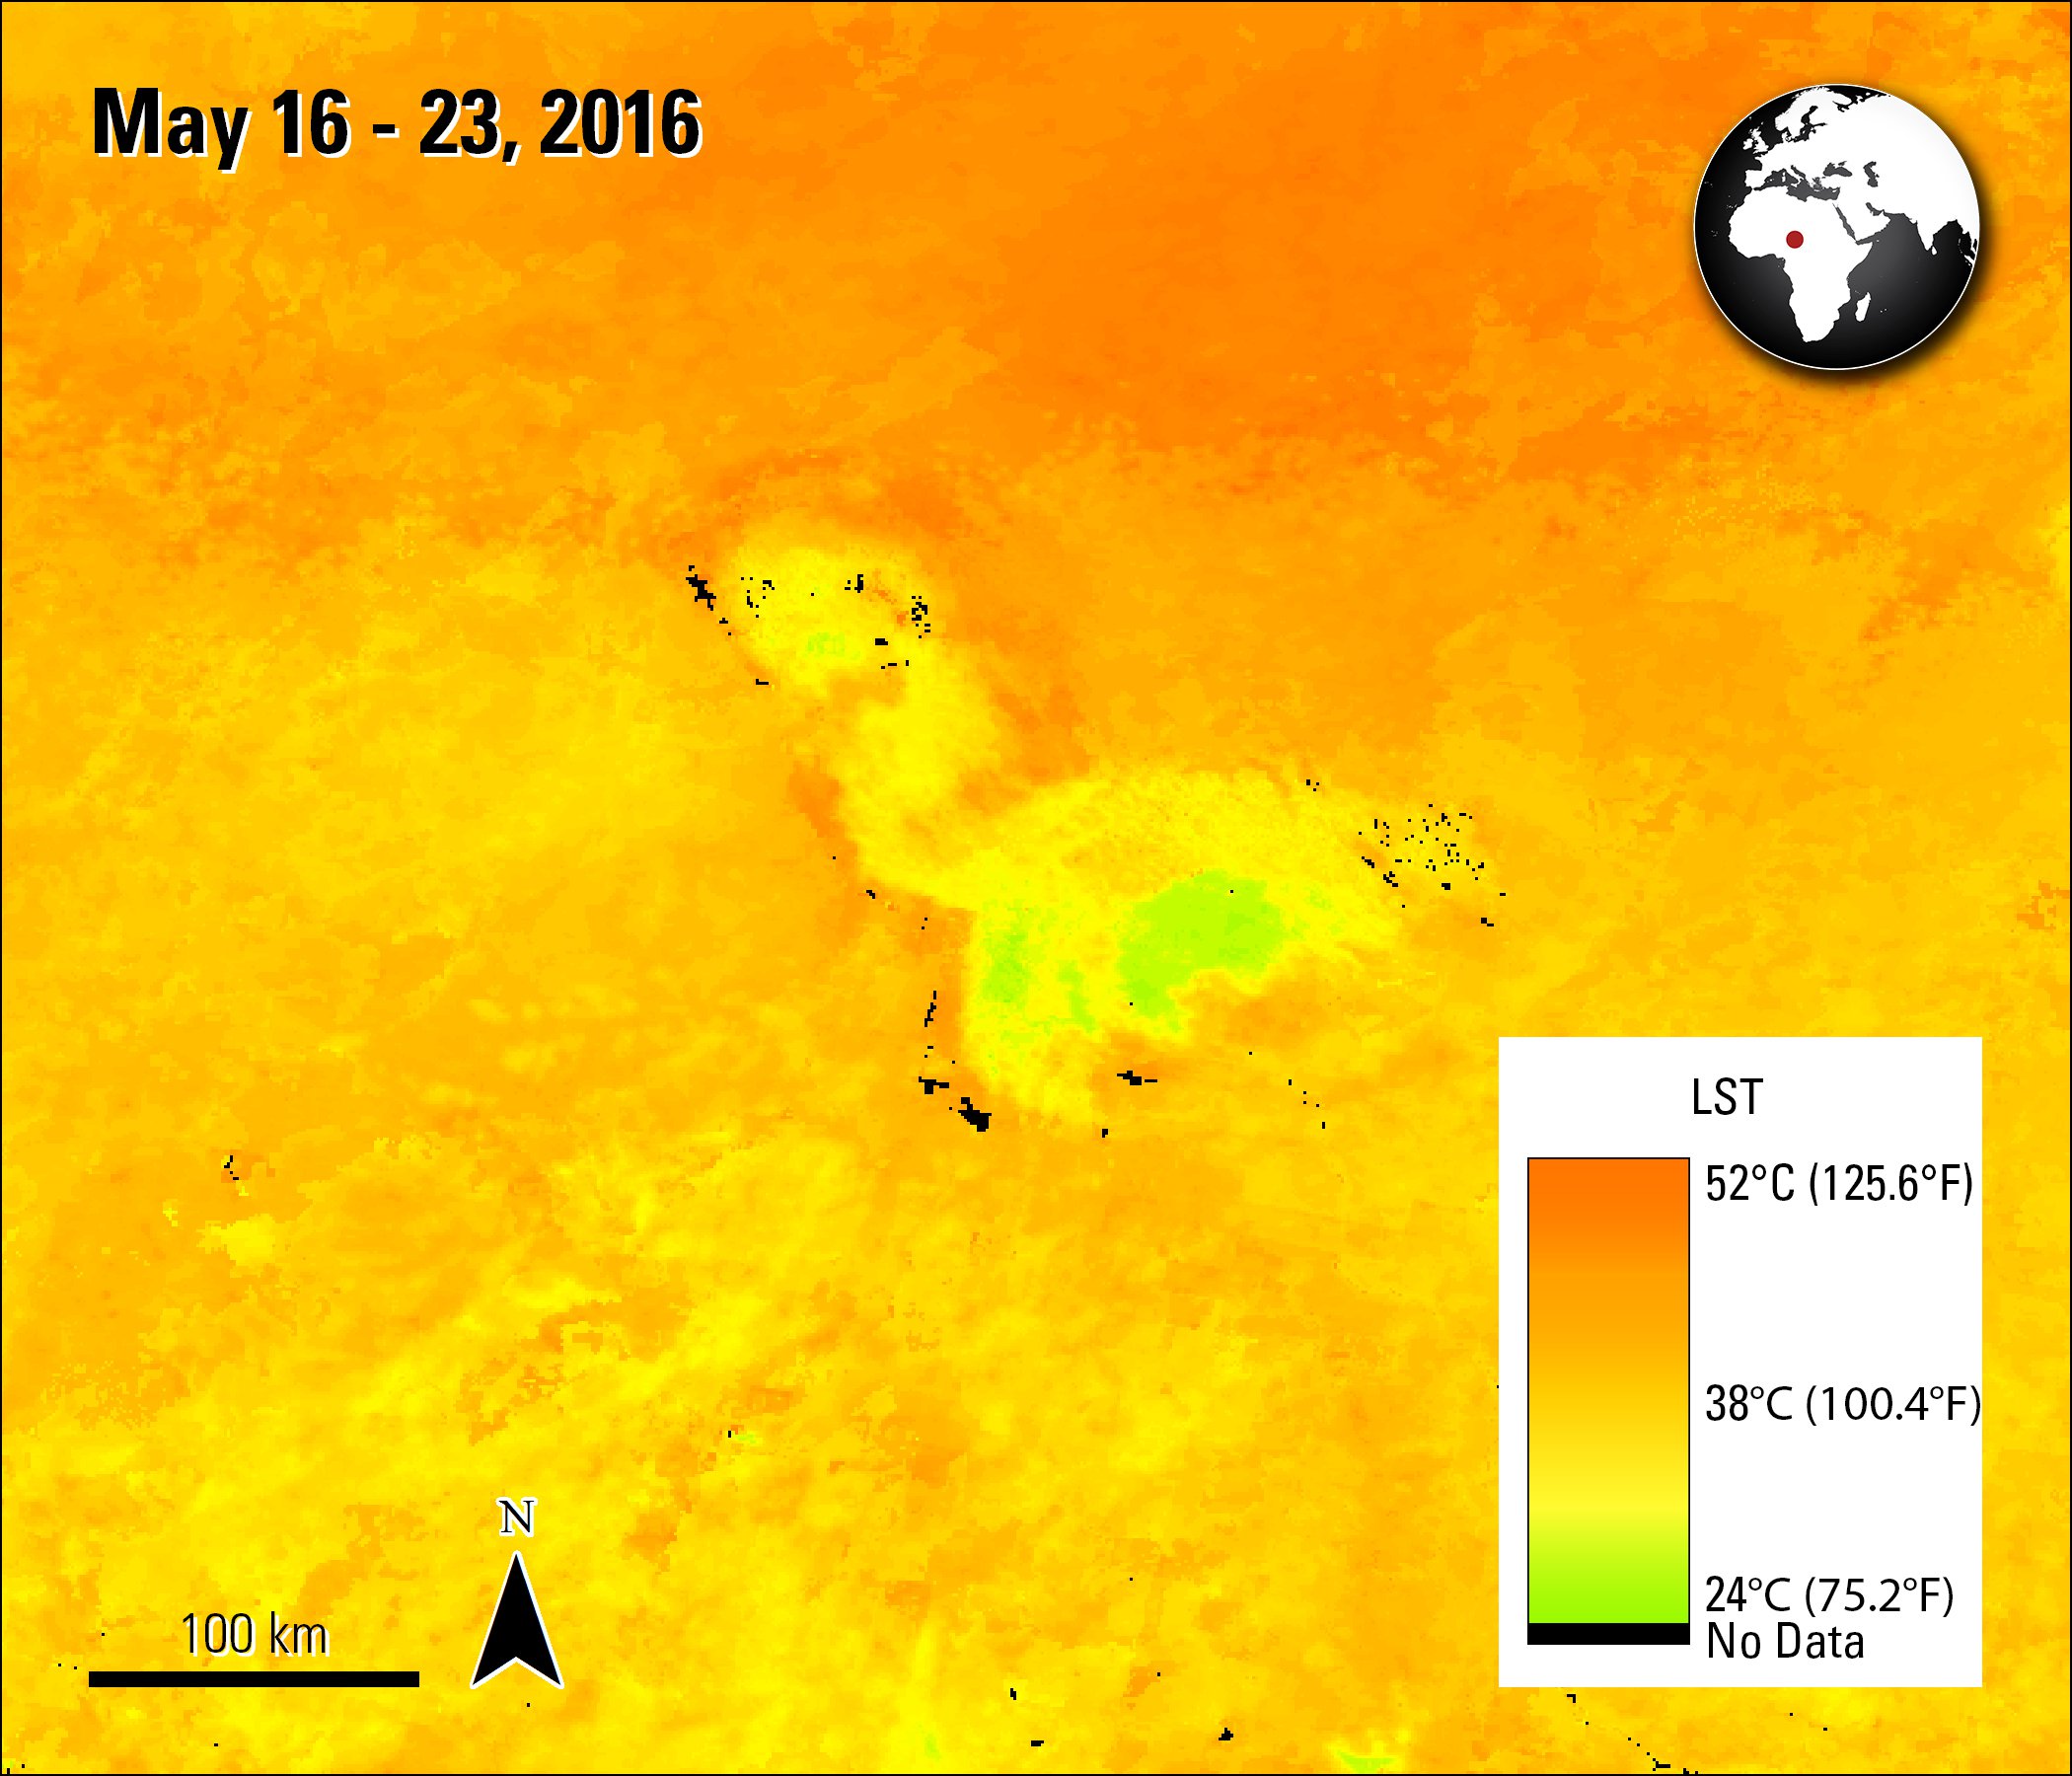
Lake Chad and the surrounding area is visible in this Terra MODIS 8-day land surface temperature image. The authors are able to estimate the water surface area of the lake using this data due to the water being cooler than the surrounding land.
Granule ID:
MOD11A2.A2016137.h19v07.006.2016242161053
DOI:
10.5067/MODIS/MOD11A2.006
Policelli, F., Hubbard, A., Hahn, C.J., Zaitchik, B., and Ichoku, C., 2018, Lake Chad total surface water area as derived from land surface temperature and radar remote sensing data: Remote Sensing, v. 10, no. 2, art. 252, at https://doi.org/10.3390/rs10020252.
In this paper, Policelli and others (2018) aim to create an extended record of the total surface water of Lake Chad for 1988 to 2016. Lake Chad provides a livelihood for an estimated thirteen million people. It is the world’s largest endorheic basin, or basin with limited drainage that allows no outflow to rivers or oceans but does meet with other lakes or swamps.
For this study, the authors use land surface temperature (LST) data derived from Terra MODIS (MOD11A2), previous LST measurements from earlier research, and C-band radar data from the European Space Agency (ESA)’s Sentinel-1a satellite during the dry seasons (January to May). The authors chose to use the LST data products because surface water, including areas with vegetation on top of the water, are typically colder than areas with no water. The authors perform a two-class unsupervised classification on the Terra MODIS LST data, and then the monthly total surface water area is estimated by interpolation from the data. The results of the classification were then compared to the existing monthly data record and used to extend the record by 15 years, doubling what was previously available. They were also compared to the Sentinel estimates; less than a two percent difference, on average, was found between the Terra MODIS and Sentinel data. While the authors found the surface water of the lake to be highly variable during the study period, the total surface water area was approximately 12,700 square kilometers (km2) (~3.1 million acres), on average. Ultimately, they found the total surface water typically increased approximately 143 km2 (35,336 acres) per year.
The new times series record developed during this study allowed the authors to answer fundamental questions about how the lake has changed over time. The authors note that this time series will be able to continue throughout the life of the Terra and/or Aqua MODIS satellites, but in the future, they could also use data provided by the Suomi National Polar Orbiting (Suomi NPP) Visible Infrared Imaging Radiometer Suite (VIIRS) satellite sensor. The authors believe future research could benefit from including in situ data and continuing to use radar and LST data to extend the time series even further.
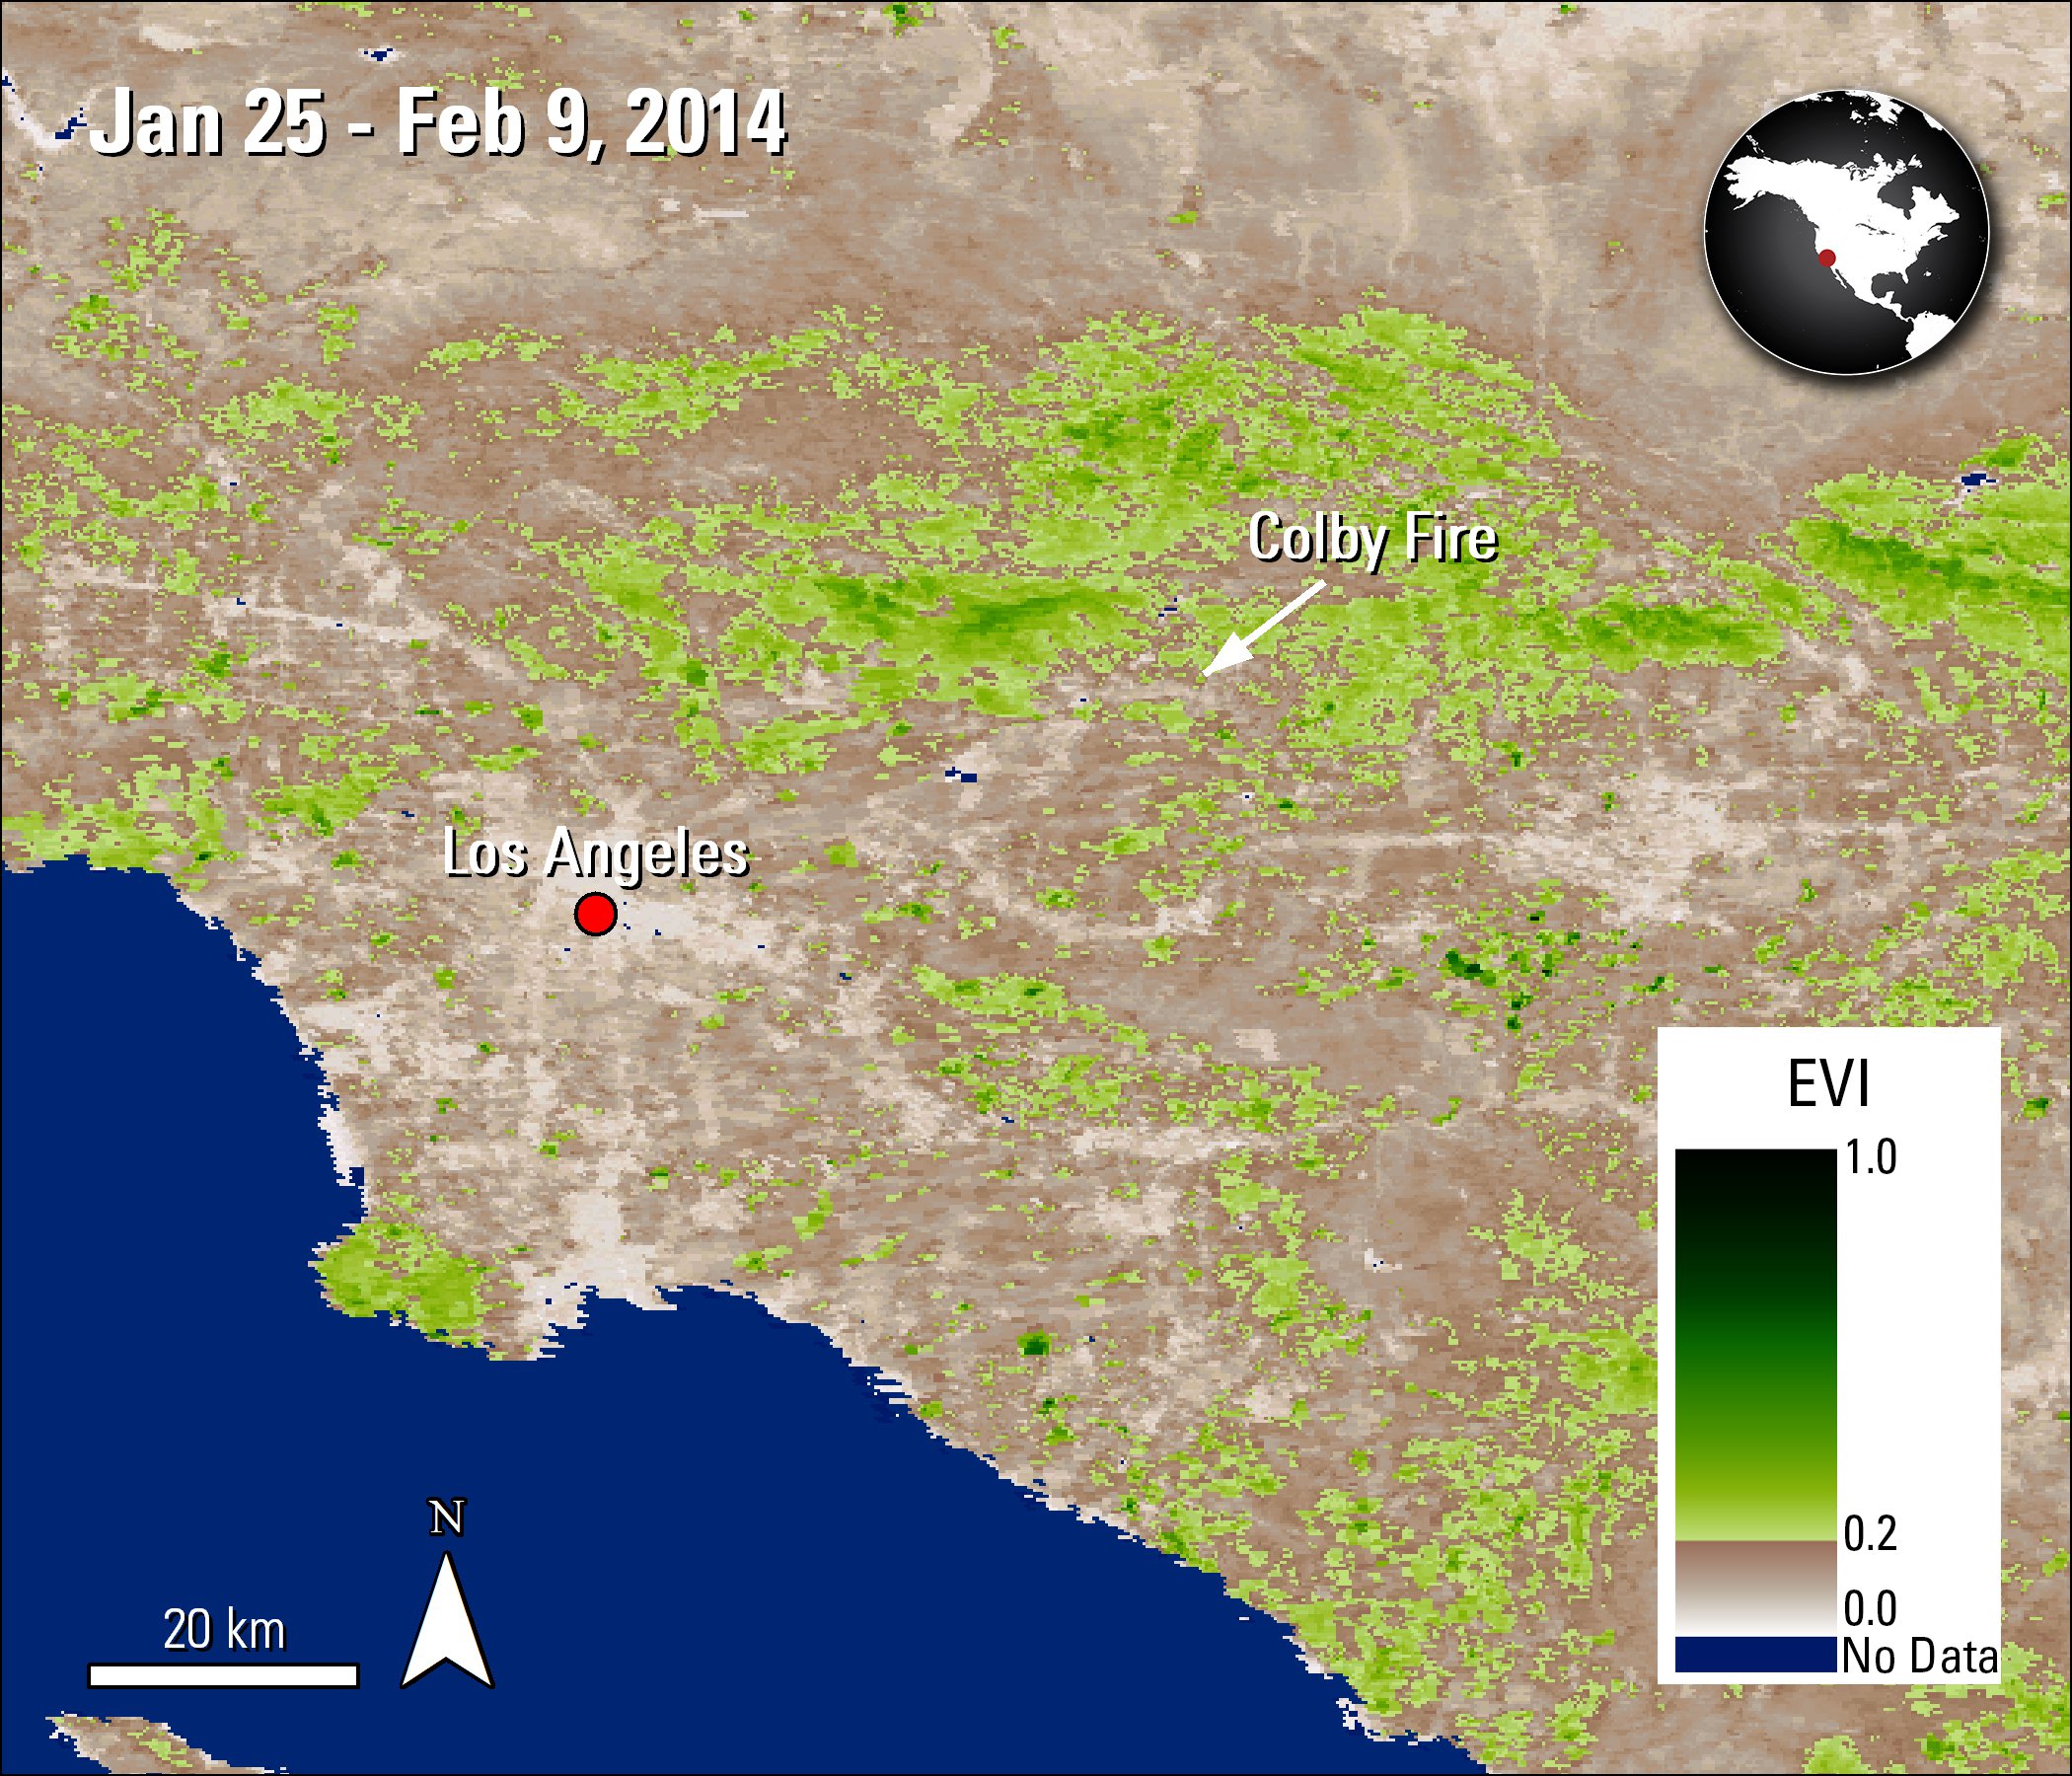
A view of the study area and Colby Fire from Myoung and others (2018) is shown in this Aqua MODIS 16-day enhanced vegetation index (EVI). EVI is designed to enhance the signal of vegetation and is an indicator of vegetation health. In this paper, the authors used it to help estimate live fuel moisture (LFM).
Granule IDs:
MYD13Q1.A2014025.h07v05.006.2015274223847
MYD13Q1.A2014025.h08v05.006.2015274223931
DOI:
10.5067/MODIS/MYD13Q1.006
Myoung, B., Kim, S.E., Nghiem, S., Jia, S., Whitney, K., and Kafatos, M., 2018, Estimating live fuel moisture from MODIS satellite data for wildfire danger assessment in Southern California USA: Remote Sensing, v. 10, no. 1, art. 87, at http://dx.doi.org/10.3390/rs10010087.
As the population and urban growth in Southern California increases, so does the risk of wildfires impacting this area. Myoung and others (2018) set out to test the relationship between live fuel moisture (LFM) and Terra and Aqua MODIS vegetation indicies (VI) data products (MOD13Q1 and MYD13Q1) in the chaparral ecosystem of Southern California between October 2002 and September 2012. LFM is a ratio of the wet and dry to only the dry weight of a vegetation sample; it is an important measurement to study where a wildfire might occur and how intense it could grow to be. The authors also use the normalized difference water index (NDWI), normalized difference infrared index (NDII), and the visible atmospherically resistance index (VARI) VIs derived from the MODIS 8-day surface reflectance product (MOD09A1). The VIs derived from the surface reflectance product were found to be acceptable indicators for soil moisture and vegetation water content.
In this study, the authors compare seasonal and interannual in-situ LFM data to MODIS VI data. They created an empirical model function of LFM based on optimal VI data combined with temperature data. Finally, they evaluated the feasibility and limitations of the model. The authors found the highest correlation to be between Aqua MODIS enhanced vegetation index (EVI) and LFM when looking at a radius of 10 kilometers (km) (6 miles), as compared to other VIs analyzed in the paper.
To test the capability of their MODIS VI-derived LFM model, the authors applied their model to the real-life wildfire case of the 2014 Colby Fire in the San Gabriel Mountains. The Colby Fire burned 740 hectares (1,962 acres), including five homes and 17 additional structures. The model showed a decrease of over 80 percent in LFM in the mountanious area from the previously recorded 140 percent approximately a year earlier. The week the fire ignited, the area was found to be below 60 percent LFM, which is considered a critical fire danger level and would have implemented pro-active measures to prepare for a fire. An EVI map of the Colby fire and the surrounding area, using Aqua MODIS data, is shown to the left.
The authors believe the model created in this study from the MODIS VI data improves over the presently used in-situ method because it increases the spatial and temporal coverage. They state that the model could be improved in the future by including air temperature, rainfall, and soil moisture data, and by adding higher spatial resolution data. The authors report that results from this study could be applied to the Mediterranean region of Europe, and other areas that have similar climatic conditions, and that the framework could be adapted for other climates as well.
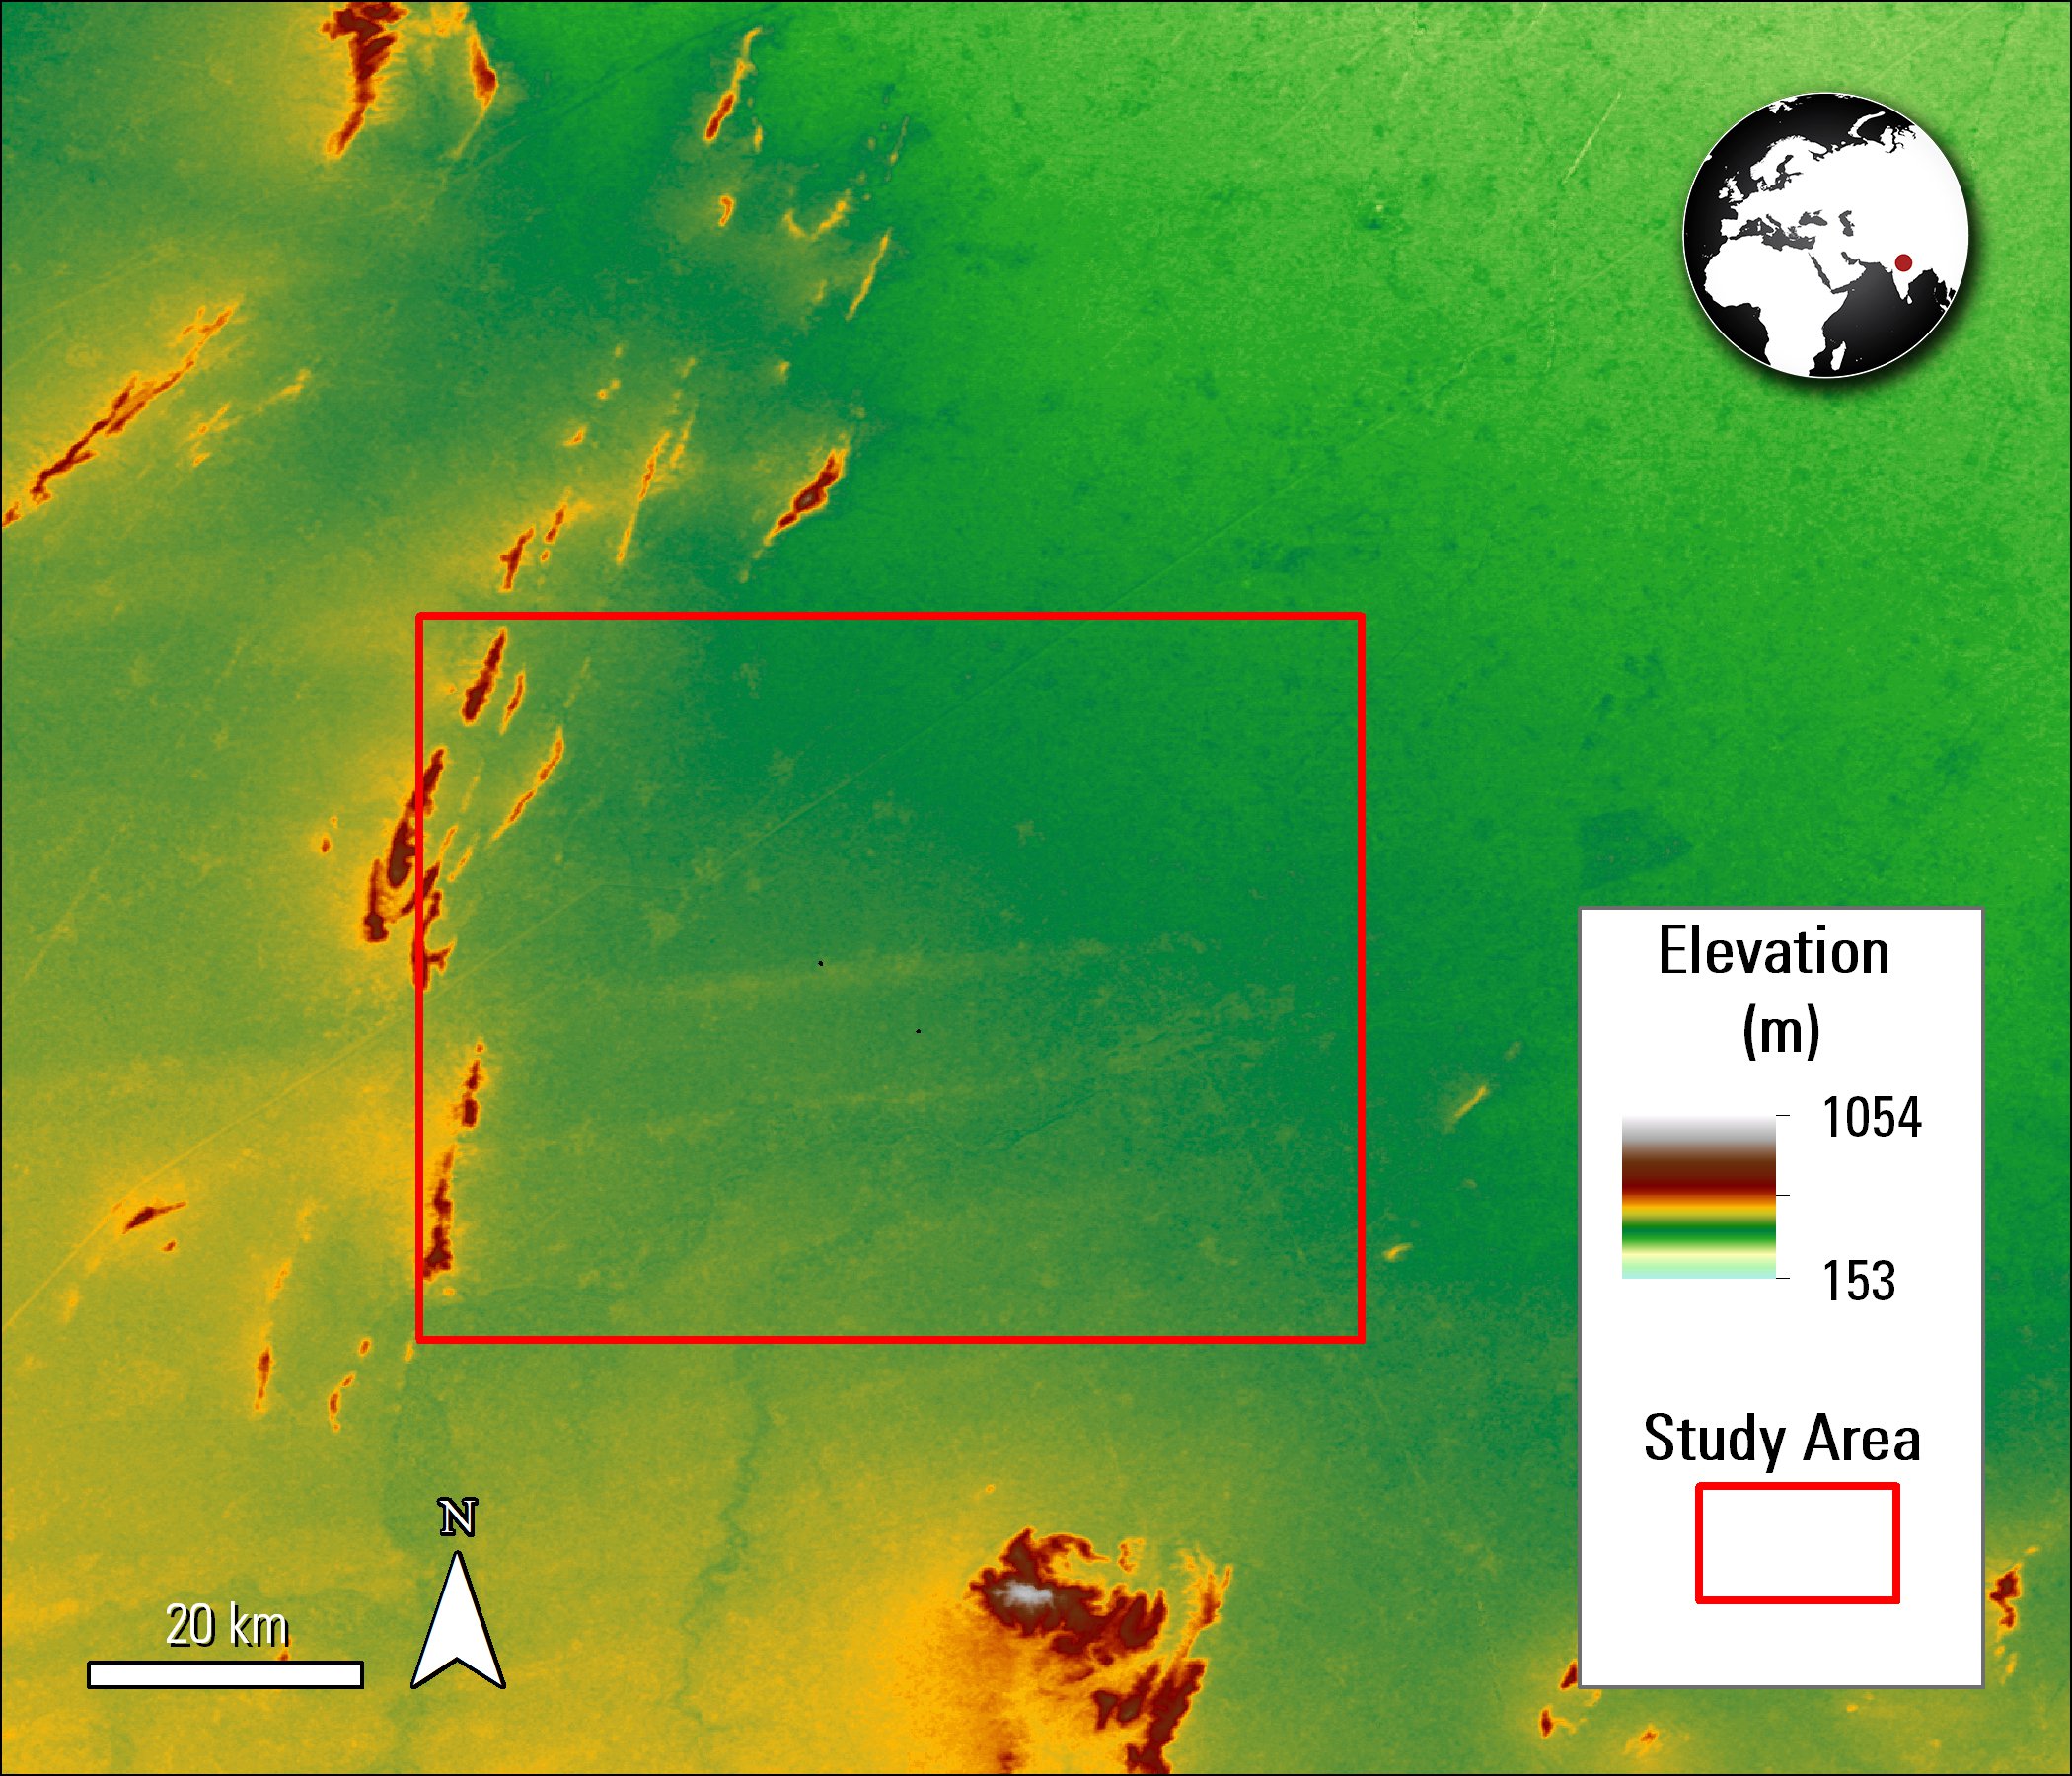
A Terra ASTER Global Digital Elevation Model (ASTER GDEM) image of the study area from Tiwari and others (2018) research. The authors used this data product to find areas where it is suitable to harvest rainwater.
Granule IDs:
ASTGTM2_N27E076_dem.tif
ASTGTM2_N28E076_dem.tif
DOI:
10.5067/ASTER/ASTGTM.002
ASTER GDEM is a product of METI and NASA.
Tiwari, K., Goyal, R., and Sarka, A., 2018, GIS-based methodology for identification of suitable locations for rainwater harvesting structures: Water Resources Management, v. 32, no. 5, p. 1811–1825. [Also available at http://dx.doi.org/10.1007/s11269-018-1905-9].
In this paper, the authors describe a new GIS-based methodology to discover potential areas for harvesting rainwater in the semi-arid environment of the Khushkhera-Bhiwadi-Neemrana Investment Region of the Alwar District of Rajasthan in India as a means for cost-effective water resource management. The authors look at several parameters, including soil type from the Survey of India, land use/land cover from the Indian Remote Sensing (IRS) Resourcesat 2 satellite, rainfall data from local rain gauges, and elevation from Terra ASTER Global Digital Elevation Model (ASTER GDEM) (ASTGTM) to help determine potential rain harvesting locations. The ASTER GDEM data product is used to find depressions in the area and also to measure slope to help understand the role of rain runoff and the velocity of water flow. The authors combine the DEM they created with drainage network information using an algorithm in their GIS software to identify where larger depression areas exist within the drainage network. Then, they select the depressions along the network that have the highest volume for further analysis.
The authors used the Soil Conservation Service - Curve Number method and 10 years’ of nearby weather station precipitation data to calculate the amount of rain runoff in the area. Once they have this information, they follow a set of criteria to determine suitable sites. These criteria include: depression sites larger than one hectare (2.5 acres), sites not located near an urban area due to the cost of land, and sites with a higher volume to area ratio than two to reduce loss from evaporation. Based on these criteria, they found seven potential rainfall harvesting sites that were suitable. Two of these sites were considered excellent, three were considered good, but required an overflow structure to be built, and two were determined not suitable because the storage capacity was not as large as the other sites. The sites were then validated with ground truth field data and Google Earth. The authors found this method to be both time- and cost-saving and believe it can be utilized in planning water resource management. Furthermore, they state this method could be used in different regions around the world.
Material written by Danielle Golon1
1 Innovate!, Inc., contractor to the U.S. Geological Survey, Earth Resources Observation and Science (EROS) Center, Sioux Falls, South Dakota, USA. Work performed under USGS contract G15PD00467 for LP DAAC2.
2 LP DAAC Work performed under NASA contract NNG14HH33I.