Data products from the Land Processes Distributed Active Archive Center (LP DAAC) are used in many different applications. They play an important role in modeling, help to detect changes to the landscape, and are a way to assess ecosystem variables. A few of those applications, published between July and September 2015, are highlighted below. A more exhaustive, albeit not complete, list can be accessed via our Publications webpage.
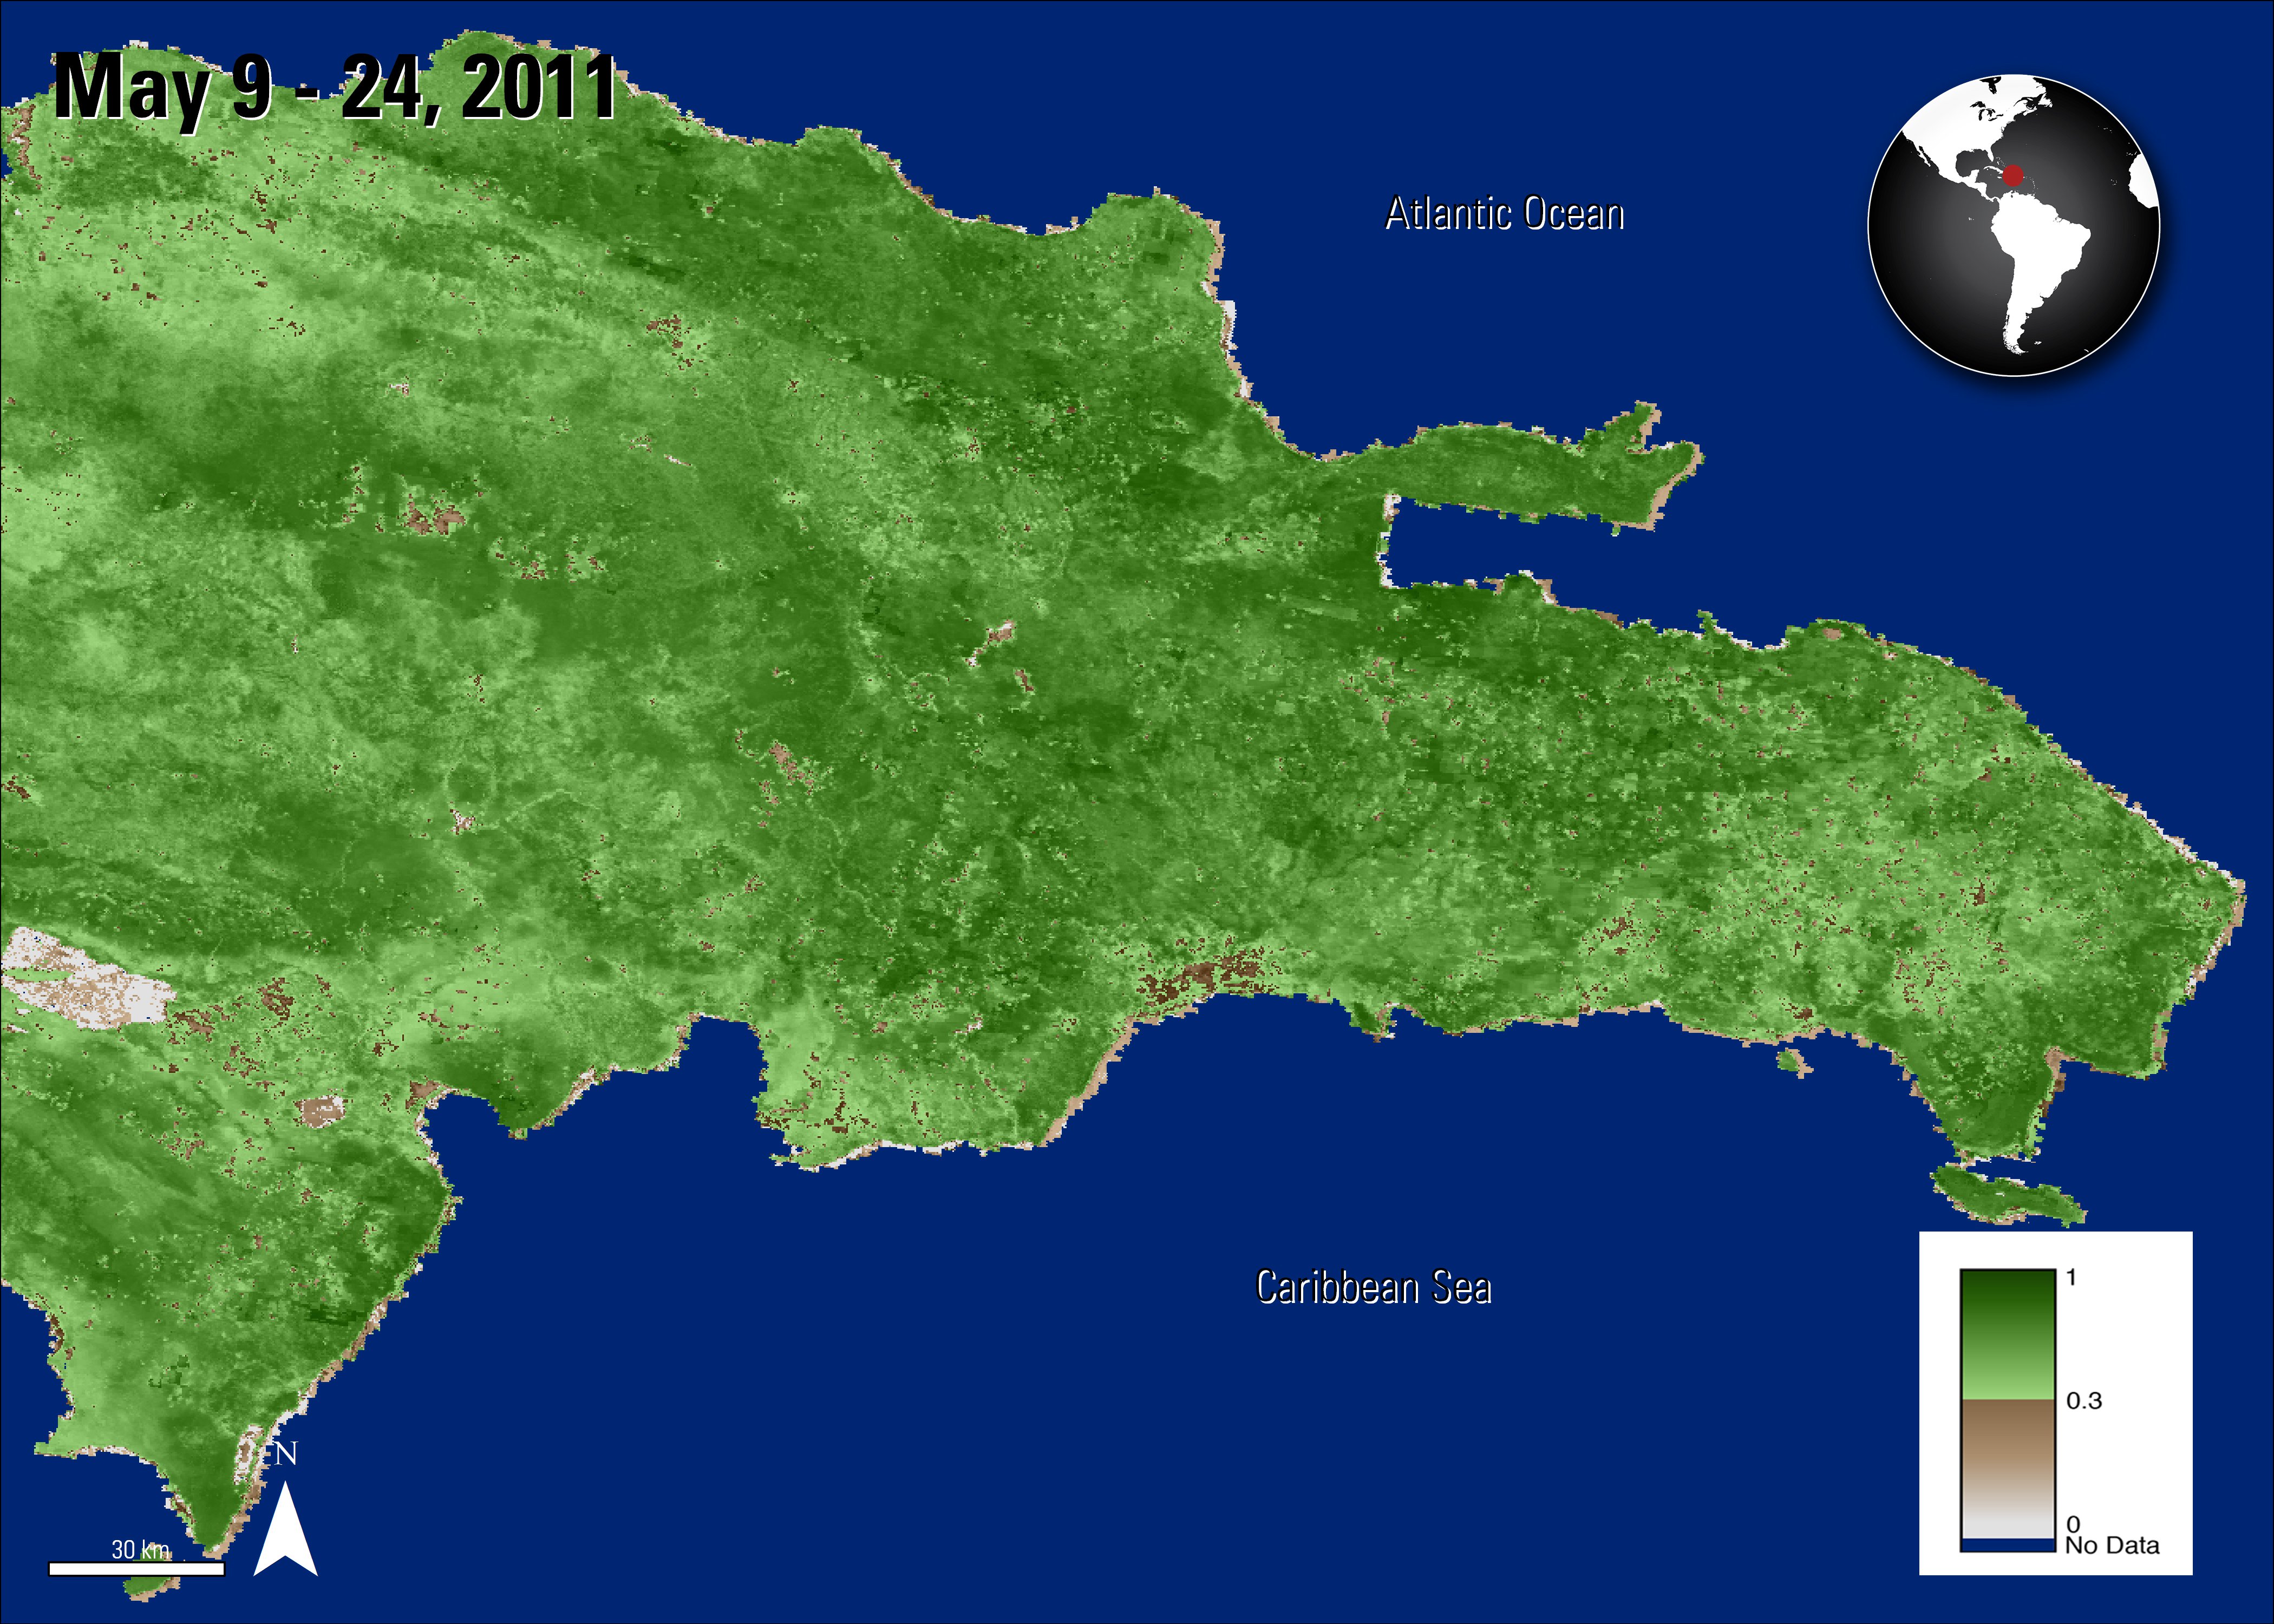
A Vegetation Indices (MOD13Q1) 16-day composite Normalized Difference Vegetation Index (NDVI) image showing the study area of the Dominican Republic from May 9 to 24, 2011, which is during the study period.
Granule ID:
MOD13Q1.A2011161.h11v07.005.2011179145417
A Vegetation Indices (MOD13Q1) 16-day composite Normalized Difference Vegetation Index (NDVI) image showing the study area of the Dominican Republic from May 9 to 24, 2011, which is during the study period.
Granule ID:
MOD13Q1.A2011161.h11v07.005.2011179145417
Sangermano, F., Bol, L., Galvis, P., Gullison, R., Hardner, J., and Ross, G., 2015, Habitat suitability and protection status of four species of amphibians in the Dominican Republic: Applied Geography, v. 63, p. 55-65. [Also available at http://dx.doi.org/10.1016/j.apgeog.2015.06.002]
Sangermano and others (2015) use vegetation data from Terra’s Moderate Resolution Imaging Spectroradiometer (MODIS) from 2000 to 2011 to evaluate changes in the habitat of four amphibian species in protected areas of the Dominican Republic. The authors chose to use MODIS due to its daily acquisition and frequent revisit of an area and its ability to capture larger areas.
Three of the species are endemic to the islandof Hispaniola and are considered vulnerable; the fourth species is native to the Dominican Republic and is considered a near threatened species. These species require specific habitats and are highly susceptible to habitat degradation. The major threats to these species are logging, charcoal production, and infrastructure development, all of which lead to forest loss.
The authors identified the habitats based on in-situ data and previous research. The authors examined land cover data, the availability of energy and water based on monthly temperature and precipitation measurements, and vegetation cover NDVI data derived from the vegetation indices (MOD13Q1) for the years 2000 to 2011. Changes in the NDVI vegetation cover time series were calculated using the ManneKendall statistic to detect any declines in vegetation productivity in forest areas.
During the study period, the authors estimated that the forested habitat decreased in size between 7.7 and 9.3 percent. The authors also found that the Dominican Republic does not have abundant habitat areas for the four amphibian species, with only 13 to 27 percent of the country being considered suitable habitat. Using NDVI, the authors were able to estimate and compare the rates of change in both the protected and unprotected areas. The authors reported that comparing NDVI values is useful when a detailed land cover map is not available. They also believe using these resources can help identify areas that would benefit from a new protection status and can help manage existing protected areas.
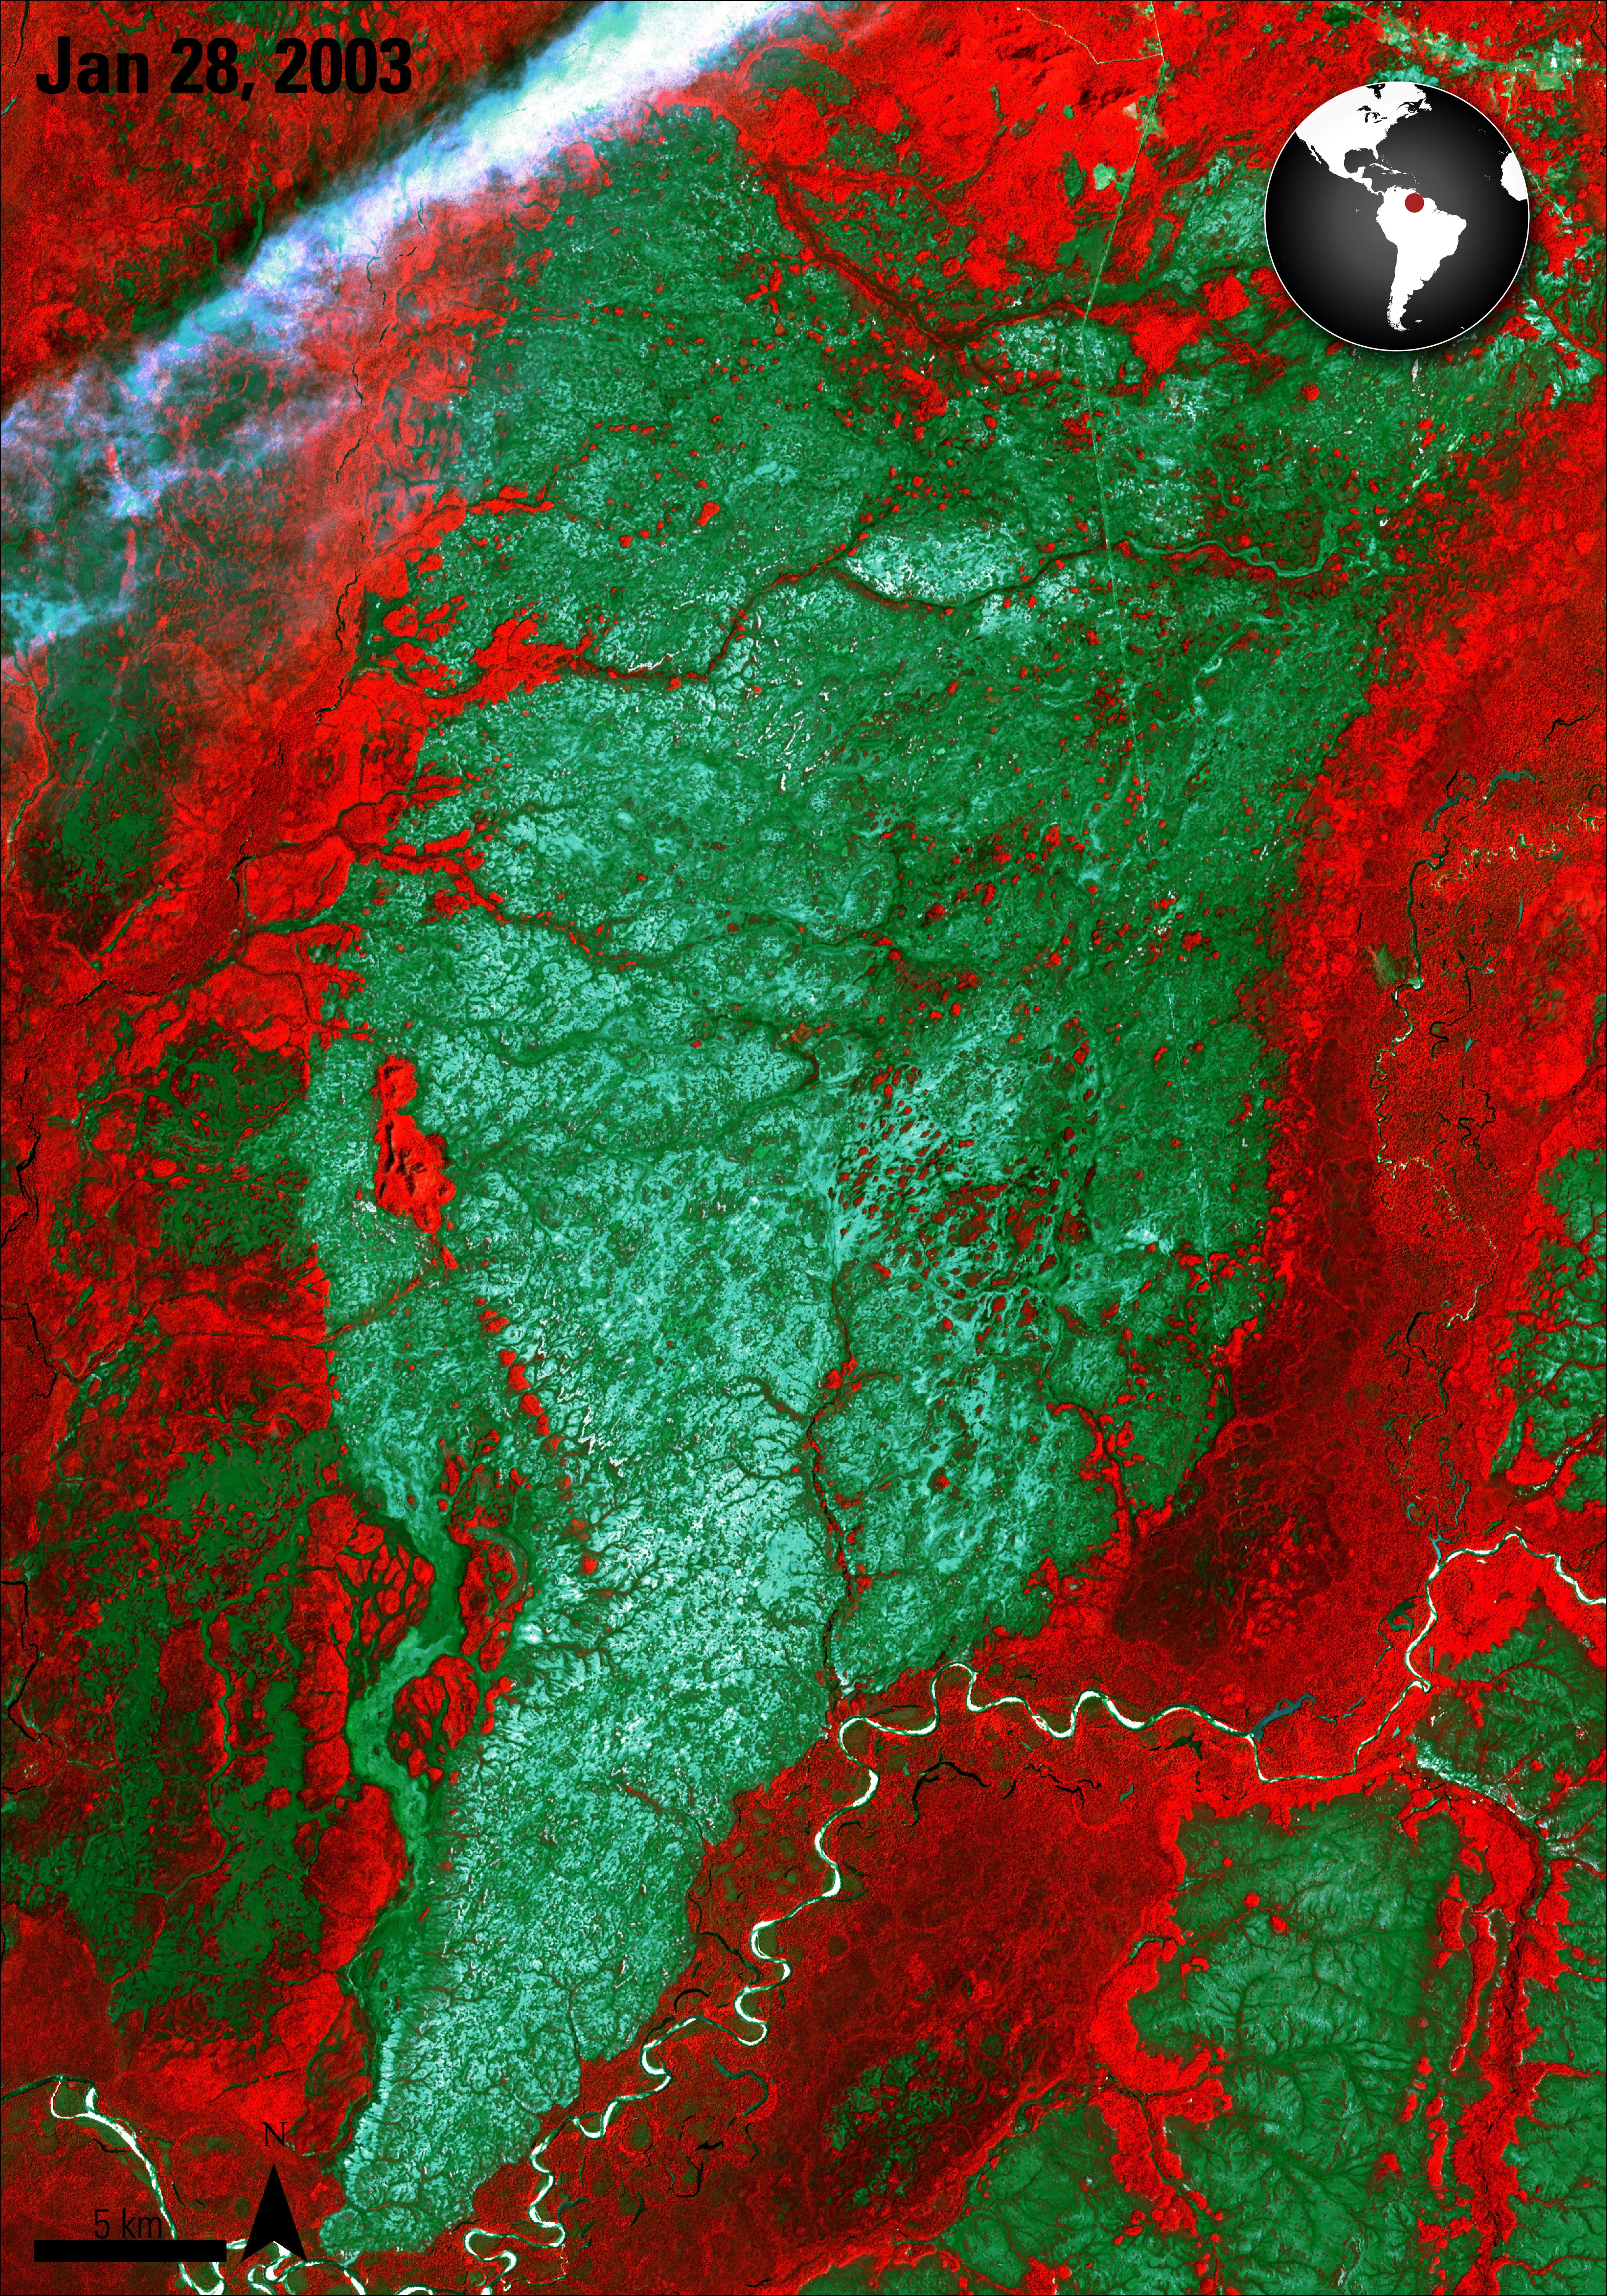
View of Viruá megafan using ASTER bands 3, 2, 1 (RGB). In this band combination, campinaranaappear bluish-green and the adjacent forest is red.
Granule ID:
AST_07_00301282003143626_20151008124340_14512
AST_07_00301282003143634_20151008124339_14514
View of Viruá megafan using ASTER bands 3, 2, 1 (RGB). In this band combination, campinaranaappear bluish-green and the adjacent forest is red.
Granule ID:
AST_07_00301282003143626_20151008124340_14512
AST_07_00301282003143634_20151008124339_14514
de Oliveira Cordeiro, C.L., and de Fátima Rossetti, D., 2015, Mapping vegetation in a late Quaternary landform of the Amazonian wetlands using object based image analysis and decision tree classification: International Journal of Remote Sensing, v. 36, no. 13, p. 3397-3422. [Also available at http://dx.doi.org/10.1080/01431161.2015.1060644]
When viewing satellite imagery of the Amazonian wetlands in northern Brazil, several triangular or fan-shaped areas are apparent. These areas are called ‘megafans’ and are the result of a distributary drainage system active during the late Quaternary period (0.5 – 1.0 million years ago). As megafans are typically vast and inaccessible, remote sensing is a preferred method to collect data about these areas. In this study, Advanced Spaceborne Thermal Emission and Reflection Radiometer (ASTER) imagery is used as an input to distinguish distribution of land cover types of the Viruá megafan, an approximately 916 square kilometer (~354 square miles) region located in central Brazil.
The vegetation of the megafan is generally described as campinarana, which is a collection of several vegetation types, including grasslands, shrublands, herbaceous/woodlands and forest. Distinguishing the various campinarana types requires a fine-scale resolution; previous studies have achieved, at best, 46 to 77 percent accuracy and generally do not encompass an entire megafan. By using remote sensing data and combining the various classifications into a decision tree, the authors automated the identification of many land cover types over the entire Viruá megafan and achieved an overall accuracy of 87 percent.
Initially, a red-green-blue (RGB) combination of ASTER bands 3, 2, and 1 from data collected January 28, 2003 was used to create a mask distinguishing campinarana from the adjacent forest area. Normalized Difference Vegetation Index (NDVI) values calculated from ASTER bands 2 and 3 were key to differentiate grass and shrub campinarana from woody and forested campinarana. ASTER band 1 distinguishes campinarana from adjacent wetland areas as well as woody campinarana from forest campinarana. Additional data from Landsat 5 Thematic Mapper, synthetic aperture radar images, elevation data from the Shuttle Radar Topography Mission, and Advanced Land Observing Satellite/Phased Array type L-band Synthetic Aperture Radar are used to further classify areas.
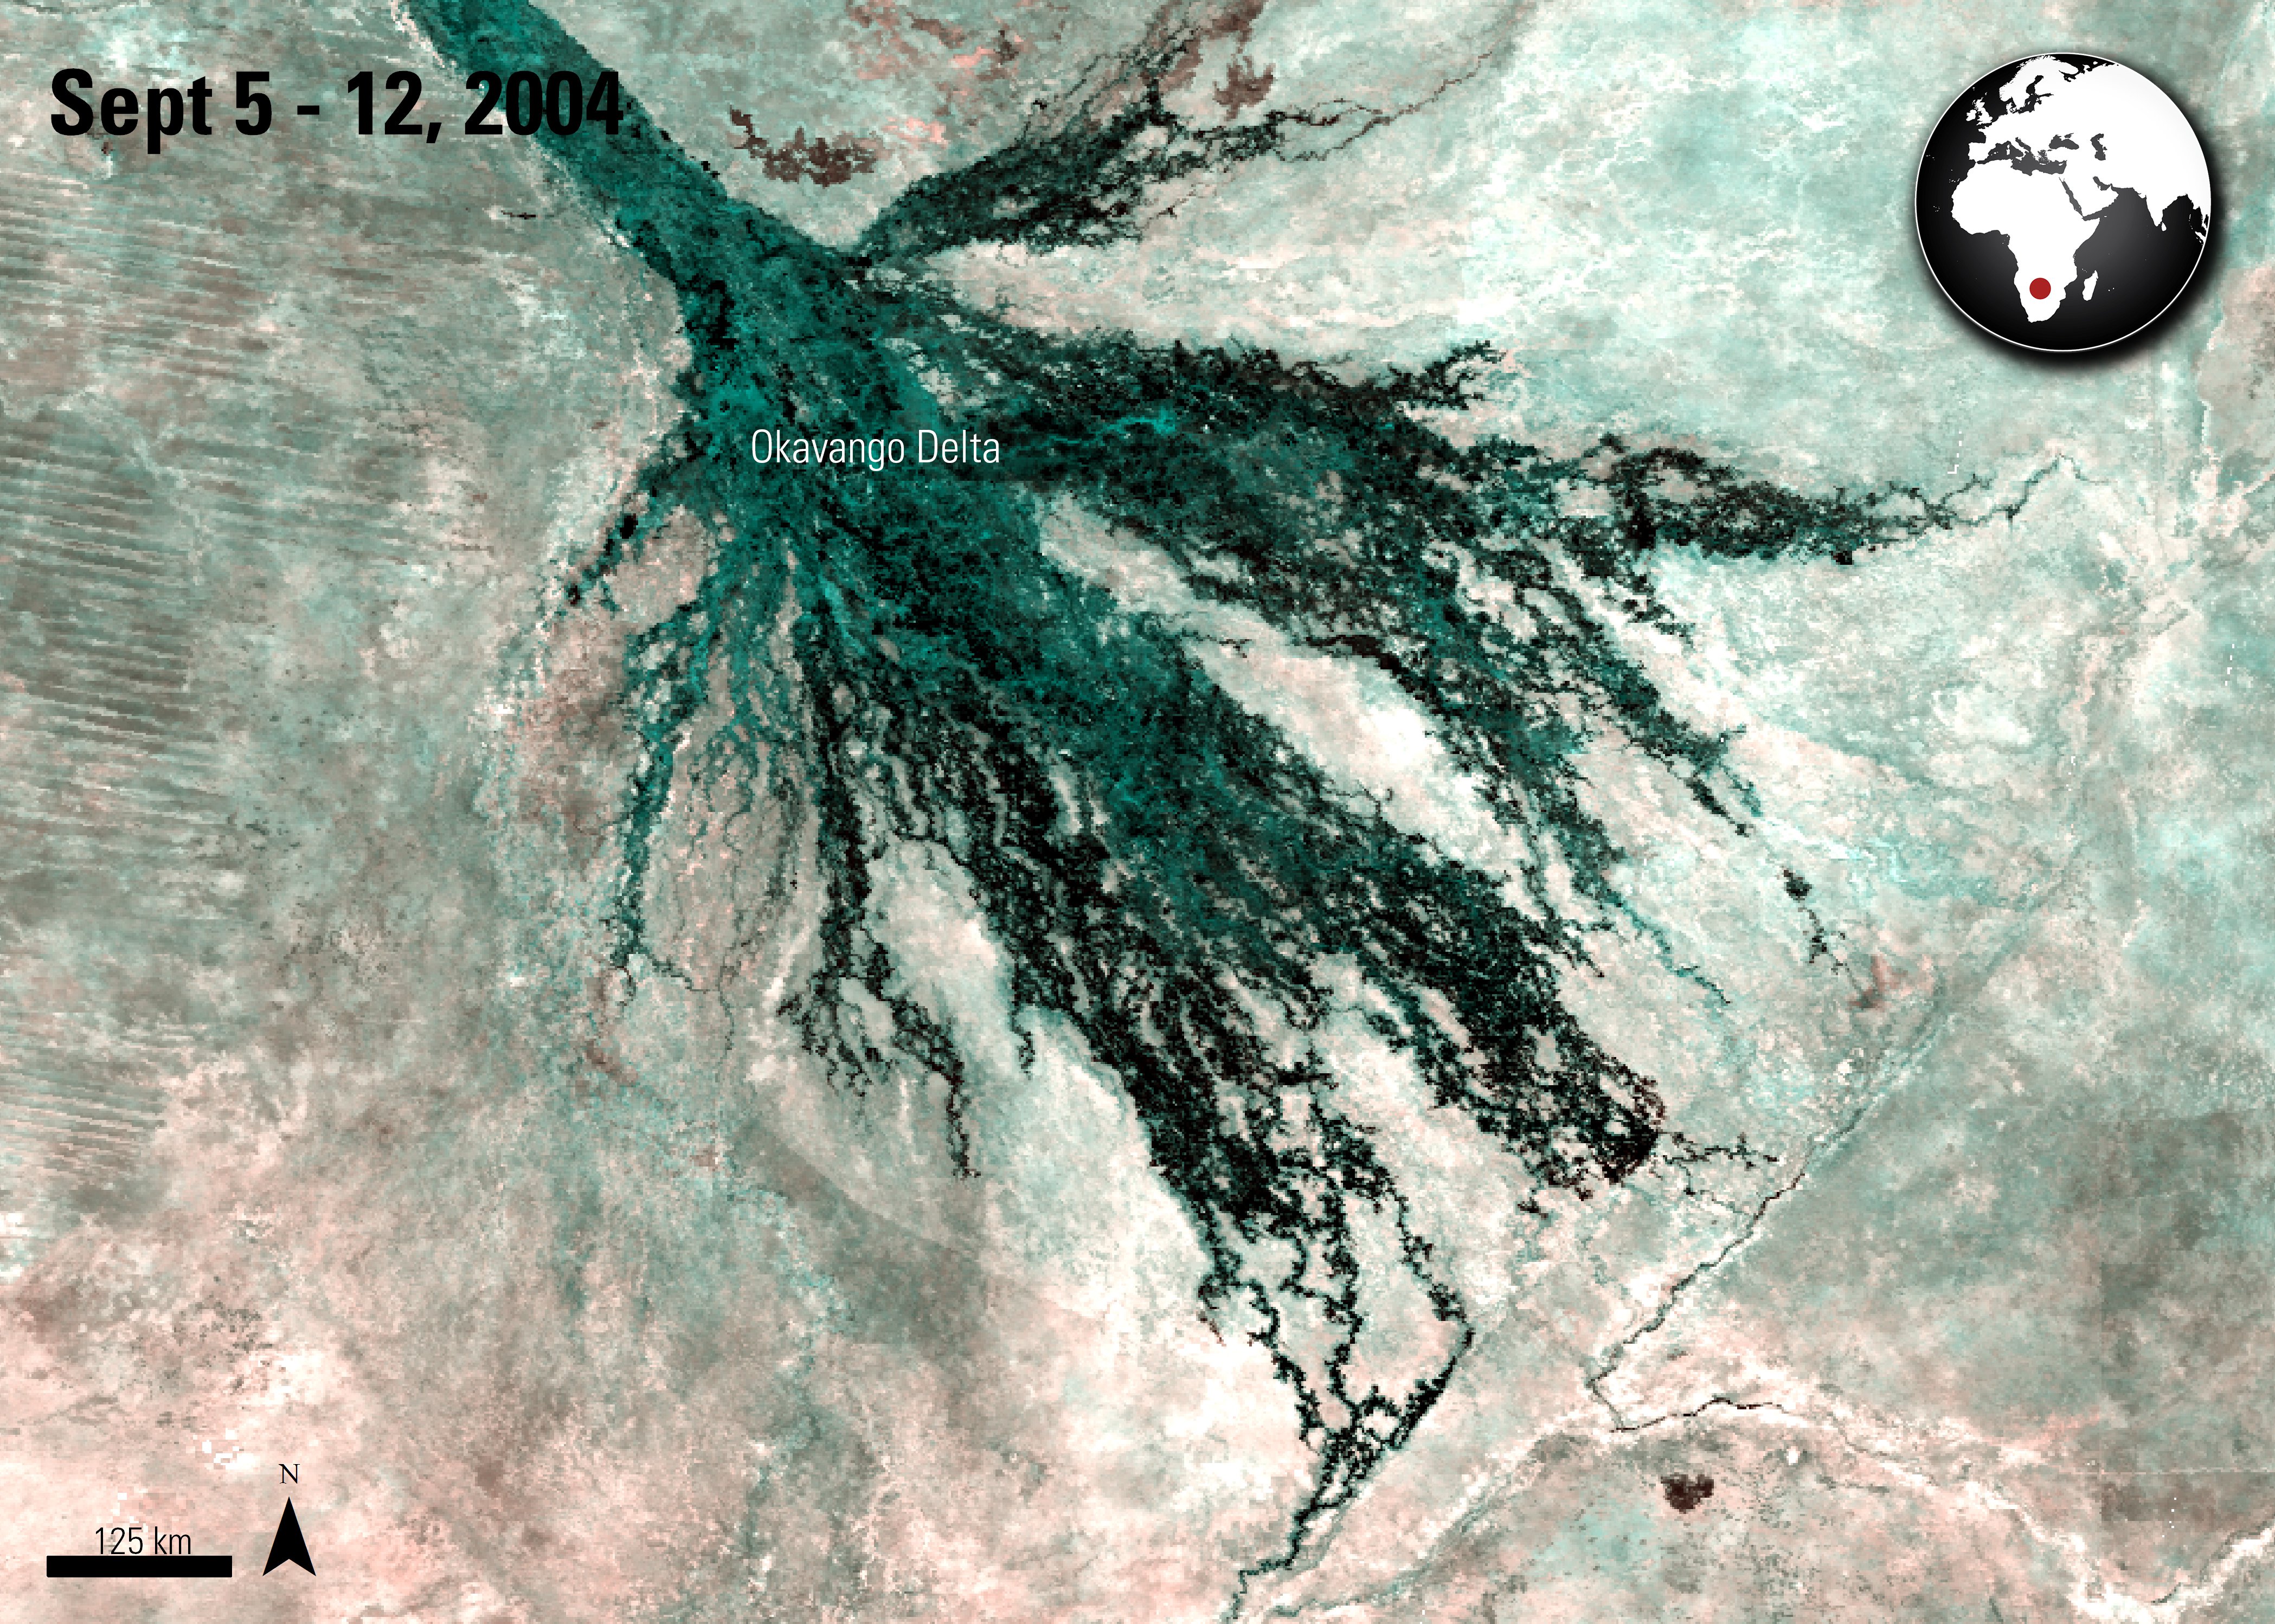
A false color composite of a surface reflectance (MOD09Q1) scene of the Okavango Delta from September 5 to 12, 2004. During this year Botswana experienced what the authors identify as a large and long flood.
Granule ID:
MOD09Q1.A2004249.h20v10.005.2007313190837
MOD09Q1.A2004249.h20v11.005.2007313195105
Murry-Hudson, M., Wolski, P., Cassidy, L., Brown, M., Thito, K., Kashe, K., and Mosimanyana, E., 2015, Remote sensing-derived hydroperiod as a predictor of floodplain vegetation composition: Wetlands Ecology and Management, v. 23, p. 603-616. [Also available at http://dx.doi.org/10.1007/s11273-014-9340-z]
Murry-Hudson and others (2015) use Terra’s Moderate Resolution Imaging Spectroradiometer (MODIS) Surface Reflectance product (MOD09Q1) to monitor the Okavango Delta wetland in Botswana. Their purpose is to establish a history of flooding in the area and understand how it relates to potential ecological changes in the area. The authors started monitoring the area with satellite imagery from 1989. They considered MODIS to be an excellent choice for its monitoring potential to generate near-real time flood extent maps in the Okavango Delta wetland system.
In the study, two imagery time series of flooded areas are created. The first uses Landsat data from 1989 to 2007. MODIS Surface Reflectance data are used to fill in the missing information from the years 1991, 2003, and 2004. The second time series consists of 89 8-day 250 meter surface reflectance images (MOD09Q1) images collected from 2000 to 2007, which were obtained from the Land Processes Distributed Active Archive Center (LP DAAC) Data Pool. The authors stacked these MODIS images to create a flood duration map of the Okavango delta for each water year. The MODIS data were validated with in-situ community vegetation data and Landsat data.
The authors found that recurring flooding in the area varies between 2,000 and 3,600 square kilometers (~772 and 1,390 square miles), with maximum flooding reaching 7,200 square kilometers (~2,780 square miles) in 2006. In the time series, it was evident that peak flooding occurred during the months of August and September. The authors were able to examine differences in types of floods and the duration of inundation in the Delta. They were also able to distinguish between low-amplitude short-duration flooding, which occurred in 2003, and a larger and longer flooding, as seen in the image to the left from 2004. Both of these floods caused parts of the delta to be inundated for the entire year and other areas of the delta that are typically dry were inundated for half of the year. The authors then used this data in combination with in-situ measurements, to identify what type of vegetation is in the areas and how they relate to frequencies and durations of floods. They found that the maps created from MODIS Surface Reflectance Band 1 (MOD09Q1) produced flood maps with 89 percent or greater accuracy, as compared to field data and Landsat imagery. The authors have initiated a long-term monitoring program at the Okavango Research Institute to compare flooding extents and to identify classes of floodplain vegetation using MODIS data.
Material written by Danielle Golon1 and Danae Verba2
1Innovate!, Inc., contractor to the U.S. Geological Survey, Earth Resources Observation and Science (EROS) Center, Sioux Falls, South Dakota, USA. Work performed under USGS contract G15PD00766 for LP DAAC3.
2Virtuoso, Inc., contractor to the U.S. Geological Survey, Earth Resources Observation and Science (EROS) Center, Sioux Falls, South Dakota, USA. Work performed under USGS contract G15PD00766 for LP DAAC3.
3LP DAAC Work performed under NASA contract NNG14HH33I.