Data products distributed by the Land Processes (LP) Distributed Active Archive Center (DAAC) are used in many different Earth science applications. They play an important role in modeling, helping to detect changes to the landscape, and assessing ecosystem variables, to name a few. Three of those applications, published between October and December 2018, are highlighted below. A more comprehensive list is accessible on the LP DAAC Publications webpage.
Pringle, M., Schmidt, M., and Tindall, D., 2018, Multi-decade, multi-sensor time-series modelling—based on geostatistical concepts—to predict broad groups of crops: Remote Sensing of Environment, v. 216, p. 183–200. [Also available at https://doi.org/10.1016/j.rse.2018.06.046.]
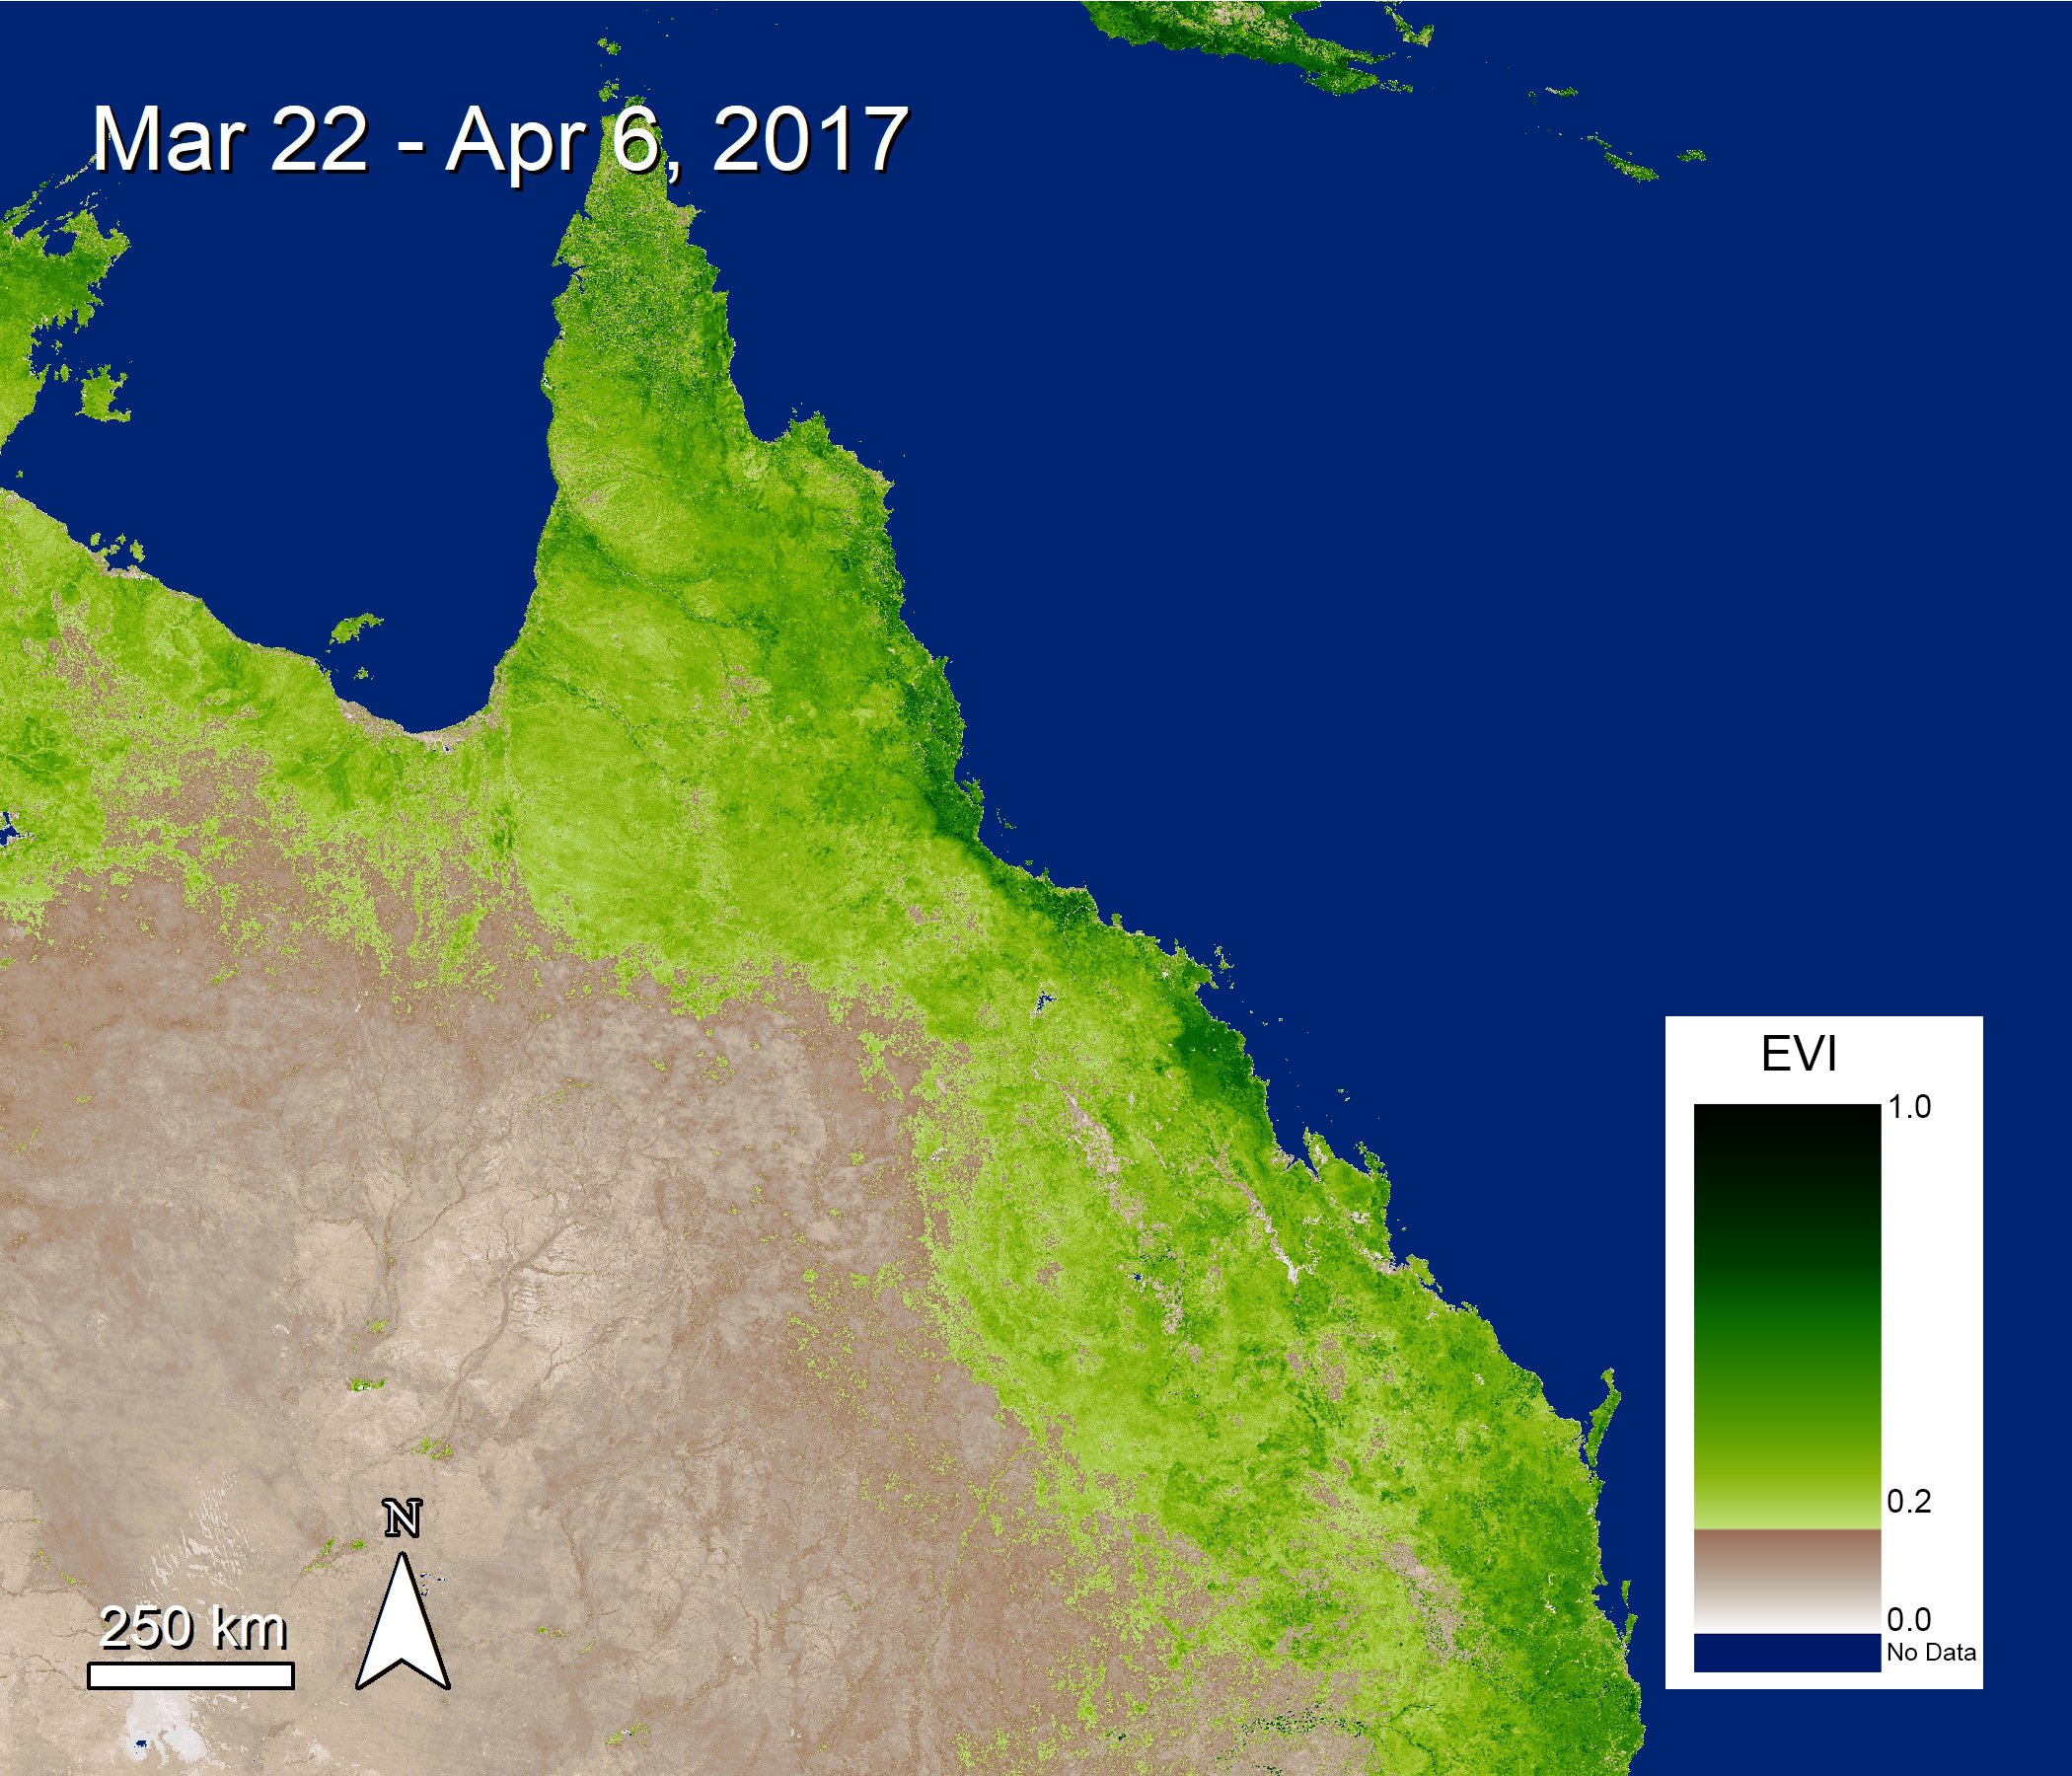
A view of Queensland, Australia, the study area from Pringle and others (2018), showing the Enhanced Vegetation Index (EVI) layer from the Terra MODIS Vegetation Indices data product during the austral summer 2017.
Granule IDs:
MOD13Q1.A2017081.h30v10.006.2017111085104
MOD13Q1.A2017081.h30v11.006.2017111085115
MOD13Q1.A2017081.h31v10.006.2017111085105
MOD13Q1.A2017081.h31v11.006.2017111085106
MOD13Q1.A2017081.h32v10.006.2017111085045
MOD13Q1.A2017081.h32v11.006.2017111085035
DOI:
10.5067/MODIS/MOD13Q1.006
Pringle and others (2018) set out to create biannual maps of broad groups of crops in Queensland, Australia, from 1987 to 2017, including maps for summer (November to May) and winter (June to October). These maps are created using a combination of Landsat, Sentinel-2A, and Terra MODIS Vegetation Indices (MOD13Q1) data. First, the authors filter the MODIS data to include only high-quality data, based on the MODLAND QA bit. (Author’s note: MODIS QA values need to be decoded to interpret the meaning of each QA bit. Data users interested in working with MODIS quality data are encouraged to visit the e-learning section of the LP DAAC website to learn more about how to decode the quality information using several simple tools offered from the LP DAAC.) Then the authors apply a pixel-based time-series model across the study area, for each growing season, to three different variables they derived from the data, including Enhanced Vegetation Index (EVI), Bare Ground (BA), and non-photosynthetic vegetation (NPV). Their time-series modeling method creates weekly-averaged predicted phenological metrics. Those metrics are used as explanatory variables for a tiered tree classification model used to predict groups (i.e. crop and non-crop) for the maps the author will then create.
The maps created from this method correctly predicted where Coarse-grain (cotton and cereal) and Pulse existed in 79 percent of cases in the study area, where bare soil existed in 72 percent of cases in the summer and 88 percent of cases in the winter, and where Other (pastures, woody vegetation, and crop residues) existed by 98 percent in the summer and 99 percent in the winter. The authors explicitly note that MODIS was very helpful in their project for filling in the gaps in data during times of unusually wet winters or when Landsat was turned off over the region. They also state that when MODIS eventually retires, VIIRS or Sentinel-3 data can be used for continuity in future maps. Maps from this project are being used legislatively to protect crucial agricultural land in Queensland, and the authors believe they can also be used to tailor water management strategies to help protect the Great Barrier Reef. The authors think their model could be used in countries with reasonably similar climate and soil. In the future the authors would like to re-train the classification model to begin in the early season, to provide near real-time mapping of planting areas to help with harvest logistics and the financial market.
Xia, H., Chen, Y., and Quan, J., 2018, A simple method based on the thermal anomaly index to detect industrial heat sources: International Journal Applied Earth Observation Geoinformation, v. 73, p. 627–637. [Also available at https://doi.org/10.1016/j.jag.2018.08.003.]
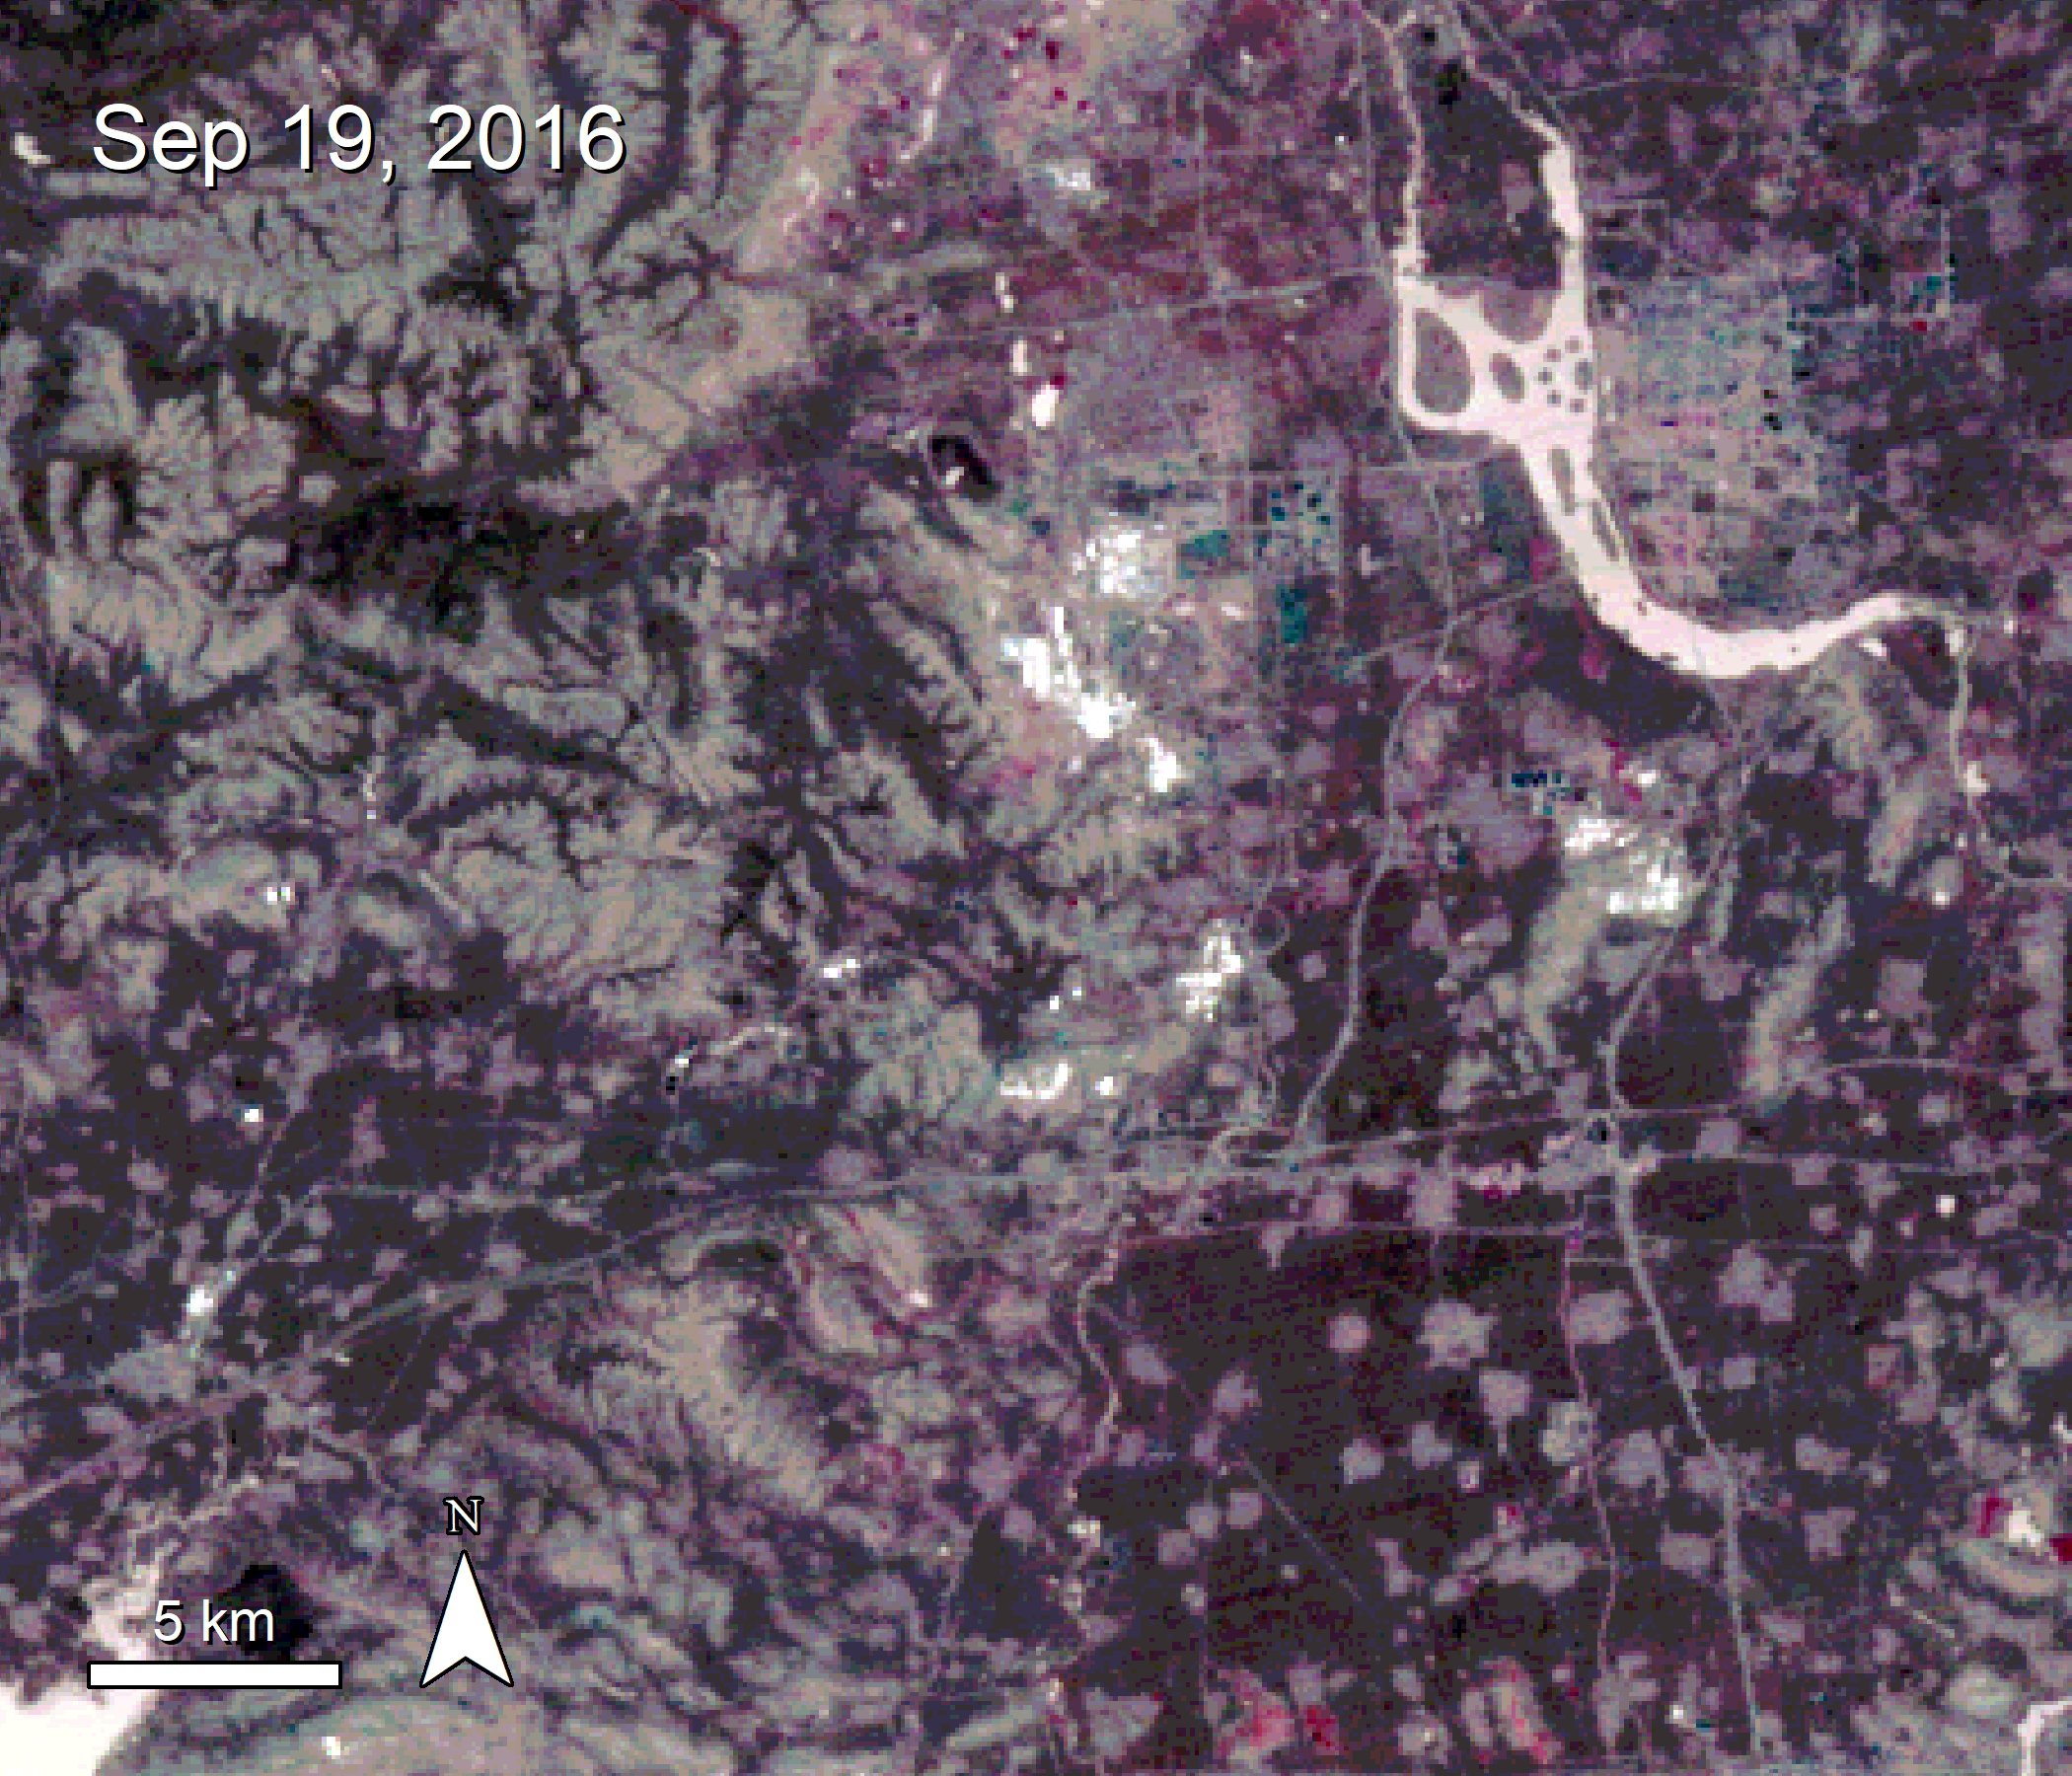
One of the Terra ASTER TIR images used by Xia and others (2018) in their research over Tangshan. The bright white shapes in the image indicate sources of heat.
Granule ID:
AST_L1T_00309192016140353_20160920103058_6133
DOI:
10.5067/ASTER/AST_L1T.003
One of the Terra ASTER TIR images used by Xia and others (2018) in their research over Tangshan. The bright white shapes in the image indicate sources of heat.
Granule ID:
AST_L1T_00309192016140353_20160920103058_6133
DOI:
10.5067/ASTER/AST_L1T.003
In this paper, Xia and others (2018) introduce a method that uses Terra ASTER Precision Terrain Corrected (AST_L1T) Thermal Infrared (TIR) data to detect industrial heat sources from smaller factories. These factories currently often go undetected but can have a significant effect on the environment near Tangshan, the industrial center of Beijing, Tianjin, and Hebei, China. The authors use the ASTER Thermal Band to derive the Thermal Anomaly Index (TAI) to extract hotspots at night. They then use Landsat 8 imagery to identify and remove water pixels and Suomi NPP VIIRS Nighttime Lights data to remove instances of wildfires. They look for increases in temperatures in the data and then categorize these increases as industrial heat sources. Next the authors use Google Earth to confirm the existence of industrial sources where they found an increase in heat. The authors also confirm these changes in wavelength curves using the Suomi NPP VIIRS Day/Night Band Nighttime Lights data for the same location, date, and time. This helps to indicate that the sources of heat were constant and not thermal anomalies. The authors also use Terra and Aqua MODIS Thermal Anomalies and Fire (MOD14A1 / MYD14A1) products to aid in identifying and confirming potential fire pixels.
The TAI used in the paper was able to confidently detect almost all the hotspots identified by the Suomi NPP VIIRS data and was able to identify smaller hotspots that were not large enough to be detected by the Suomi NPP VIIRS data. The authors found the accuracy of their method to be 85.13 percent. Using this method, the authors were able to detect small-scale factories with combustion processes that were previously undetected. The authors believe this method will help to monitor smaller factories that might not follow emissions standards.
Zambrano, F., Vrieling A., Nelson, A., Meroni, M., and Tadesse, T., 2018, Prediction of drought-induced reduction of agricultural productivity in Chile from MODIS, rainfall estimates, and climate oscillation indices: Remote Sensing of Environment, v. 210, p. 15–30. [Also available at https://doi.org/10.1016/j.rse.2018.10.006.]
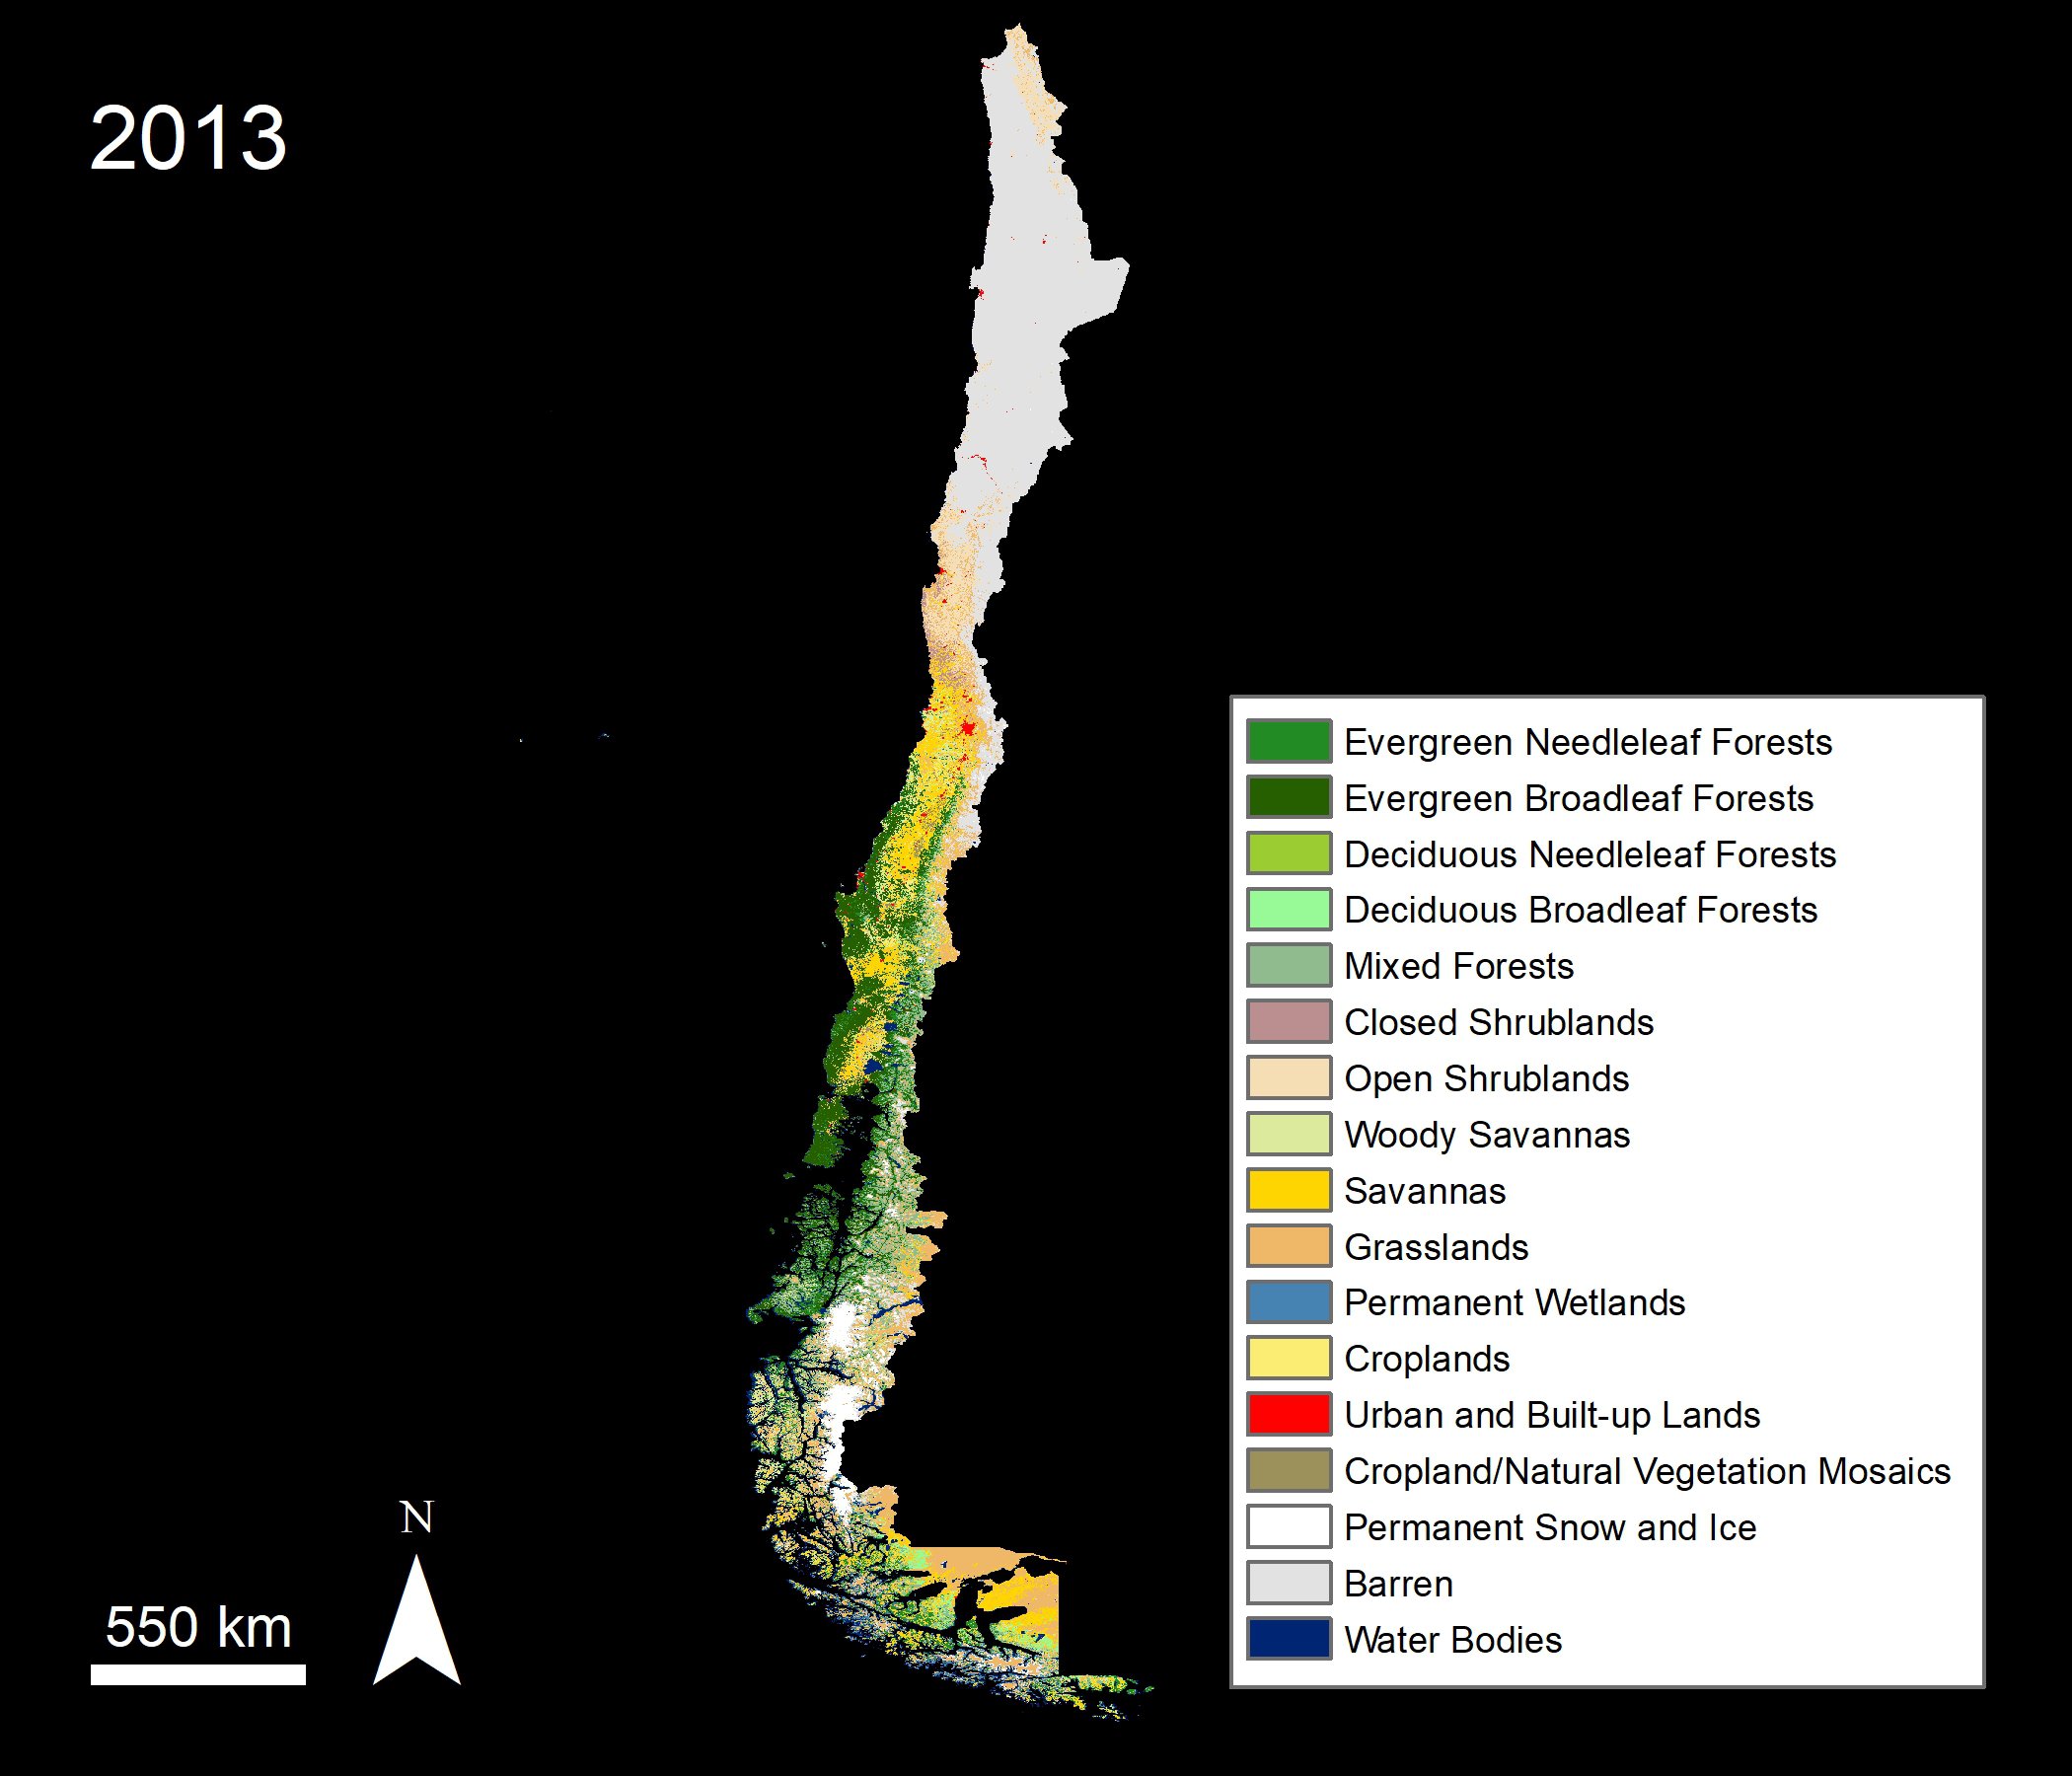
The Combined Terra and Aqua MODIS Land Cover product over Chile for the year 2013, one of the data products used in Zambrano and others (2018).
Granule IDs:
MCD12Q1.A2013001.h10v11.006.2018055005430
MCD12Q1.A2013001.h11v10.006.2018055005520
MCD12Q1.A2013001.h11v11.006.2018055005617
MCD12Q1.A2013001.h11v12.006.2018055005539
MCD12Q1.A2013001.h12v12.006.2018055005712
MCD12Q1.A2013001.h12v13.006.2018055005723
MCD12Q1.A2013001.h13v13.006.2018055005832
MCD12Q1.A2013001.h13v14.006.2018055005837
MCD12Q1.A2013001.h14v14.006.2018055005917
DOI:
10.5067/MODIS/MCD12Q1.006
In this study, Zambrano and others (2018) assess if interannual variability in crop biomass productivity can be accurately predicted using no-cost, near real-time satellite data over 758 census units across Chile for the years 2000–2017. The authors use the International Geosphere-Biosphere Programme (IGBP) layer from the Combined Terra and Aqua MODIS Land Cover Type (MCD12Q1) data product to derive a cropland mask over their study area, and the Land Cover Dynamics (MCD12Q2) data product to obtain start of season, end of season, and length of season data. They also use Normalized Difference Vegetation Index (NDVI) data from the Terra MODIS Vegetation Indices (MOD13A1) product to assess any productivity anomalies. In addition, they use satellite precipitation data, and climatic oscillation indices data from the National Oceanic and Atmospheric Administration (NOAA). The authors took two different prediction approaches. The first approach is optimal linear regression (OLR), where they look at each individual census unit and the single drought predictor that best explains inter-annual variability in the Z-scored cumulative NDVI. The other approach they use is deep learning (DL), where they use all drought predictors for all the census units identified in the study and combine them into a single spatio-temporal model. The authors found that cumulative NDVI could be used as a proxy for crop productivity during the growing season and that it could be accurately predicted by OLR and DL models. The authors believe their methods could be used in other regions of the world with localized climatic oscillation indices and could be improved with additional drought predictors, such as temperature.
(Author’s Note: Zambrano and others (2018) used the Version 5.1 MCD12Q1 and MCD12Q2 data products in their research; both of these data products are now available as Version 6.)
Material written by Danielle Golon1
1 Innovate!, Inc., contractor to the U.S. Geological Survey, Earth Resources Observation and Science (EROS) Center, Sioux Falls, South Dakota, USA. Work performed under USGS contract G15PC00012 for LP DAAC2.
2 LP DAAC Work performed under NASA contract NNG14HH33I