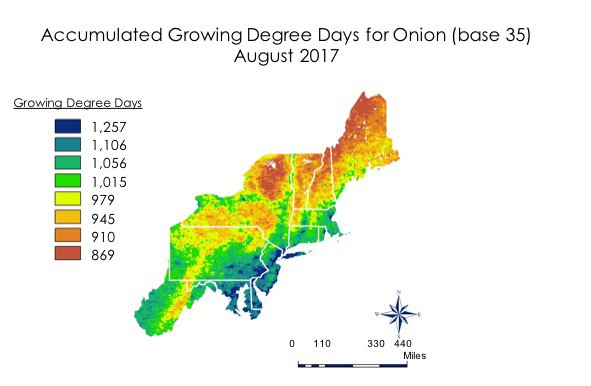
This map displays growing degree days (GDD), created from Aqua and Terra MODIS LST data, for onion crops for August 2017. Onions will grow at a base temperature of 1.6°C (35°F). Here, the darker the shade of blue, the higher the accumulated temperatures over the base temperature of 1.6°C. For example, if the temperature exceeds the base temperature by 4.4° C (40°F) per day for 30 days, the GDD of that area for the month is 1,200. Results from the maps created in this project can be used by decision-makers in the agricultural industry to monitor temperatures and GDDs across the growing season. Image courtesy of the Northeast US Cross-Cutting “Developing Annual, Seasonal, and Monthly Temperature Indices over the Northeast United States to Represent Recent Temperature Trends using NASA and NOAA Datasets?” project team.
This map displays growing degree days (GDD), created from Aqua and Terra MODIS LST data, for onion crops for August 2017. Onions will grow at a base temperature of 1.6°C (35°F). Here, the darker the shade of blue, the higher the accumulated temperatures over the base temperature of 1.6°C. For example, if the temperature exceeds the base temperature by 4.4° C (40°F) per day for 30 days, the GDD of that area for the month is 1,200. Results from the maps created in this project can be used by decision-makers in the agricultural industry to monitor temperatures and GDDs across the growing season. Image courtesy of the Northeast US Cross-Cutting “Developing Annual, Seasonal, and Monthly Temperature Indices over the Northeast United States to Represent Recent Temperature Trends using NASA and NOAA Datasets?” project team.
During the Fall 2017 term of NASA’s DEVELOP National Program, participants used geospatial data and technologies to investigate, analyze, and monitor several issues around the world. Some of the topics this term included drought, invasive species, temperature, wildfires, disease, water resources, and urbanization. Each project completed by a DEVELOP team is conducted in partnership with agencies or organizations local to the study area. Fundamental to the analytical and geospatial component of each of these projects is NASA Earth science remote sensing data. Many of these projects use data collected by the Moderate Resolution Imaging Spectroradiometer (MODIS) sensor onboard NASA’s Terra and Aqua satellites and derived data from NASA’s Shuttle Radar Topography Mission (SRTM), data that are distributed by the LP DAAC.
All projects conducted in the Fall Term, as well as in past terms, can be found in the DEVELOP archive.
One of the projects, “Developing Annual, Seasonal, and Monthly Temperature Indices over the Northeast United States to Represent Recent Temperature Trends using NASA and NOAA Datasets,” used NASA Earth observation data to study temperature trends throughout the Northeastern United States. According to data from NASA Goddard's Global Surface Temperature Analysis (GISTEMP) and NOAA nClimgrid, each year, for the past forty years, has been ranked in the top ten warmest years on record. While these years have been the warmest on record, some of them were still cooler in temperature than the years that surround them. For example, on average the year 2012 was colder than 2010 or 2013 but was still ranked in the top ten warmest years on record.
The DEVELOP team set out to provide a simple way to understand how temperature trends have changed monthly, seasonally, and annually over the last few decades. The team specifically used Land Surface Temperature (LST) data from Terra MODIS (MOD11C1) and Aqua MODIS (MYD11C1). They used the data to calculate heating, cooling, and growing degree days (GDD), a useful measurement for understanding plant growth rates. They calibrated the data using the Climate Reference Network to determine the temperature trend for a single year from the overall trend of the last few decades.
These data can help the agriculture sector observe the temperature threshold days for growing crops and can help the energy sector with predicting when the surrounding community may increase the demand for electricity or gas for heating or cooling. Maps from this project provide the ability to observe monthly GDD more efficiently and at a better spatial resolution than data that are currently collected from an in situ network. An example map of GDD for onions for the month of August is shown on the right. A goal of this project is that NOAA’s Northeast Region Climate Services Directorate and Climate Monitoring Branch will distribute these maps to various energy and agriculture industries throughout the region to help the area plan for future agricultural and energy needs.
Watch this video created by the Northeast US Cross-Cutting Team to learn more about their project and how they used NASA Earth science remote sensing data.
About the NASA DEVELOP National Program
The DEVELOP National Program is part of NASA’s Applied Sciences Program. Participants from around the country join the DEVELOP program for 10-week terms to apply data acquired by NASA Earth-observing satellites to bridge the gap between science and society. DEVELOP participants work with local, state, and federal partners to create maps and other products in eight focus areas, including Agriculture & Food Security, Disasters, Ecological Forecasting, Energy, Health and Air Quality, Urban Development, Water Resources, and Transportation & Infrastructure.
Any use of trade, firm, or product names is for descriptive purposes only and does not imply endorsement by the U.S. Government.
References:
Northeast US Cross-Cutting Team, NASA DEVELOP National Program, 2017, Northeast US Cross-Cutting - NASA DEVELOP Fall 2017 @ NC, accessed November 30, 2017, at https://youtu.be/bpstxE3zegI.
Yang, L., Mahoney, L., and Hurley, S., 2017, A mountain of data, can we climate?, accessed November 30, 2017, at https://develop.larc.nasa.gov/2017/fall/NortheastUSCC.html.
Written by: Danielle Golon1, Lilian Yang2, Laurel Mahoney2, Shannan Hurley2, Amanda Clayton4
1 Innovate!, Inc., contractor to the U.S. Geological Survey, Earth Resources Observation and Science (EROS) Center, Sioux Falls, South Dakota, USA. Work performed under USGS contract G15PD00467 for LP DAAC2.
2 LP DAAC Work performed under NASA contract NNG14HH33I.
3NASA DEVELOP Northeast US Cross-Cutting Team, North Carolina NOAA’s National Centers for Environmental Information.
4 SSAI, NASA DEVELOP National Program, Langley Research Center, Hampton, Virginia, USA.