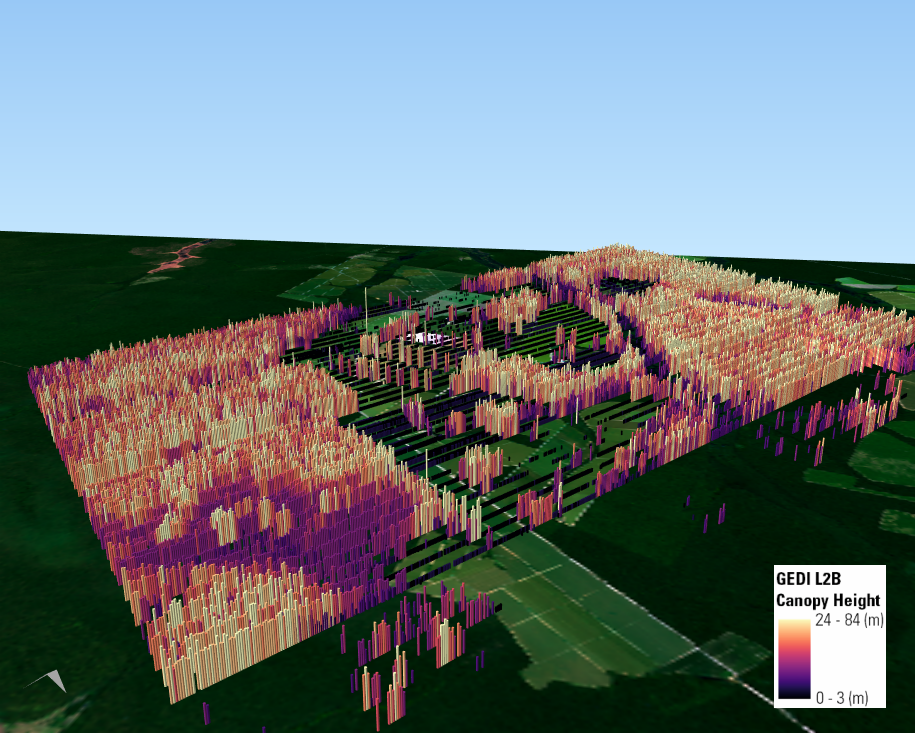
Composite of GEDI L2B Canopy Top Height (rh100) 25 m footprints acquired between April 18, 2019 through April 15, 2020 near Xingu Indigenous Park, Mato Grosso, Brazil. Higher canopy top heights are shown in lighter and brighter shades of tan. Lower canopy heights are shown in darker shades of purple. Each GEDI footprint is shown in 3D using the GEDI-retrieved Canopy Top Height. Notice the dramatic contrasts between the intact forests on the left and right sides of the area, which reach over 24 m high (78 ft), vs. deforested areas in the middle, where canopy heights are generally 0-3 m. Also shown is an HLS 30-meter Landsat 8 OLI surface reflectance natural color composite from May 5 and May 12, 2021.
See Data Citations section below for a list of granules and dataset citations for all data used to generate this three-dimensional image.
Mapping forests and change to forests over time are important applications for optical remote sensing. One paper published in Science by Hansen and others (2013) that used Landsat data to map global forest extent and change (gain/loss) from 2000 to 2012 has been cited almost 6,900 times! The study found that 2.3 million square kilometers (km2) (888,000 mi2) of forest were lost in that 12-year period, with 0.8 million km2 (308,000 mi2) gained. Tree cover loss is driven by factors like urbanization, commodity-driven deforestation, conversion to agriculture, forestry, and wildfires. From 2001 to 2020, the world lost 10% (4.1 million km2 or 1.6 million mi2) of its forests—roughly equal to the combined area of the U.S. states of AK, TX, CA, MT, NM, AZ, and NV. Brazil, home of the Amazon Rainforest, lost 12% (598,000 km2 or 230,000 mi2) of its tree cover during that same time frame, an area about the size of Ukraine. The Brazilian state of Mato Grosso alone accounted for 121,000 km2 (47,000 mi2, or the size of the U.S. state of PA) of tree cover loss.
The importance of ecosystem services provided by forests is also well-documented (ex: Foley and others (2005)—cited almost 11,000 times!). Forests serve to regulate local and global climate, offer refuge for habitat and enhance biodiversity richness, and have profound impacts on global water and carbon cycles. Tree canopy height can give scientists an indication of the amount of carbon that is being stored or lost in an area. This information is crucial to understanding the impacts of forest cover change on global carbon and water cycles, as well as predicting the resultant changes in global climate.
Optical remote sensing alone can provide global-scale forest change monitoring, but scientists need another critical piece of information to create an accurate inventory of the carbon stored in global forests: high resolution, three-dimensional (3D) measurements of the Earth’s forest structure—data that answers the question “how tall is the forest?”
NASA’s GEDI, or the Global Ecosystem Dynamics Investigation, is a mission meant to provide just that. GEDI produces high-resolution laser altimeter ranging observations of the 3D structure of the Earth between ~51.6° north and 51.6° south latitudes. The global measurements will enable scientists to address critical questions on how changes to the Earth’s tropical and temperate forests impact biodiversity and global carbon and water cycles.
GEDI captures full waveform light detection and ranging (lidar) data that are processed into the Level 1B Geolocated Waveform (GEDI01_B.002) product. The geolocated waveforms are then used to generate Level 2A Elevation and Height Metrics (GEDI02_A.002) and Level 2B Canopy Cover and Vertical Profile Metrics (GEDI02_B.002) as footprint-level data products. NASA’s Land Processes Distributed Active Archive Center (LP DAAC) distributes the GEDI L1-L2 products. The footprint-level canopy height and ground elevation data from the L2 products are used to generate the GEDI Level 3 Gridded Land Surface Metrics product (GEDI03). The L2 data are also being used to create GEDI Level 4 footprint level and gridded above-ground biomass products, which will be made available later in calendar year 2021. The Oak Ridge National Laboratory DAAC archives and distributes GEDI L3-L4 data products. GEDI data is helping scientists to understand how forest cover change impacts atmospheric CO2 concentrations, and to quantify the amount of carbon forests store now and into the future.
Below are images showing GEDI L2B data from 30 GEDI Version 2 sub-orbit granules, acquired between April 18, 2019 and April 15, 2020 over Xingu Indigenous Park in Brazil. The park lies at the southern edge of the Amazon Rainforest in the state of Mato Grosso. The national park was created in the 1960s to protect the environment and the way of life of the area’s indigenous peoples. The protected area covers around 26,400 km2 (10,200 mi2) of land straddling the Xingu River basin, stretching from pristine Amazonian Rainforest in the north to drier, semi-deciduous forest in the south. Notice the stark contrast between the intact forest within the park’s boundaries and the patchwork of deforested areas outside it, as observed by GEDI.
The base map in these images was created from the recently released provisional Harmonized Landsat Sentinel-2 (HLS) Landsat 30 (HLSL30) product, available from the LP DAAC (a science-ready version of HLS data is scheduled to be released later this year).
The optical HLS natural color RGB image composite from May 2021 gives us a good idea of where the forests are, but its 2D representation doesn’t tell us about forest height. Using GEDI Forest Canopy Height (rh100) (Figure 1), we can estimate the canopy height over currently-forested areas to answer the question “how tall are the forests?” Notice areas with very high canopies in warmer/brighter colors, with some approaching 24 meters (m)—around 80 feet. Areas with lower canopy top height are shown in darker shades of purple. Those areas appear over wetlands, lakes, and the Xingu River within the park, as well as in the deforested areas outside it.
GEDI also includes data on the overall canopy cover for each GEDI footprint (Figure 2), the ground elevation (Figure 3), and vertical metrics such as Plant Area Volume Density (PAVD). The image above and to the right shows the GEDI-retrieved tree canopy height in 3D, giving a glimpse into the landscape’s physical (3D) structure. In the future, users could identify deforestation using HLS 2D optical imagery, then estimate above-ground biomass loss using GEDI Level 4 above-ground biomass estimates. This information is crucial to providing an accurate inventory of global carbon storage and fluxes. Additionally, researchers are already working to integrate GEDI and Landsat data to create global maps of forest height at 30 m resolution, which will allow for even better estimations of forest change-related carbon inventories and help scientists quantify the effectiveness of forest restoration efforts. One day, scientists will not only be able to tell you if the forest is with you, but also how tall the forest is.
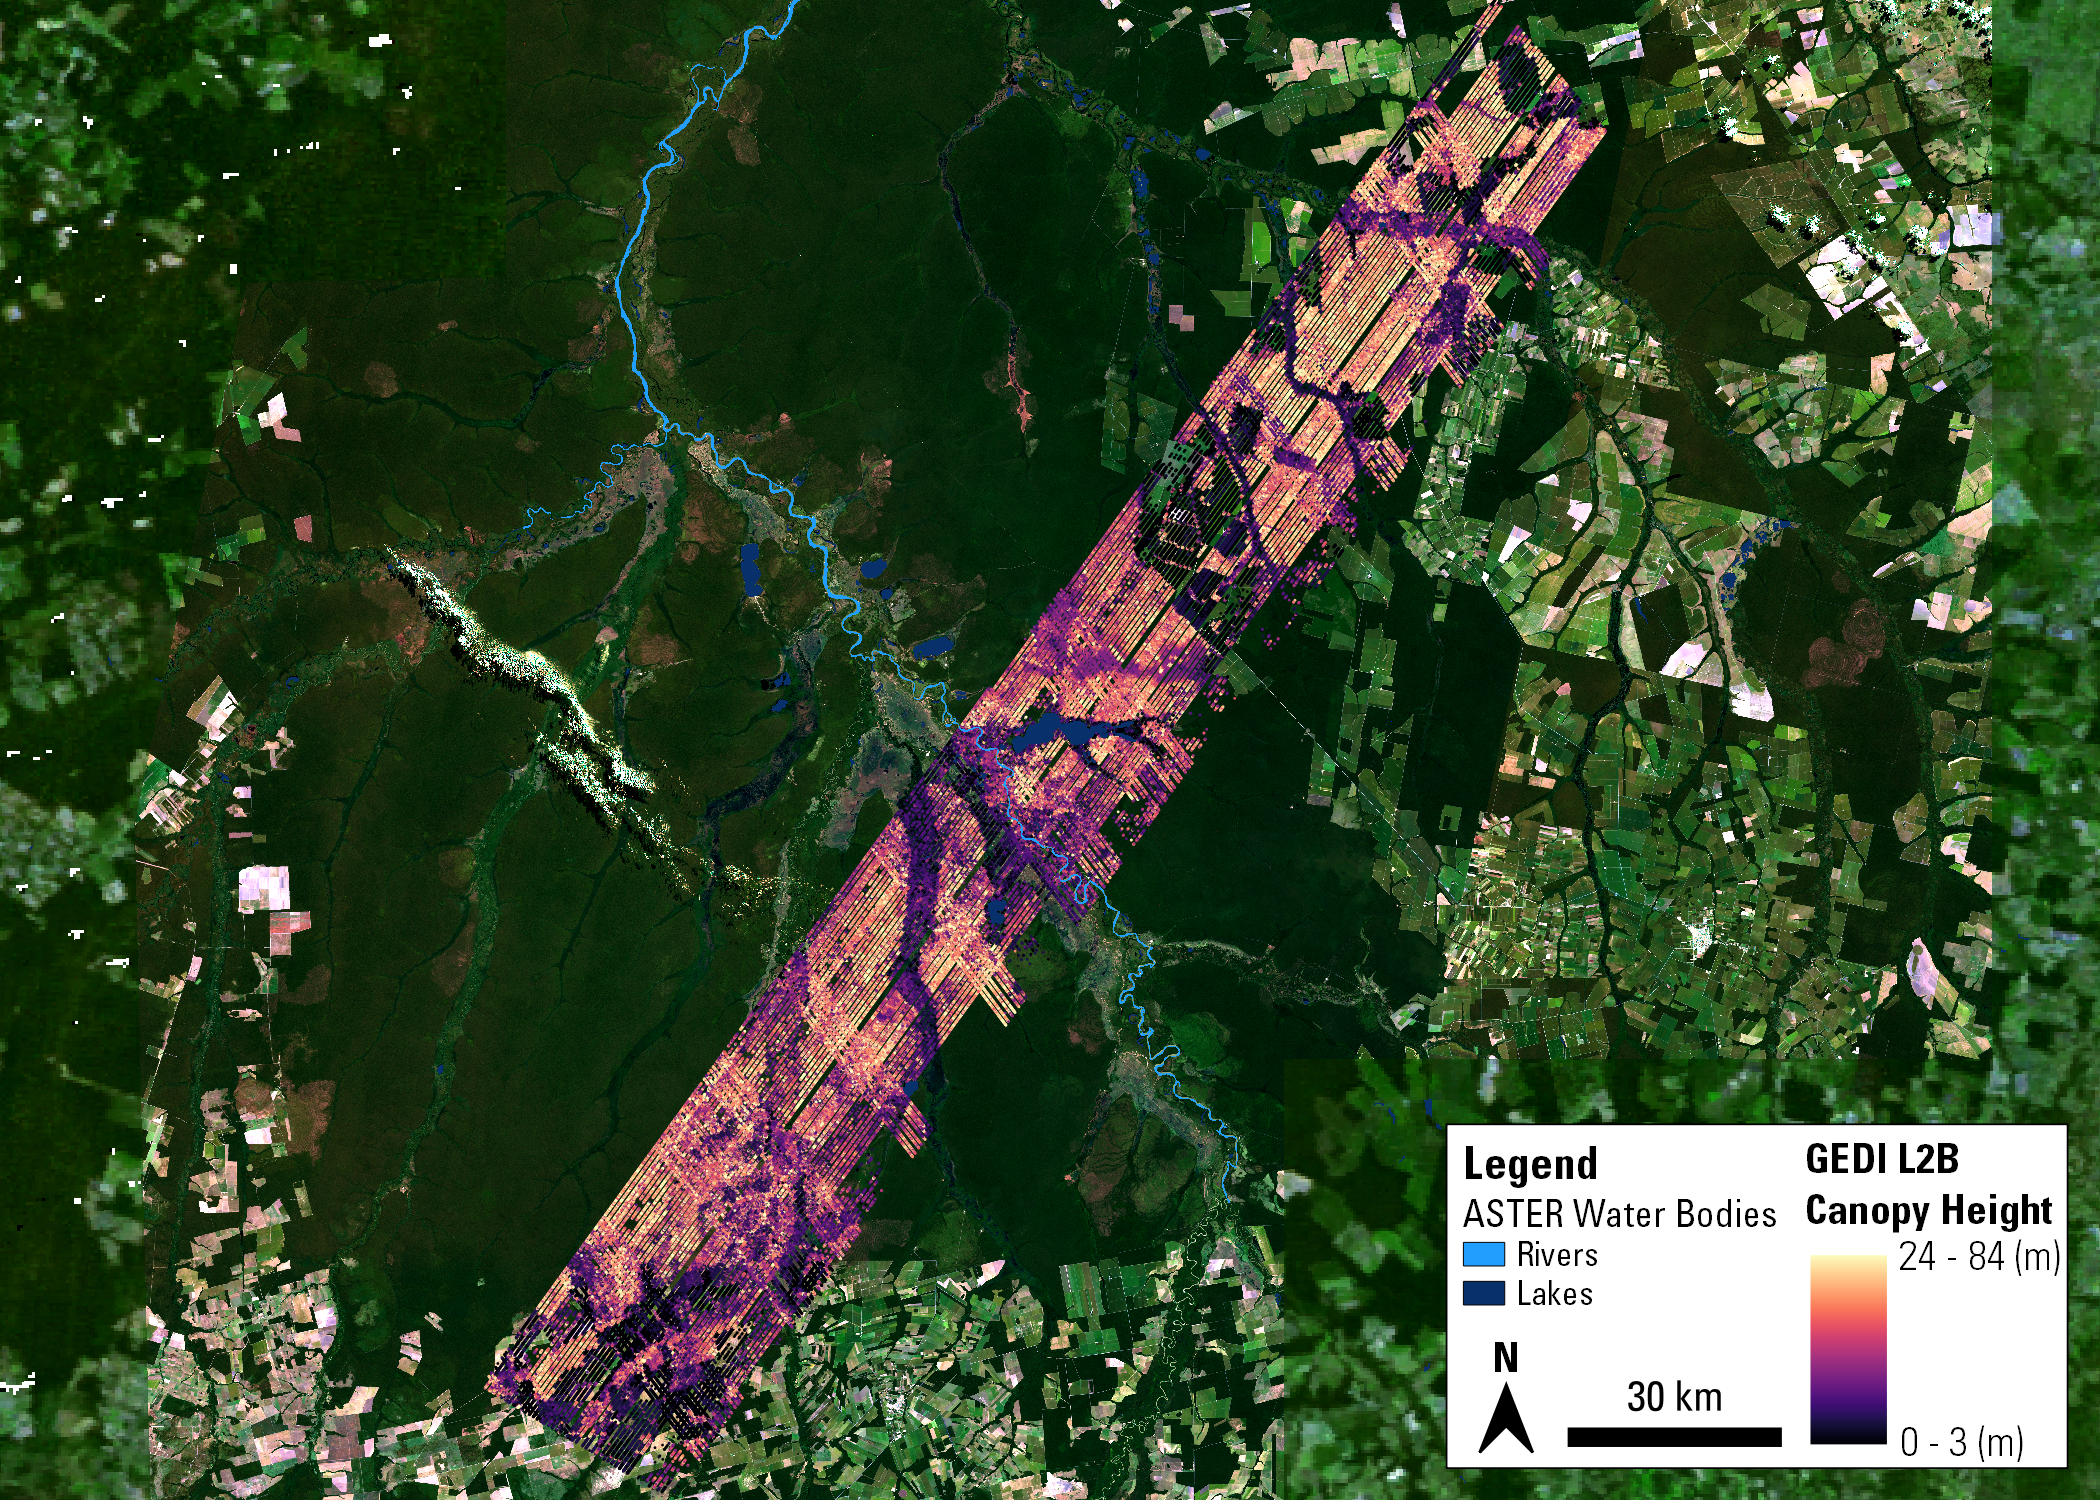
Figure 1: Composite of GEDI L2B Canopy Top Height (rh100) 25 m footprints acquired between April 18, 2019 and April 15, 2020 over Xingu Indigenous Park, Mato Grosso, Brazil. Higher canopy top heights are shown in lighter and brighter shades of tan, and lower canopy heights are shown in darker shades of purple. Notice the lower canopy height values over wetlands, lakes, and the Xingu River inside of the park, and in deforested areas outside of the park. Also shown are the ASTER Global Water Bodies Database 30 m water body attributes data and an HLS 30-meter Landsat 8 OLI surface reflectance natural color composite from May 5 and May 12, 2021.
See Data Citations section below for a list of granules and dataset citations for all data used to generate this three-dimensional image.

Figure 2: Composite of GEDI L2B Total Canopy Cover (cover) 25 m footprints acquired between April 18, 2019 and April 15, 2020 over Xingu Indigenous Park, Mato Grosso, Brazil. Footprints where higher portions of the ground are covered by canopy are shown in dark shades of green, and lower canopy cover is shown in white. Notice the lower canopy height values over wetlands, lakes, and the Xingu River inside of the park, and in deforested areas outside of the park. Also shown are the ASTER Global Water Bodies Database 30 m water body attributes data and an HLS 30-meter Landsat 8 OLI surface reflectance natural color composite from May 5 and May 12, 2021.
See Data Citations section below for a list of granules and dataset citations for all data used to generate this three-dimensional image.

Figure 3: Composite of GEDI L2B Ground Elevation (elev_lowestmode) 25 m footprints acquired between April 18, 2019 and April 15, 2020 over Xingu Indigenous Park, Mato Grosso, Brazil. Notice the higher elevations in white-grey outside of the park, and lower elevations recorded over wetlands, lakes, and rivers in shades of green-cyan. Also shown are the ASTER Global Water Bodies Database 30 m water body attributes data and an HLS 30-meter Landsat 8 OLI surface reflectance natural color composite from May 5 and May 12, 2021.
See Data Citations section below for a list of granules and dataset citations for all data used to generate this three-dimensional image.
Figure 1: Composite of GEDI L2B Canopy Top Height (rh100) 25 m footprints acquired between April 18, 2019 and April 15, 2020 over Xingu Indigenous Park, Mato Grosso, Brazil. Higher canopy top heights are shown in lighter and brighter shades of tan, and lower canopy heights are shown in darker shades of purple. Notice the lower canopy height values over wetlands, lakes, and the Xingu River inside of the park, and in deforested areas outside of the park. Also shown are the ASTER Global Water Bodies Database 30 m water body attributes data and an HLS 30-meter Landsat 8 OLI surface reflectance natural color composite from May 5 and May 12, 2021.
See Data Citations section below for a list of granules and dataset citations for all data used to generate this three-dimensional image.
Figure 2: Composite of GEDI L2B Total Canopy Cover (cover) 25 m footprints acquired between April 18, 2019 and April 15, 2020 over Xingu Indigenous Park, Mato Grosso, Brazil. Footprints where higher portions of the ground are covered by canopy are shown in dark shades of green, and lower canopy cover is shown in white. Notice the lower canopy height values over wetlands, lakes, and the Xingu River inside of the park, and in deforested areas outside of the park. Also shown are the ASTER Global Water Bodies Database 30 m water body attributes data and an HLS 30-meter Landsat 8 OLI surface reflectance natural color composite from May 5 and May 12, 2021.
See Data Citations section below for a list of granules and dataset citations for all data used to generate this three-dimensional image.
Figure 3: Composite of GEDI L2B Ground Elevation (elev_lowestmode) 25 m footprints acquired between April 18, 2019 and April 15, 2020 over Xingu Indigenous Park, Mato Grosso, Brazil. Notice the higher elevations in white-grey outside of the park, and lower elevations recorded over wetlands, lakes, and rivers in shades of green-cyan. Also shown are the ASTER Global Water Bodies Database 30 m water body attributes data and an HLS 30-meter Landsat 8 OLI surface reflectance natural color composite from May 5 and May 12, 2021.
See Data Citations section below for a list of granules and dataset citations for all data used to generate this three-dimensional image.

Data Citations
Granule IDs: ASTWBDV001_S14W054, ASTWBDV001_S13W054, ASTWBDV001_S13W053, ASTWBDV001_S12W053,
HLS.L30.T22LCN.2021125T133109.v1.5, HLS.L30.T22LCM.2021125T133133.v1.5, HLS.L30.T22LCN.2021132T133724.v1.5,
HLS.L30.T22LBN.2021132T133724.v1.5, HLS.L30.T22LBM.2021132T133748.v1.5, HLS.L30.T21LZG.2021132T133748.v1.5,
HLS.L30.T22LCM.2021132T133748.v1.5, HLS.L30.T22LBL.2021132T133812.v1.5, HLS.L30.T21LZF.2021132T133812.v1.5,
GEDI02_B_2019103103917_O01888_01_T03639_02_003_01_V002, GEDI02_B_2019107211449_O01957_04_T02637_02_003_01_V002,
GEDI02_B_2019121154951_O02171_04_T03448_02_003_01_V002, GEDI02_B_2019128130705_O02278_04_T00449_02_003_01_V002,
GEDI02_B_2019135102408_O02385_04_T04565_02_003_01_V002, GEDI02_B_2019142074101_O02492_04_T01566_02_003_01_V002,
GEDI02_B_2019167212927_O02889_04_T02025_02_003_01_V002, GEDI02_B_2019174063337_O02988_01_T04909_02_003_01_V002,
GEDI02_B_2019178171438_O03057_04_T04412_02_003_01_V002, GEDI02_B_2019193112046_O03286_04_T04871_02_003_01_V002,
GEDI02_B_2019204070818_O03454_04_T05529_02_003_01_V002, GEDI02_B_2019214143319_O03614_01_T02216_02_003_01_V002,
GEDI02_B_2019219011510_O03683_04_T00143_02_003_01_V002, GEDI02_B_2019222233442_O03744_04_T05483_02_003_01_V002,
GEDI02_B_2019233192537_O03912_04_T02836_02_003_01_V002, GEDI02_B_2019241160930_O04034_04_T04060_02_003_01_V002,
GEDI02_B_2019248011823_O04133_01_T03486_02_003_01_V002, GEDI02_B_2019256102424_O04263_04_T04718_02_003_01_V002,
GEDI02_B_2019260084659_O04324_04_T05330_02_003_01_V002, GEDI02_B_2019270162043_O04484_01_T00640_02_003_01_V002,
GEDI02_B_2019282235147_O04675_04_T02178_02_003_01_V002, GEDI02_B_2019301163222_O04965_04_T01260_02_003_01_V002,
GEDI02_B_2019319205129_O05247_01_T05062_02_003_01_V002, GEDI02_B_2019328060047_O05377_04_T05682_02_003_01_V002,
GEDI02_B_2019336024706_O05499_04_T03754_02_003_01_V002, GEDI02_B_2020035125448_O06498_01_T00793_02_003_01_V002,
GEDI02_B_2020051064034_O06742_01_T05368_02_003_01_V002, GEDI02_B_2020094133316_O07413_01_T05062_02_003_01_V002,
GEDI02_B_2020129233455_O07962_01_T04909_02_003_01_V002, GEDI02_B_2020133220037_O08023_01_T02216_02_003_01_V002
Dubayah, R., Tang, H., Armston, J., Luthcke, S., Hofton, M., and Blair, J., 2021, GEDI L2B Canopy Cover and Vertical Profile Metrics Data Global Footprint Level V002 dataset: NASA EOSDIS Land Processes DAAC, accessed May 14, 2021, at https://doi.org/10.5067/GEDI/GEDI02_B.002.
Masek, J., Ju, J., Roger, J., Skakun, S., Vermote, E., Claverie, M., Dungan, J., Yin, Z., Freitag, B., and Justice, C., 2021, HLS Landsat-8 OLI Surface Reflectance and TOA Brightness Daily Global 30 m V1.5 dataset: NASA EOSDIS Land Processes DAAC, accessed May 14, 2021 at https://doi.org/10.5067/HLS/HLSL30.015.
NASA/METI/AIST/Japan Spacesystems and U.S./Japan ASTER Science Team, 2019, ASTER Global Water Bodies Database Attributes NetCDF V001 dataset: NASA EOSDIS Land Processes DAAC, accessed May 13, 2021, at https://doi.org/10.5067/ASTER/ASTWBD_ATTNC.001.
References
(Author's Note 2/28/2022: At the time of publishing these references were available online, some resources may no longer be available.)
Dubayah, R., Luthcke, S., Blair, J., Hofton, M., Armston, J., and Tang, H., 2021, GEDI L1B Geolocated Waveform Data Global Footprint Level V002 dataset: NASA EOSDIS Land Processes DAAC, accessed May 18, 2021, at https://doi.org/10.5067/GEDI/GEDI01_B.002.
Dubayah, R., Hofton, M., Blair, J., Armston, J., Tang, H., and Luthcke, S., 2021, GEDI L2A Elevation and Height Metrics Data Global Footprint Level V002 dataset: NASA EOSDIS Land Processes DAAC, accessed May 18, 2021, at https://doi.org/10.5067/GEDI/GEDI02_A.002.
Dubayah, R., Tang, H., Armston, J., Luthcke, S., Hofton, M., and Blair, J., 2021, GEDI L2B Canopy Cover and Vertical Profile Metrics Data Global Footprint Level V002 dataset: NASA EOSDIS Land Processes DAAC, accessed May 18, 2021 at https://doi.org/10.5067/GEDI/GEDI02_B.002.
Dubayah, R.O., Luthcke, S.B., Sabaka, T.J., Nicholas, J.B., Preaux, S., and Hofton, M.A., 2021, GEDI L3 Gridded Land Surface Metrics, Version 1 dataset: ORNL DAAC, at https://doi.org/10.3334/ORNLDAAC/1865.
Foley, J.A., DeFries, R., Asner, G.P., Barford, C., Bonan, G., Carpenter, S.R., Chapin, F.S., Coe, M.T., Daily, G.C., Gibbs, H.K., Helkowski, J.H., Holloway, T., Howard, E.A., Kucharik, C.J., Monfreda, C., Patz, J.A., Prentice, I.C., Ramankutty, N., and Snyder, P.K., 2005, Global consequences of land use: Science, v. 309, no. 5734, p. 570 –574, at https://doi.org/10.1126/science.1111772.
Hansen, M.C., Potapov, P.V., Moore, R., Hancher, M., Turubanova, S.A., Tyukavina, A., Thau, D., Stehman, S.V., Goetz, S.J., Loveland, T.R., Kommareddy, A., Egorov, A., Chini, L., Justice, C.O., and Townshend, J., 2013, High-resolution global maps of 21st-century forest cover change: Science, v. 342, no. 6160, p. 850–853, at https://doi.org/10.1126/science.1244693.
NASA and University of Maryland, 2021, GEDI: GEDI Ecosystem Lidar web page, accessed May 12, 2021, at https://gedi.umd.edu/.
Potapov, P., Li, X., Hernandez-Serna, A., Tyukavina, A., Hansen, M.C., Kommareddy, A., Pickens, A., Turubanova, S., Tang, H., Silva, C.E., Armston, J., Dubayah, R., Blair, J.B., and Hofton, M., 2021, Mapping global forest canopy height through integration of GEDI and Landsat data: Remote Sensing of Environment, v. 253, article 112165, at https://doi.org/10.1016/j.rse.2020.112165.
Wikipedia contributors, 2021, Xingu Indigenous Park: Wikipedia, The Free Encyclopedia web page, accessed May 12, 2021, at https://en.wikipedia.org/wiki/Xingu_Indigenous_Park.
Material written by: Cole Krehbiel1
1KBR, Inc. contractor to the U.S. Geological Survey, Earth Resources Observation and Science (EROS) Center, Sioux Falls, South Dakota, USA. Work performed under USGS contract G15PC00012 for the LP DAAC2
2LP DAAC work performed under NASA contract NNG14HH33I.