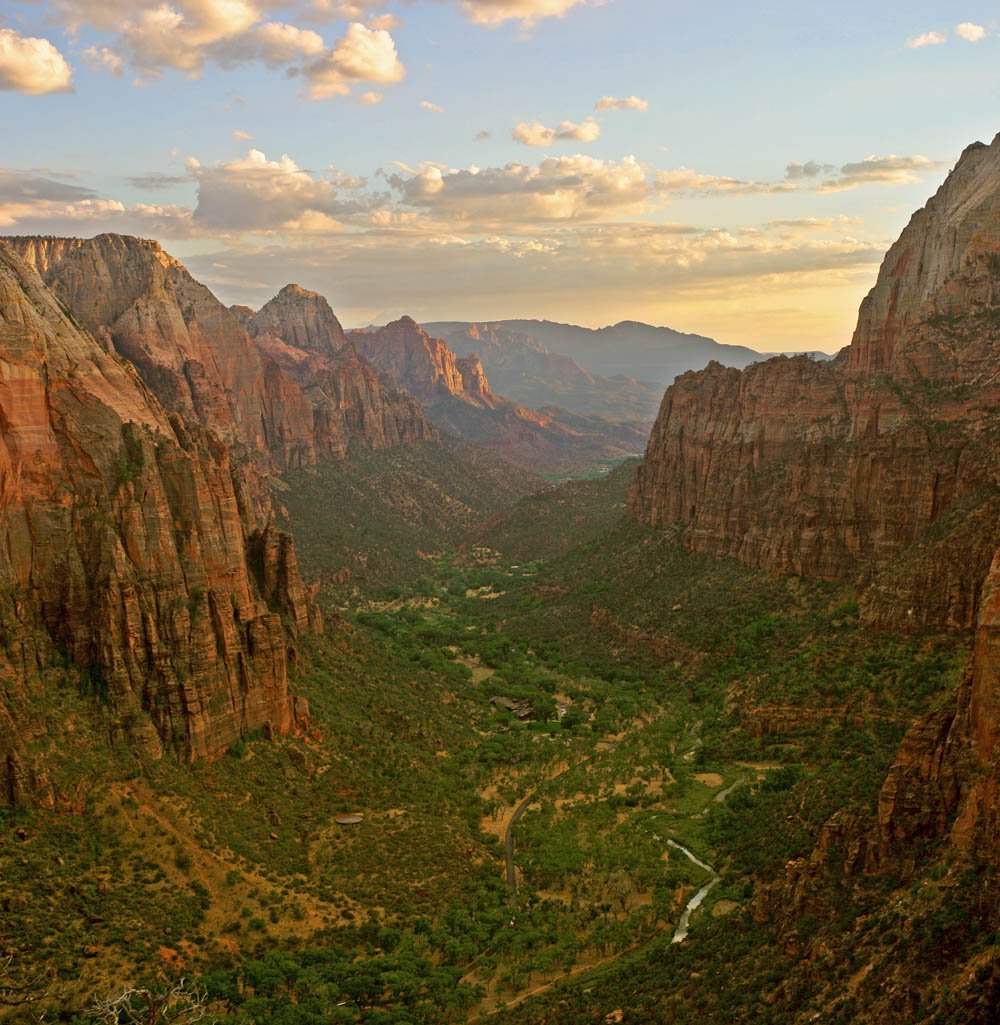
A beautiful sunset at Zion National Park from Angels Landing on September 13, 2004, as captured by one of the park’s millions of visitors. Diliff/CC-BY-SA-3.0
A beautiful sunset at Zion National Park from Angels Landing on September 13, 2004, as captured by one of the park’s millions of visitors. Diliff/CC-BY-SA-3.0
(Author's Note 3/1/2024: At the time of publishing these references were available online, some resources may no longer be available.)
On August 25, 1916, President Woodrow Wilson signed the Organic Act into law, and the United States National Park Service (NPS) was born. In 1916 the National Park System had roughly 325,000 visitors. Now approaching its 100th anniversary, the National Park System receives more than 300 million visitors annually who explore the 84 million acres administered by the NPS. In addition to national parks, the National Park System includes monuments, battlefields, military and historical parks, historic sites, lakes and seashores, recreation areas, scenic rivers and trails, and even the White House. There is a National Park Service unit in each of the 50 states, as well as in Washington D.C., American Samoa, Guam, Puerto Rico, and the U.S. Virgin Islands.
One way that scientists with the NPS work to “preserve unimpaired” the natural resources of the parks is through the Inventory and Monitoring Division. The division monitors key resources to better understand the dynamic conditions and nature of park ecosystems. The goals of the program are to track the overall condition of parks using long-term scientific study; integrate the information into NPS planning, management, and decision making; and share the information with relevant groups. The program splits the park system into 32 regional networks. Many of the networks, including the Northern Colorado Plateau Network (NCPN), use satellite imagery from the Moderate Resolution Imaging Spectroradiometer (MODIS) to monitor land surface phenology and land condition.
The NCPN serves 16 parks across four states, with diverse ecosystems ranging from desert grass, shrub, and woodlands, to forested terrestrial and river systems. Zion National Park in southwestern Utah is the most visited park in the network, with 3.6 million visitors in 2015. The NCPN uses satellite remote sensing data from MODIS to monitor vegetation phenology and condition on the semiarid Colorado Plateau. Below are a series of MODIS Normalized Difference Vegetation Index (NDVI) images beginning in January and ending in June 2016. Click through the images to view the seasonal development or “greening” of vegetation on the arid Northern Colorado Plateau from winter through spring and into summer.
More specifically, the NCPN uses Terra MODIS 250 meter pixel resolution NDVI 16-day composite data (MOD13Q1) to assess short term changes in weather, and the effects of long term climatic conditions on vegetation condition and phenology. One of the ways they do this is by using MODIS NDVI data to estimate the timing of key phenological variables such as the start, peak, and end of the growing season, as well as the seasonal productivity of vegetation in the region. NCPN staff analyze inter-annual comparisons to reveal how changes in precipitation, temperature, climate, or land condition lead to changes in land surface phenology.
One major finding of the project is that soil moisture and evapotranspiration, or the transportation of water from soil through plants and into the atmosphere via photosynthesis, may have a greater impact on the condition of photosynthetically active vegetation than precipitation alone. At a monthly time-step the MODIS NDVI data can also be used to determine the antecedent weather conditions needed to sustain vegetation in disturbed areas that respond differently to weather and climate than native vegetation. At Zion National Park, this type of information can be used to plan for activities that require optimal growing conditions. In parks that allow livestock grazing, it can be used for decisions about grazing management and stocking rates.
All of this information improves understanding of the impacts of long term climate trends, short term weather patterns, land use and land cover change, and other natural events on the status and trends of broad-scale vegetation condition on the semiarid Northern Colorado Plateau. The NPS can use the knowledge gathered from remotely sensed images to help plan, manage, and make important decisions that ensure future generations will be able to enjoy, learn about, and be inspired by the incredible natural resources of the United States National Parks.

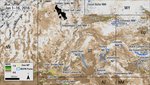
Terra MODIS 250-meter NDVI 16-day composite (MOD13Q1) from January 1–16, 2016, over the Northern Colorado Plateau Network (NCPN). National Parks (NP), National Monuments (NM), National Historic Sites (NHS), and National Recreation Areas (NRA) located in the NCPN are outlined in blue, with Zion National Park highlighted in yellow.
Granule IDs:
MOD13Q1.A2016001.h08v04.006.2016029064219
MOD13Q1.A2016001.h08v05.006.2016029064356
MOD13Q1.A2016001.h09v04.006.2016029064337
MOD13Q1.A2016001.h09v05.006.2016029064349
MOD13Q1.A2016001.h10v04.006.2016029064256
MOD13Q1.A2016001.h10v05.006.2016029064312
DOI: 10.5067/MODIS/MOD13Q1.006

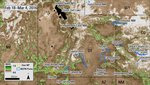
Terra MODIS 250-meter NDVI 16-day composite (MOD13Q1) from February 18–March 4, 2016, over the Northern Colorado Plateau Network (NCPN). National Parks (NP), National Monuments (NM), National Historic Sites (NHS), and National Recreation Areas (NRA) located in the NCPN are outlined in blue, with Zion National Park highlighted in yellow.
Granule IDs:
MOD13Q1.A2016049.h08v04.006.2016109133444
MOD13Q1.A2016049.h08v05.006.2016109133552
MOD13Q1.A2016049.h09v04.006.2016109133529
MOD13Q1.A2016049.h09v05.006.2016109133544
MOD13Q1.A2016049.h10v04.006.2016109133557
MOD13Q1.A2016049.h10v05.006.2016109133545
DOI: 10.5067/MODIS/MOD13Q1.006
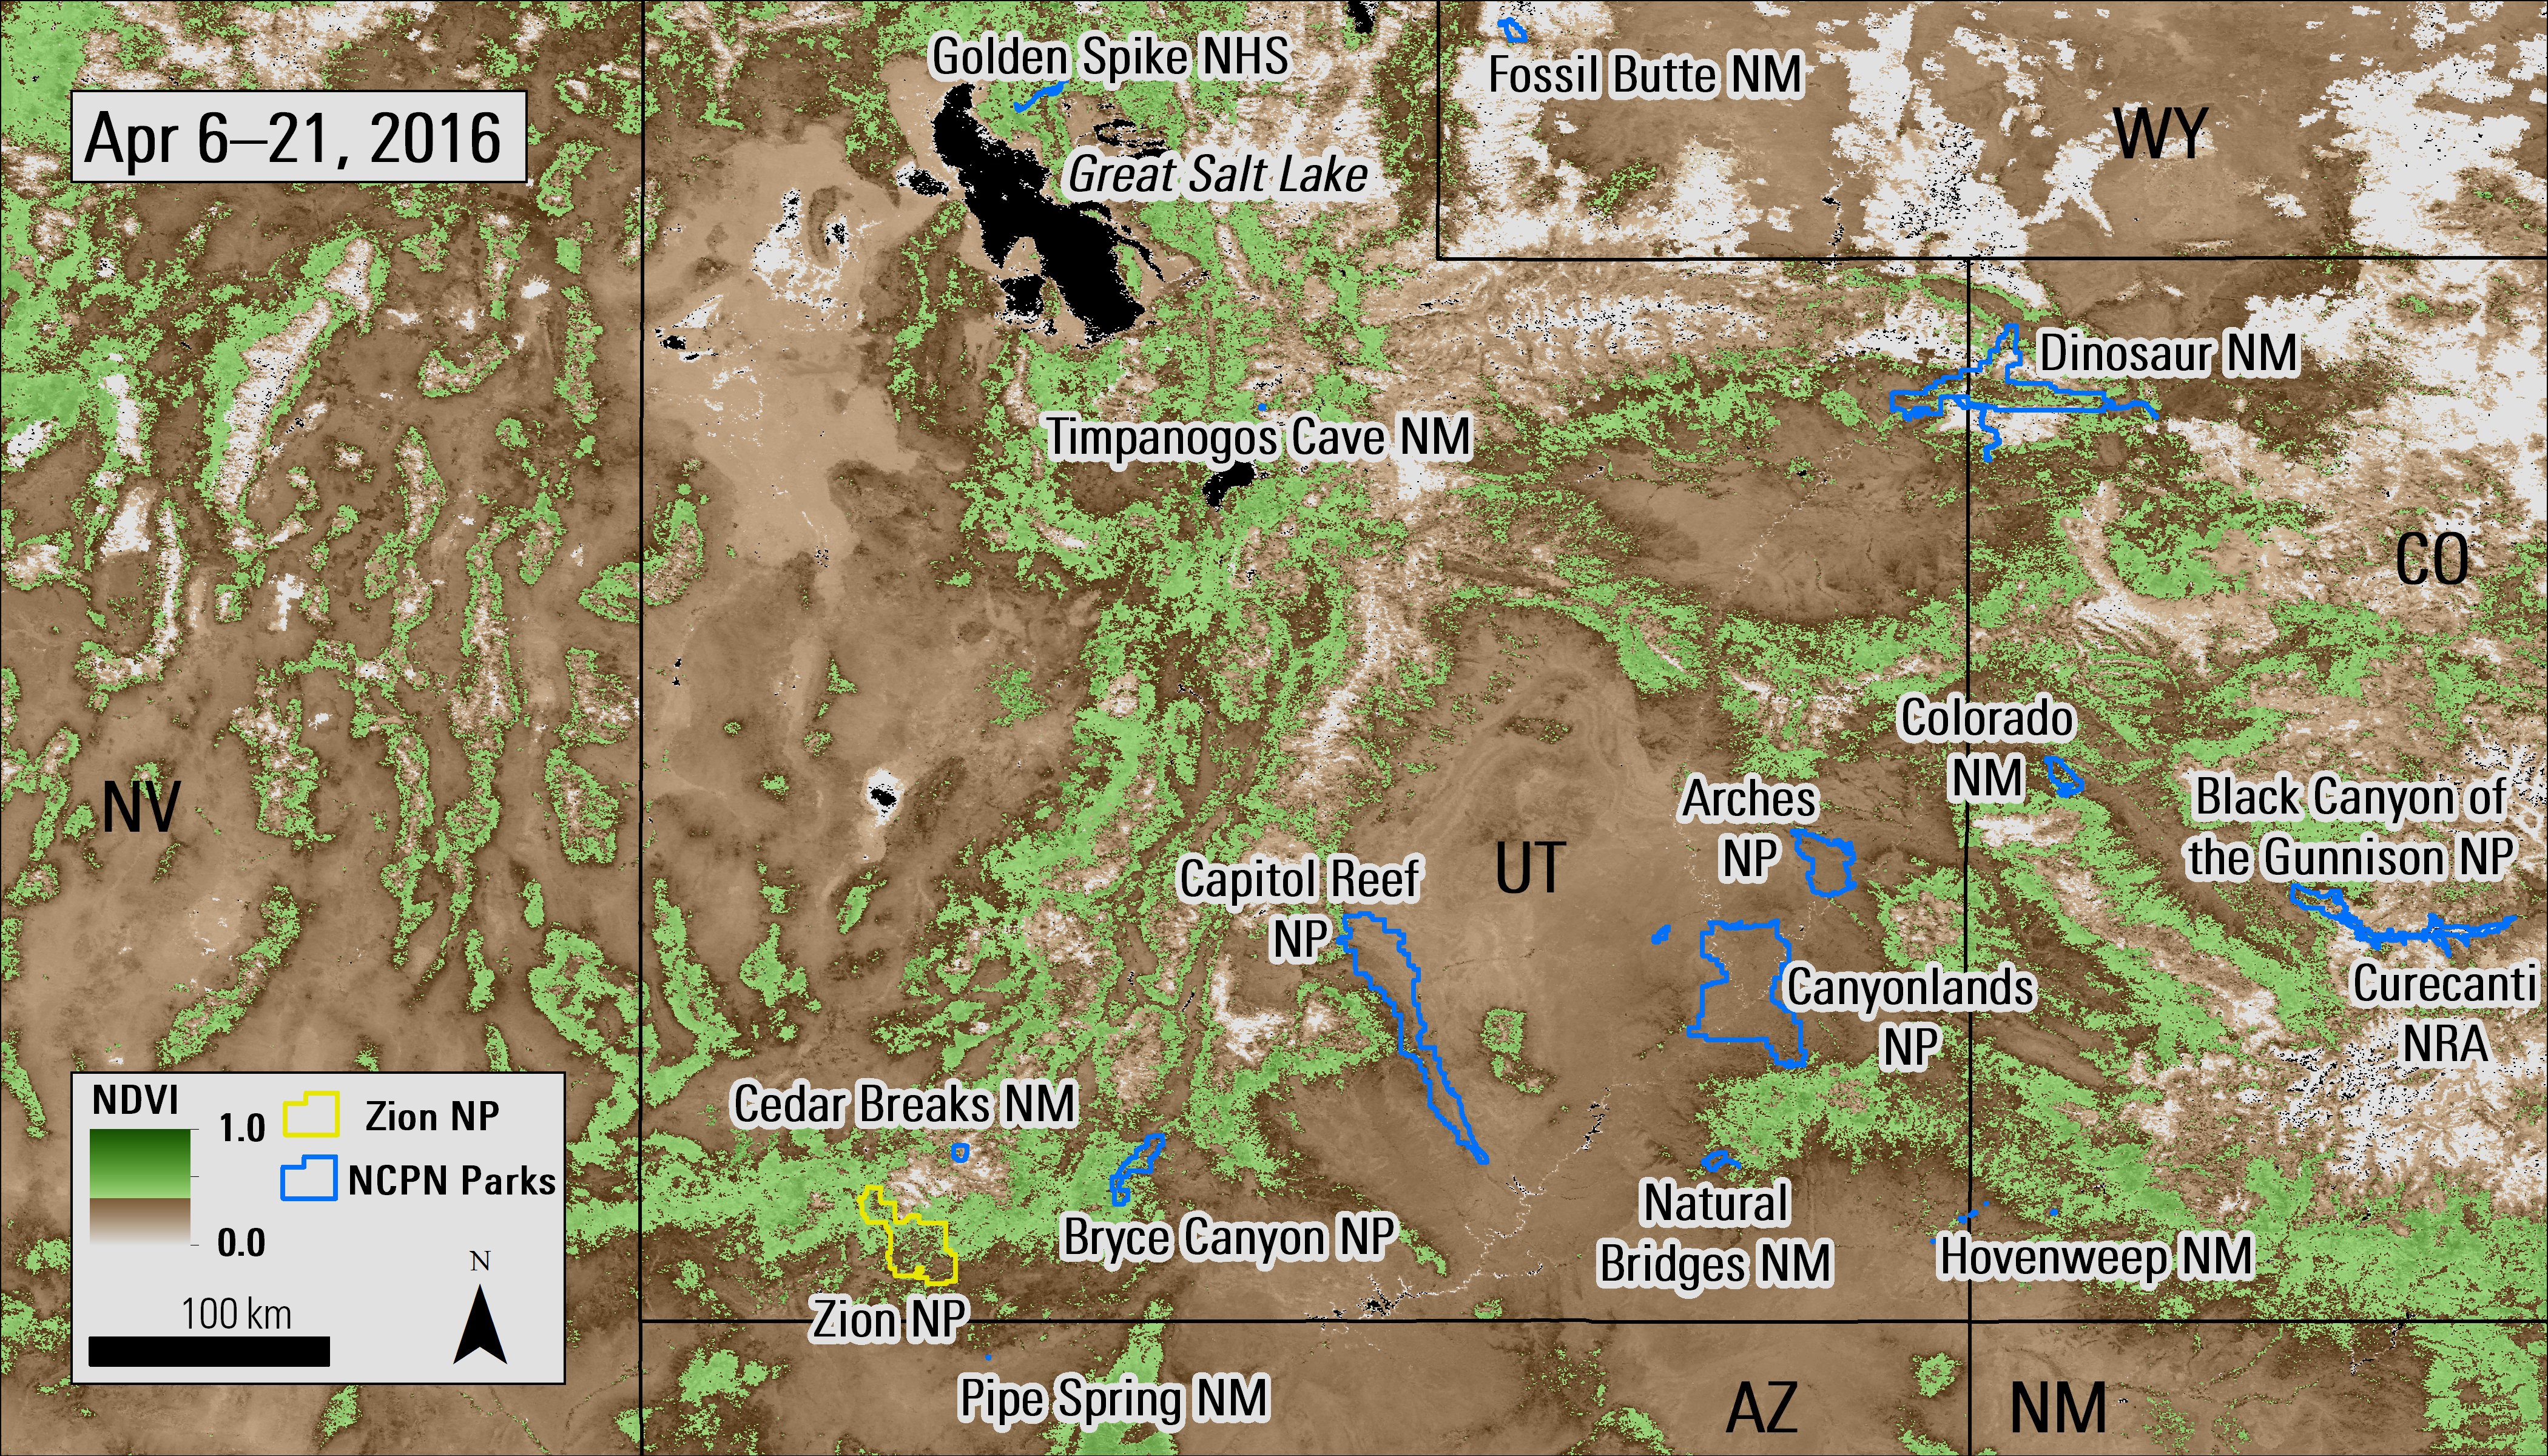
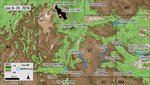
Terra MODIS 250-meter NDVI 16-day composite (MOD13Q1) from April 6–21, 2016, over the Northern Colorado Plateau Network (NCPN). National Parks (NP), National Monuments (NM), National Historic Sites (NHS), and National Recreation Areas (NRA) located in the NCPN are outlined in blue, with Zion National Park highlighted in yellow.
Granule IDs:
MOD13Q1.A2016097.h08v04.006.2016114040827
MOD13Q1.A2016097.h08v05.006.2016114041452
MOD13Q1.A2016097.h09v04.006.2016114041057
MOD13Q1.A2016097.h09v05.006.2016114035956
MOD13Q1.A2016097.h10v04.006.2016114040955
MOD13Q1.A2016097.h10v05.006.2016114040350
DOI: 10.5067/MODIS/MOD13Q1.006
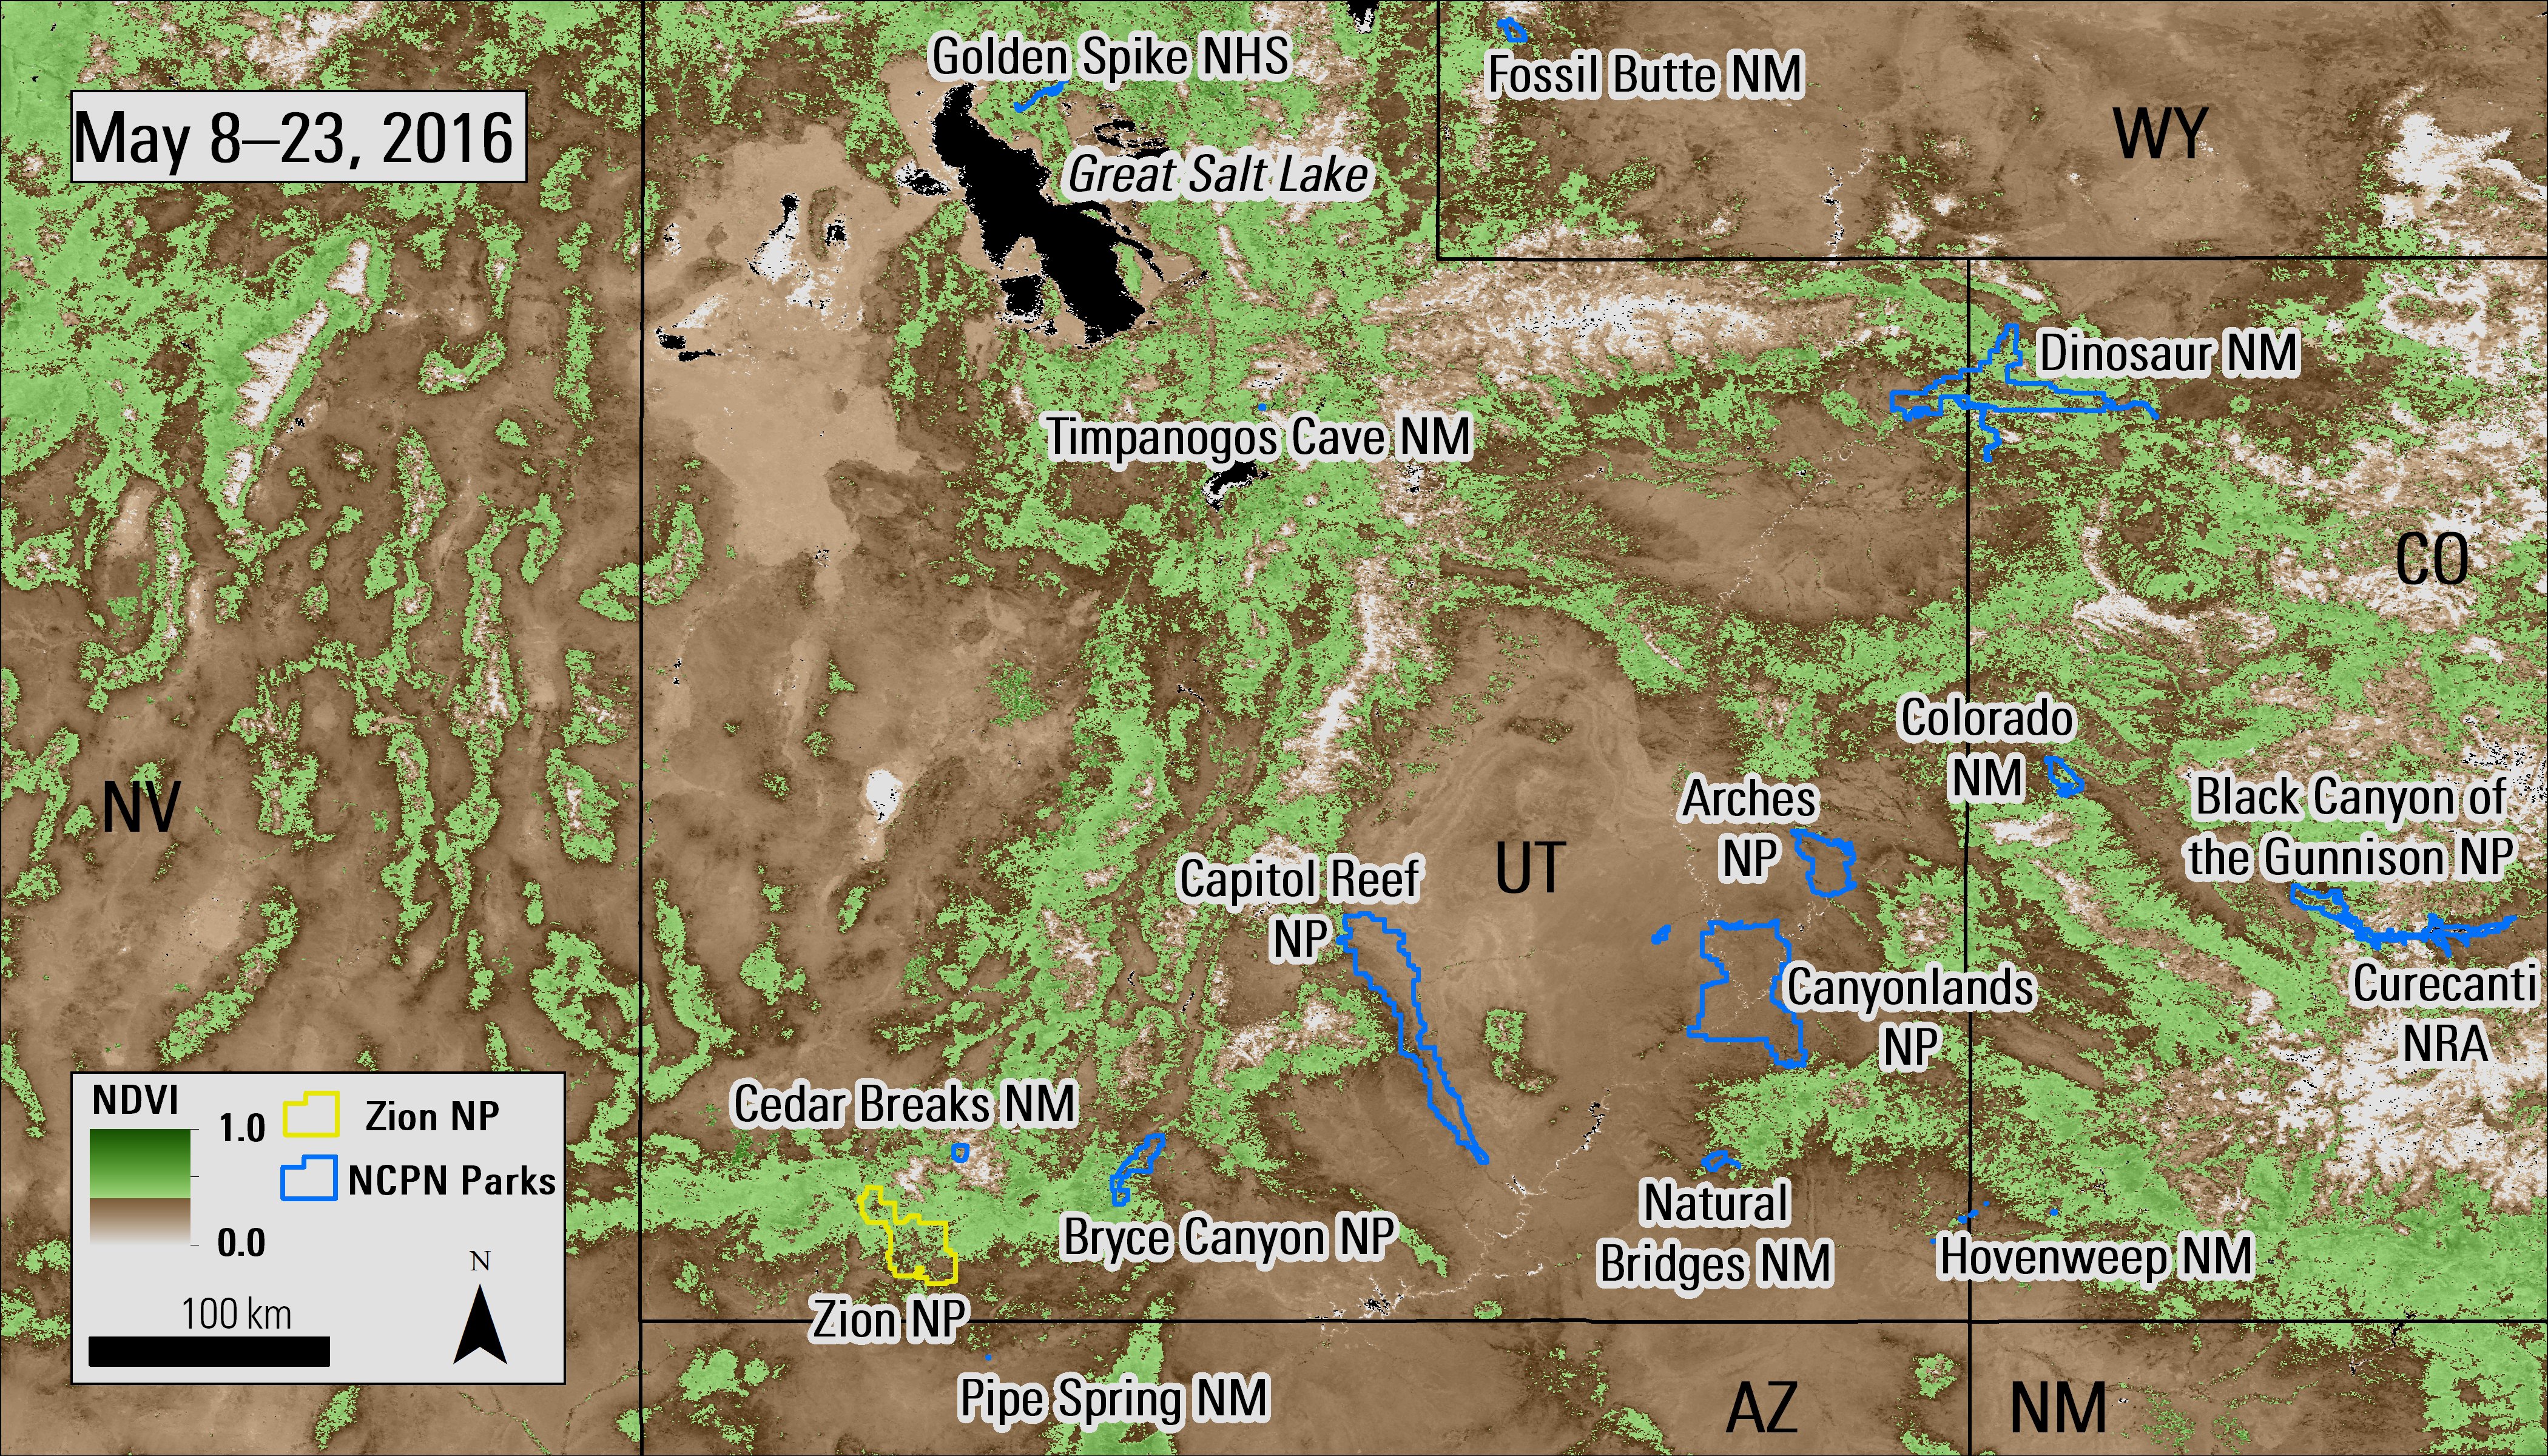
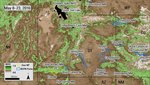
Terra MODIS 250-meter NDVI 16-day composite (MOD13Q1) from May 8–23, 2016, over the Northern Colorado Plateau Network (NCPN). National Parks (NP), National Monuments (NM), National Historic Sites (NHS), and National Recreation Areas (NRA) located in the NCPN are outlined in blue, with Zion National Park highlighted in yellow.
Granule IDs:
MOD13Q1.A2016129.h08v04.006.2016147112728
MOD13Q1.A2016129.h08v05.006.2016147113057
MOD13Q1.A2016129.h09v04.006.2016147113135
MOD13Q1.A2016129.h09v05.006.2016147113226
MOD13Q1.A2016129.h10v04.006.2016147112843
MOD13Q1.A2016129.h10v05.006.2016147112956
DOI: 10.5067/MODIS/MOD13Q1.006
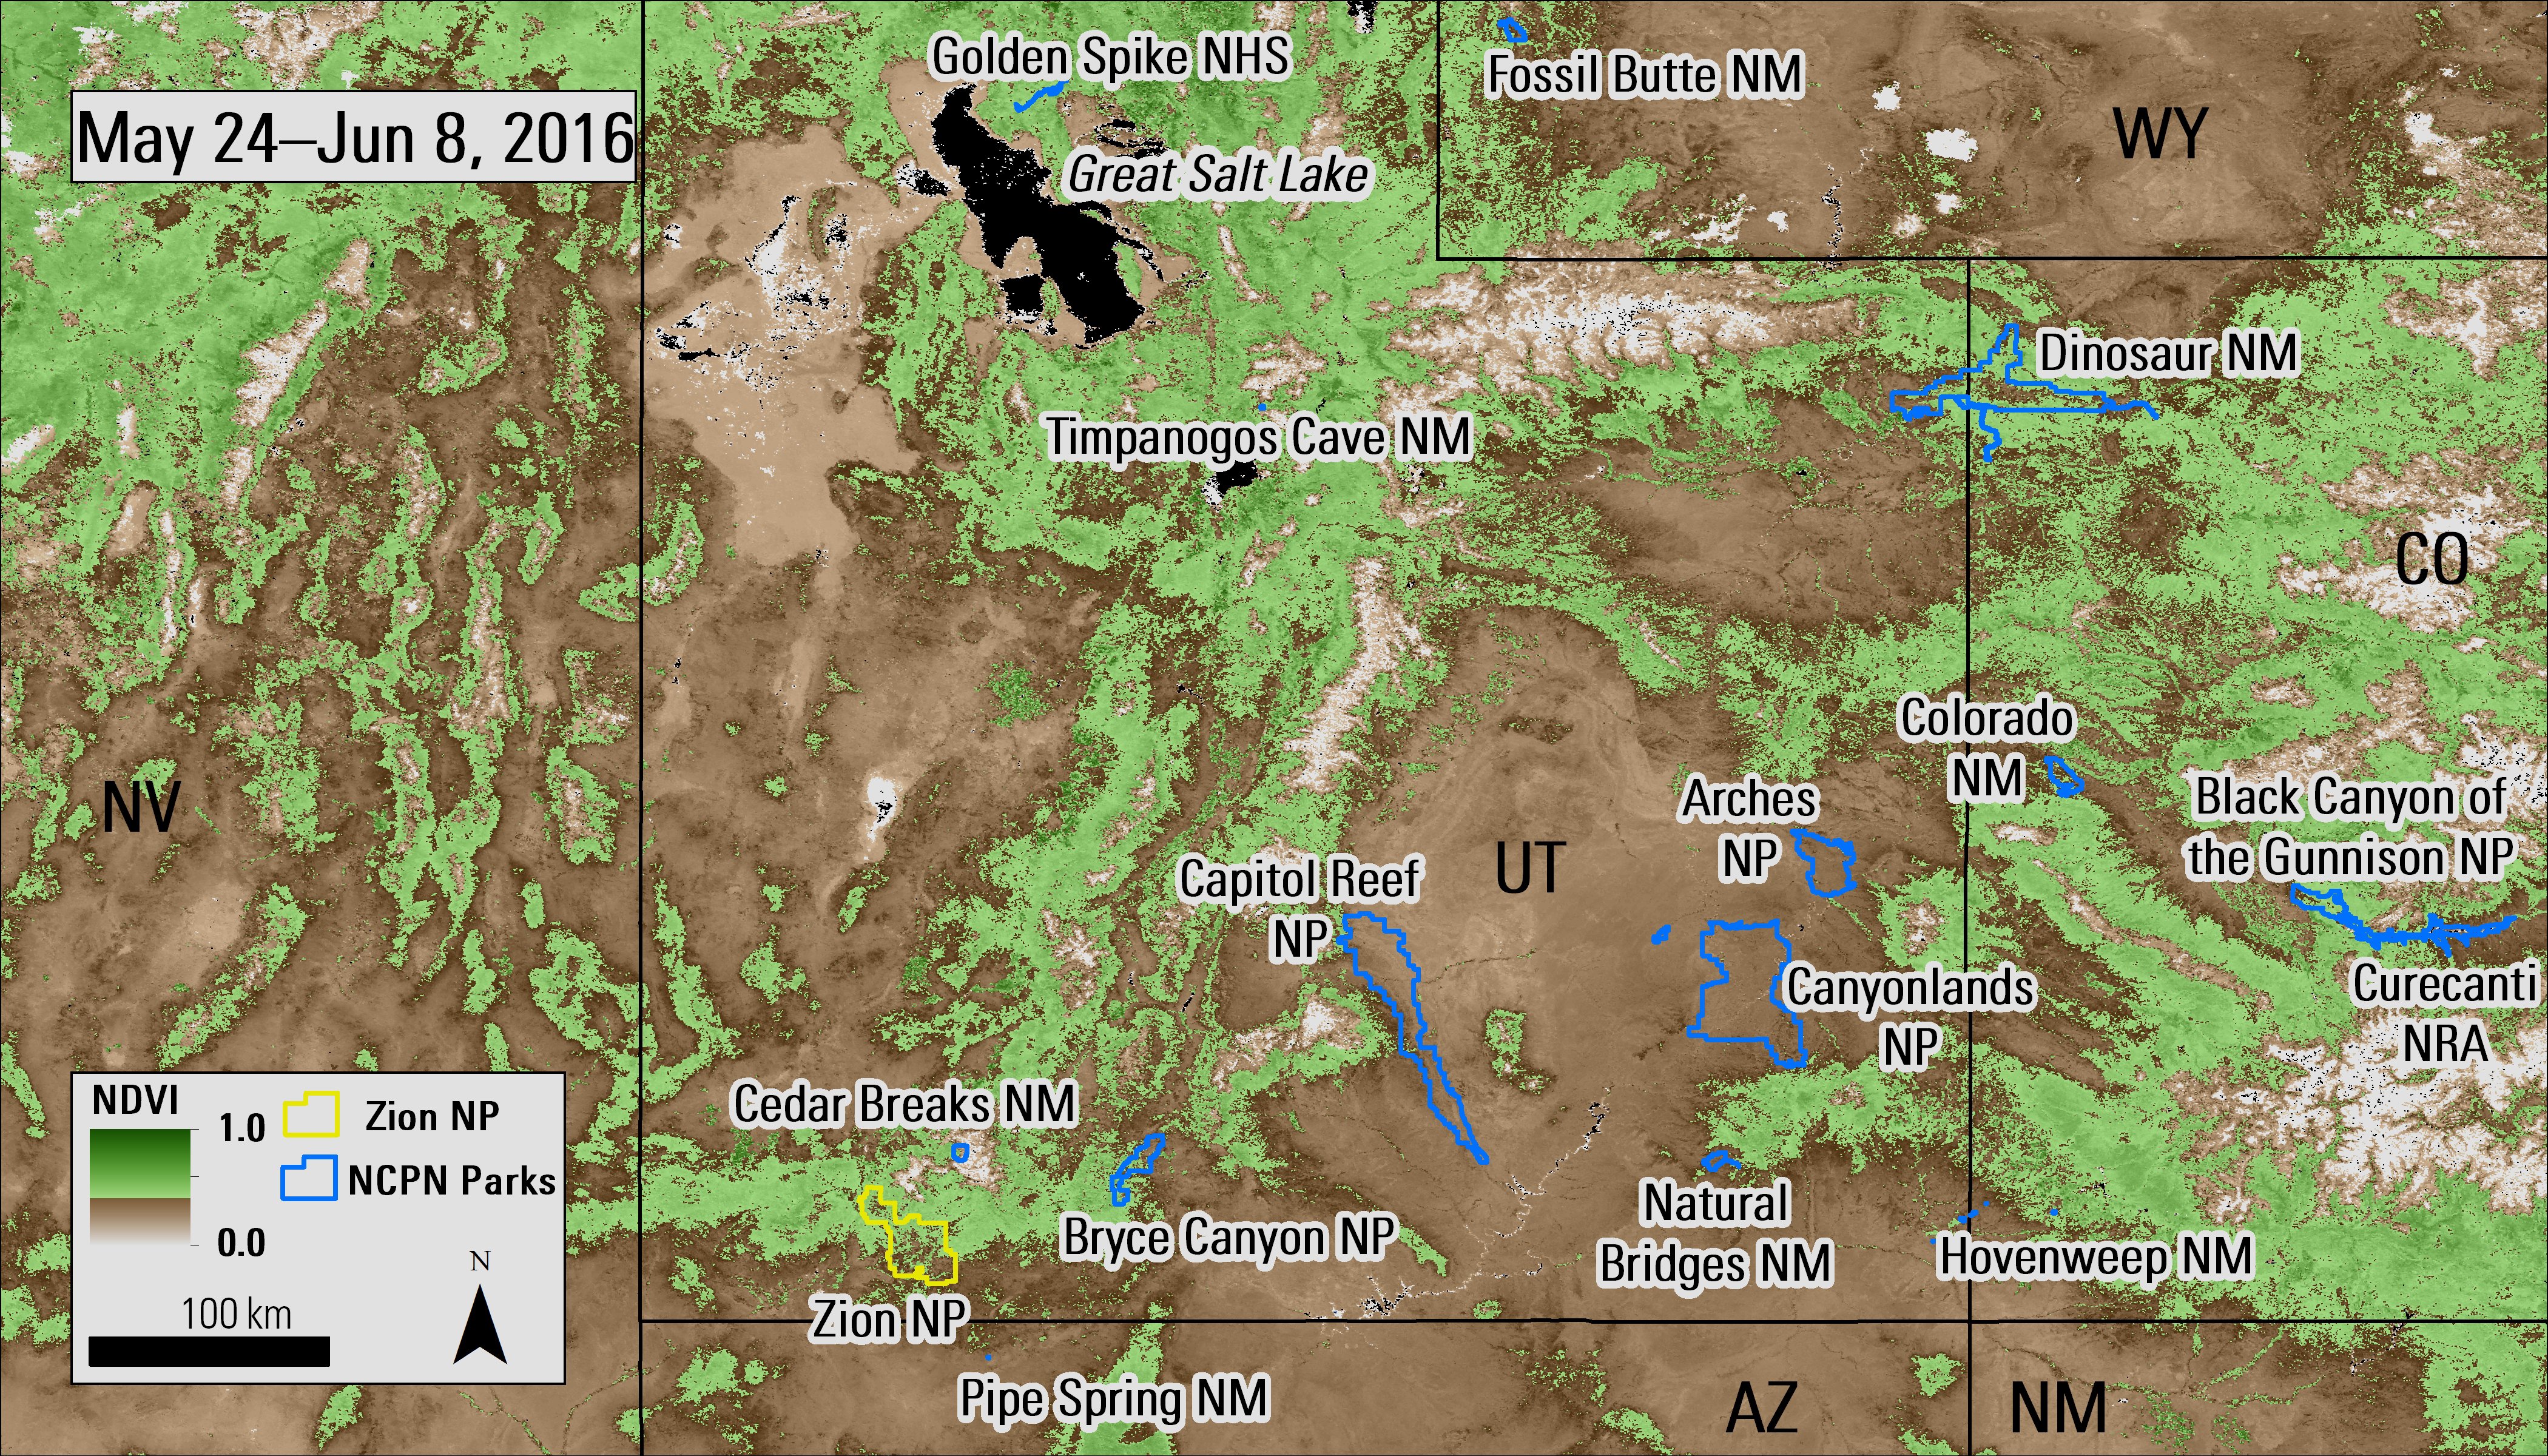
Terra MODIS 250-meter NDVI 16-day composite (MOD13Q1) from May 24–June 8, 2016, over the Northern Colorado Plateau Network (NCPN). National Parks (NP), National Monuments (NM), National Historic Sites (NHS), and National Recreation Areas (NRA) located in the NCPN are outlined in blue, with Zion National Park highlighted in yellow.
Granule IDs:
MOD13Q1.A2016145.h08v04.006.2016166143814
MOD13Q1.A2016145.h08v05.006.2016166143905
MOD13Q1.A2016145.h09v04.006.2016166143918
MOD13Q1.A2016145.h09v05.006.2016166143823
MOD13Q1.A2016145.h10v04.006.2016166143921
MOD13Q1.A2016145.h10v05.006.2016166143911
DOI: 10.5067/MODIS/MOD13Q1.006

Terra MODIS 250-meter NDVI 16-day composite (MOD13Q1) from June 9–24, 2016, over the Northern Colorado Plateau Network (NCPN). National Parks (NP), National Monuments (NM), National Historic Sites (NHS), and National Recreation Areas (NRA) located in the NCPN are outlined in blue, with Zion National Park highlighted in yellow.
Granule IDs:
MOD13Q1.A2016161.h08v04.006.2016184002058
MOD13Q1.A2016161.h08v05.006.2016184011500
MOD13Q1.A2016161.h09v04.006.2016184002026
MOD13Q1.A2016161.h09v05.006.2016183235822
MOD13Q1.A2016161.h10v04.006.2016183235757
MOD13Q1.A2016161.h10v05.006.2016183235846
DOI: 10.5067/MODIS/MOD13Q1.006
Terra MODIS 250-meter NDVI 16-day composite (MOD13Q1) from January 1–16, 2016, over the Northern Colorado Plateau Network (NCPN). National Parks (NP), National Monuments (NM), National Historic Sites (NHS), and National Recreation Areas (NRA) located in the NCPN are outlined in blue, with Zion National Park highlighted in yellow.
Granule IDs:
MOD13Q1.A2016001.h08v04.006.2016029064219
MOD13Q1.A2016001.h08v05.006.2016029064356
MOD13Q1.A2016001.h09v04.006.2016029064337
MOD13Q1.A2016001.h09v05.006.2016029064349
MOD13Q1.A2016001.h10v04.006.2016029064256
MOD13Q1.A2016001.h10v05.006.2016029064312
DOI: 10.5067/MODIS/MOD13Q1.006
Terra MODIS 250-meter NDVI 16-day composite (MOD13Q1) from February 18–March 4, 2016, over the Northern Colorado Plateau Network (NCPN). National Parks (NP), National Monuments (NM), National Historic Sites (NHS), and National Recreation Areas (NRA) located in the NCPN are outlined in blue, with Zion National Park highlighted in yellow.
Granule IDs:
MOD13Q1.A2016049.h08v04.006.2016109133444
MOD13Q1.A2016049.h08v05.006.2016109133552
MOD13Q1.A2016049.h09v04.006.2016109133529
MOD13Q1.A2016049.h09v05.006.2016109133544
MOD13Q1.A2016049.h10v04.006.2016109133557
MOD13Q1.A2016049.h10v05.006.2016109133545
DOI: 10.5067/MODIS/MOD13Q1.006
Terra MODIS 250-meter NDVI 16-day composite (MOD13Q1) from April 6–21, 2016, over the Northern Colorado Plateau Network (NCPN). National Parks (NP), National Monuments (NM), National Historic Sites (NHS), and National Recreation Areas (NRA) located in the NCPN are outlined in blue, with Zion National Park highlighted in yellow.
Granule IDs:
MOD13Q1.A2016097.h08v04.006.2016114040827
MOD13Q1.A2016097.h08v05.006.2016114041452
MOD13Q1.A2016097.h09v04.006.2016114041057
MOD13Q1.A2016097.h09v05.006.2016114035956
MOD13Q1.A2016097.h10v04.006.2016114040955
MOD13Q1.A2016097.h10v05.006.2016114040350
DOI: 10.5067/MODIS/MOD13Q1.006
Terra MODIS 250-meter NDVI 16-day composite (MOD13Q1) from May 8–23, 2016, over the Northern Colorado Plateau Network (NCPN). National Parks (NP), National Monuments (NM), National Historic Sites (NHS), and National Recreation Areas (NRA) located in the NCPN are outlined in blue, with Zion National Park highlighted in yellow.
Granule IDs:
MOD13Q1.A2016129.h08v04.006.2016147112728
MOD13Q1.A2016129.h08v05.006.2016147113057
MOD13Q1.A2016129.h09v04.006.2016147113135
MOD13Q1.A2016129.h09v05.006.2016147113226
MOD13Q1.A2016129.h10v04.006.2016147112843
MOD13Q1.A2016129.h10v05.006.2016147112956
DOI: 10.5067/MODIS/MOD13Q1.006
Terra MODIS 250-meter NDVI 16-day composite (MOD13Q1) from May 24–June 8, 2016, over the Northern Colorado Plateau Network (NCPN). National Parks (NP), National Monuments (NM), National Historic Sites (NHS), and National Recreation Areas (NRA) located in the NCPN are outlined in blue, with Zion National Park highlighted in yellow.
Granule IDs:
MOD13Q1.A2016145.h08v04.006.2016166143814
MOD13Q1.A2016145.h08v05.006.2016166143905
MOD13Q1.A2016145.h09v04.006.2016166143918
MOD13Q1.A2016145.h09v05.006.2016166143823
MOD13Q1.A2016145.h10v04.006.2016166143921
MOD13Q1.A2016145.h10v05.006.2016166143911
DOI: 10.5067/MODIS/MOD13Q1.006
Terra MODIS 250-meter NDVI 16-day composite (MOD13Q1) from June 9–24, 2016, over the Northern Colorado Plateau Network (NCPN). National Parks (NP), National Monuments (NM), National Historic Sites (NHS), and National Recreation Areas (NRA) located in the NCPN are outlined in blue, with Zion National Park highlighted in yellow.
Granule IDs:
MOD13Q1.A2016161.h08v04.006.2016184002058
MOD13Q1.A2016161.h08v05.006.2016184011500
MOD13Q1.A2016161.h09v04.006.2016184002026
MOD13Q1.A2016161.h09v05.006.2016183235822
MOD13Q1.A2016161.h10v04.006.2016183235757
MOD13Q1.A2016161.h10v05.006.2016183235846
DOI: 10.5067/MODIS/MOD13Q1.006


References: (Author's Note 5/15/2020: At the time of publishing these references were available online, some resources may no longer be available.)
National Park Service, 2016, 100 years—Let’s celebrate!, accessed June 29, 2016, at https://www.nps.gov/subjects/centennial/index.htm.
National Park Service, 2016, Find your park, accessed June 29, 2016, at https://www.nps.gov/subjects/centennial/findyourpark.htm.
National Park Service, 2016, About us, accessed June 29, 2016, at https://www.nps.gov/aboutus/index.htm.
National Park Service, 2016, Frequently asked questions, accessed June 29, 2016, at https://www.nps.gov/aboutus/faqs.htm.
National Park Service, List of most-visited sites in the National Park Service, 2016, accessed June 29, 2016, at https://www.nps.gov/aboutus/upload/Visitation-historic-and-top-10-sites-2015.pdf.
National Park Service, 2013, Land surface phenology monitoring, accessed June 29, 2016, at http://science.nature.nps.gov/im/units/ncpn/monitor/land_surface.cfm.
Thoma, D.P., 2011, Remote sensing of vegetation phenology and snow-cover extent in Northern Colorado Plateau Network parks—Status and trends 2010. Natural Resource Technical Report NPS/NCPN/ NRTR—2011/455: National Park Service, Fort Collins, Colo., accessed July 11, 2016, at https://irma.nps.gov/DataStore/Reference/Profile/2171255.
Thoma, D. P., Munson, S. M., Irvine, K. M., Witwicki, D. L., and Bunting, E. L., 2016, Semi-arid vegetation response to antecedent climate and water balance windows: Applied Vegetation Science, v. 19, p. 413–429 at http://dx.doi.org/10.1111/avsc.12232.
National Park Service, 2013, Northern Colorado Plateau Network Monitoring Brief—Land surface phenology, accessed June 29, 2016, at http://science.nature.nps.gov/im/units/ncpn/publications.cfm?tab=3&BriefLandSurface=open#BriefLandSurface.
National Park Service, 2010, Northern Colorado Plateau Network Information Brief—Climate change in the Northern Colorado Plateau Network, accessed June 29, 2016, at http://www.nature.nps.gov/climatechange/docs/NCPN_CC.pdf.
National Park Service, 2016, Administrative boundaries of National Park System Units 6/30/2016 - National Geospatial Data Asset (NGDA) NPS National Parks Dataset: National Park Service, Land Resources Division, accessed July 11, 2016, at https://irma.nps.gov/DataStore/Reference/Profile/2225713.
Material written by Cole Krehbiel1
1 Innovate!, Inc., contractor to the U.S. Geological Survey, Earth Resources Observation and Science (EROS) Center, Sioux Falls, South Dakota, USA. Work performed under USGS contract G15PD00766 for LP DAAC2.
2 LP DAAC work performed under NASA contract NNG14HH33I.