A GIF of VIIRS daily imagery of Hurricane Sandy forming in the Caribbean, moving up along the east coast of the United States, and finally dissipating in the Great Lakes region and Canada
A GIF of VIIRS daily imagery of Hurricane Sandy forming in the Caribbean, moving up along the east coast of the United States, and finally dissipating in the Great Lakes region and Canada
(Author's Note 3/1/2024: At the time of publishing these references were available online, some resources may no longer be available.)
Forecasters from NOAA’s Climate Prediction Center have stated that the Atlantic hurricane season, June 1 to November 30, will most likely be above average this year due to a weak El Niño, sea-surface temperatures at near or above average across the Atlantic Ocean and Caribbean Sea, and average or weaker than average changes of winds at different heights in the area. This prediction is a reminder of the 5-year anniversary of Superstorm Sandy, the second costliest U.S. Atlantic hurricane, which caused devastation in the Caribbean and along the east coast of the United States.
Remote sensing data showed the evolution of the lifecycle and impacts of Superstorm Sandy, as well as in the recovery of ecosystems in the years following the event. Lower resolution instruments, which capture a larger area but with less detail, like the Visible Infrared Imaging Radiometer Suite (VIIRS), can be used to observe the formation, strength, movement, and dissipation of hurricanes. On the other hand, moderate or higher resolution instruments, which observe a smaller area in greater detail, like the Terra Advanced Spaceborne Thermal Emission and Reflection Radiometer (ASTER), can be used to assess the damage caused by hurricanes, storms, or other natural disasters.
Over Superstorm Sandy’s 12 day period the VIIRS satellite sensor, flying onboard the Suomi National Polar-orbiting Partnership (NPP) satellite, captured the storm from its formation in the Caribbean to its dissipation over the Eastern U.S. and Canada. Follow along with the VIIRS Daily Surface Reflectance (VNP09CMG) imagery animation to the right to observe Superstorm Sandy.
The storm that would become Superstorm Sandy was detected on October 22, 2012 off the coast of Nicaragua. The next day, October 23, cloud cover from the storm extended over 440 kilometers (km), or nearly 290 miles (m), as observed by VIIRS. Sandy then became a Category 1 hurricane on October 24, dropping more than 20 inches of rain over Hispaniola as it moved towards Jamaica. By October 25, Sandy strengthened to a Category 2 hurricane, growing to 633 km (303 m) in diameter, and made landfall over Cuba. Hurricane Sandy downgraded to a Category 1 hurricane on October 26; however, a new danger approached. Based on Tropical Rainfall Measuring Mission (TRMM) data, forecasters found that Hurricane Sandy was going to collide with a powerful cold front and Arctic air. This cold front caused Sandy to turn its destructive path towards Baltimore, MD, Washington, DC, Philadelphia, PA, and New York, NY. As the storm merged with the cold front it became more powerful and reached over 3218 km (2,000 m) in diameter. By October 28, Hurricane Sandy covered one-third of the U.S. As the storm collided with the Arctic air, it brought 36 inches of snow to parts of the Appalachian Mountains over the next four days. A VIIRS image from October 29 showed the storm had grown to over 1.8 million square miles over land and open ocean that is typically too cold to sustain hurricanes. The now post-tropical nor’easter storm reached from the Carolinas into the Ohio Valley, throughout New England, and into eastern Canada. On the night of the October 29 Sandy made landfall in New Jersey and caused a 14 feet storm surge near New York City, flooding the parts of the subway system. Damages to New Jersey and New York were captured by Terra ASTER and can be viewed below. The next day, October 30, Sandy began to weaken as it moved over Pennsylvania. By October 31, the storm was downgraded to a remnant low pressure area. It finally dissipated over the Great Lakes region and eastern Canada.
Destruction was left in Superstorm Sandy’s wake. Approximately 233 fatalities were recorded due to the storm. In the U.S. alone over 650,000 homes were either damaged or destroyed with over $50 billion worth of damage to 24 U.S. states. Five years later, some of the areas hit hardest by the storm have made attempts to recover by building steel walls and man-made dunes to prevent flooding from storm surges. Some residents have rebuilt their homes on stilts, preparing for flood waters from the next storm. Other areas have been left abandoned as residents move closer inland or to entirely different areas. Some areas have been reverted back to marshes and other natural habitats that existed before residents built houses along the shore. A glimpse of the destruction from Superstorm Sandy was captured by the Terra ASTER instrument. ASTER data can be used to distinguish vegetation from non-vegetation, and to identify damage to roads, homes, and other structures throughout the impacted area. This allows assessment teams to be able to better understand what areas need more assistance. Several of the most impacted areas are shown in the ASTER Precision Terrain Corrected (AST_L1T) images below. Compare the images to see what areas in New Jersey and New York looked like prior to Superstorm Sandy, immediately after the storm, and during June 2017. The captions below describe the damage in each area.
Just as they were for Superstorm Sandy, remote sensing data products, such as those distributed by the LP DAAC, will be essential for observing hurricanes and their path during the 2017 Atlantic hurricane season.
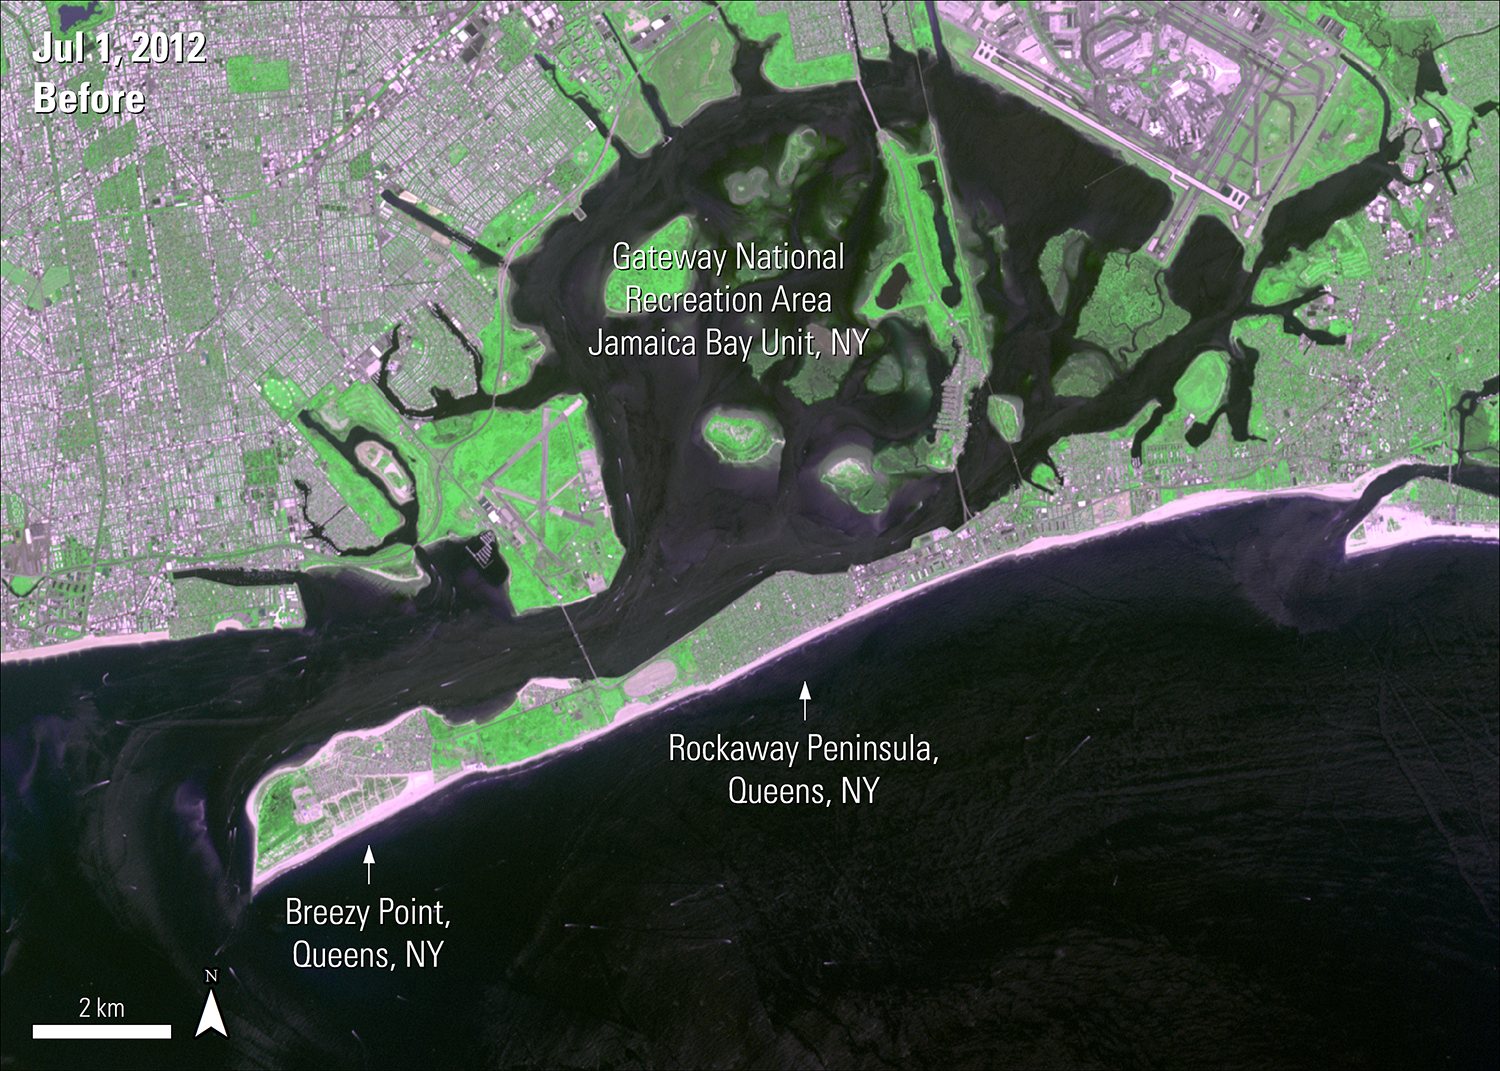
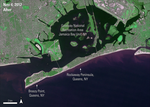
An ASTER L1T image of three areas before they were impacted by Superstorm Sandy near the borough of Queens in New York, New York.

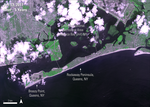
Superstorm Sandy made landfall over this area on October 29, 2012. The ASTER L1T image shows the area a week later. In Breezy Point, a community on the Rockaway Peninsula, over 350 houses were destroyed by flooding and fire, and hundreds more were damaged. In all of the Rockaway Peninsula, over 1,000 homes were damaged. Almost half of the population of the Rockaway Peninsula was left without electricity, heat, or telephone service for at least 3 weeks after the storm. The Jamaica Bay Unit of the Gateway National Recreation Area sustained damage to several buildings, and the pond areas of the park were breached by the ocean. One of the parking lots of the park was used as a temporary location to store debris from Breezy Point.

This ASTER L1T image shows the same area from late spring in 2017. Some recovery efforts are visible along the coasts.
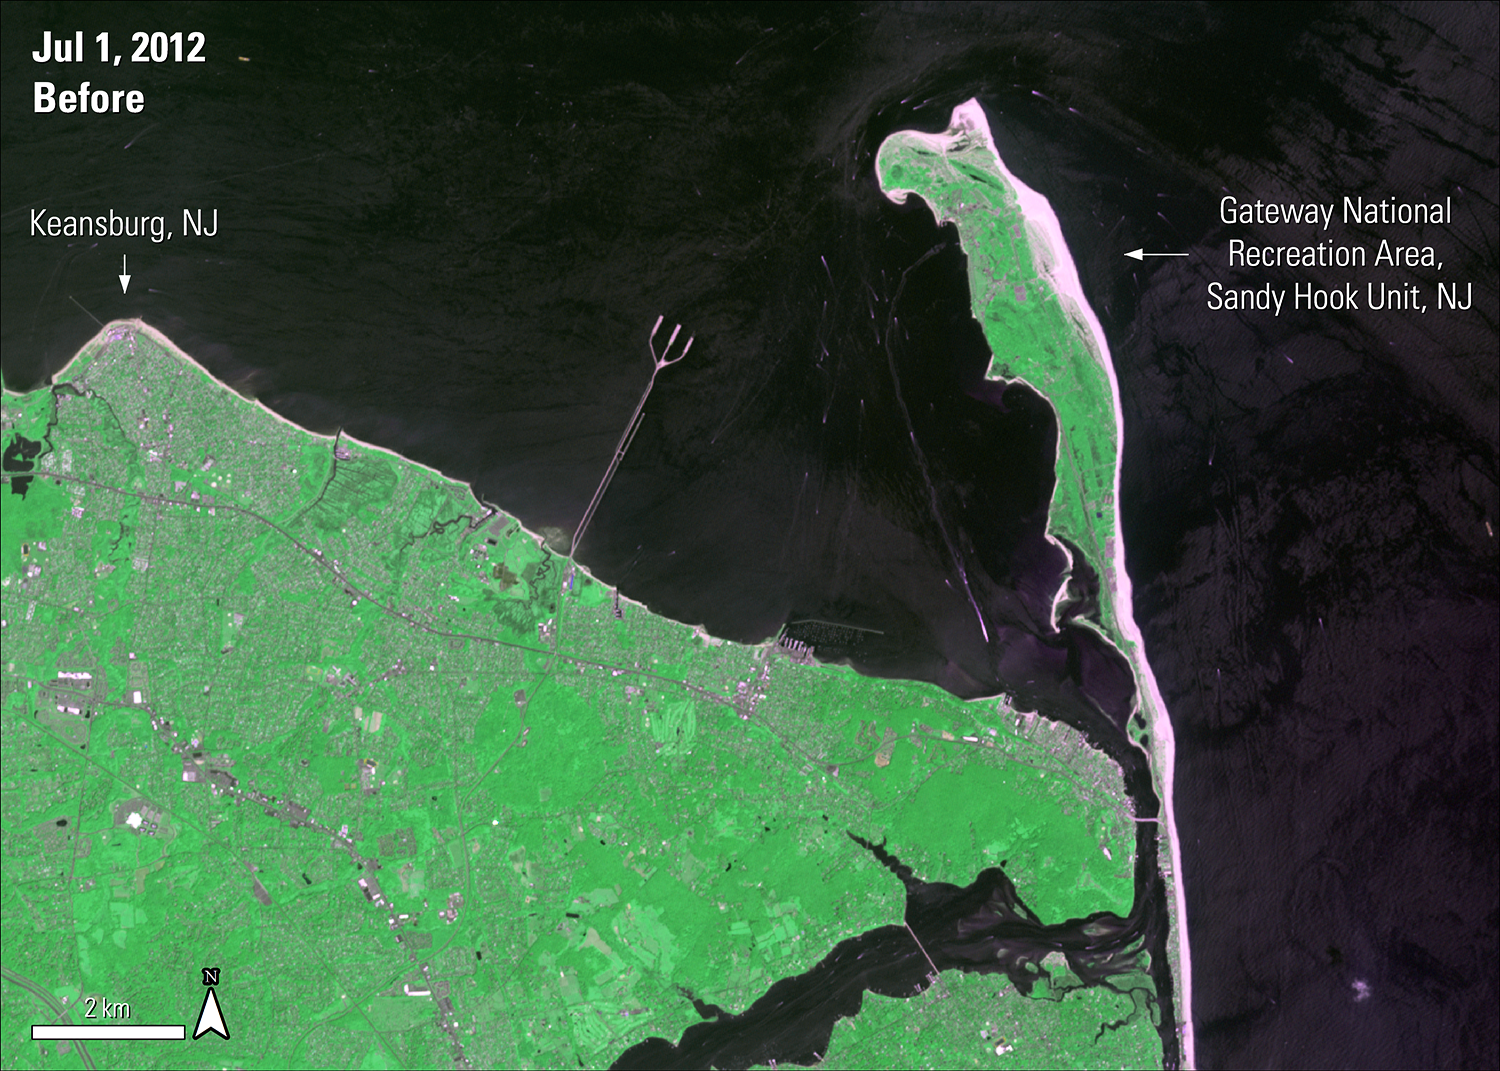
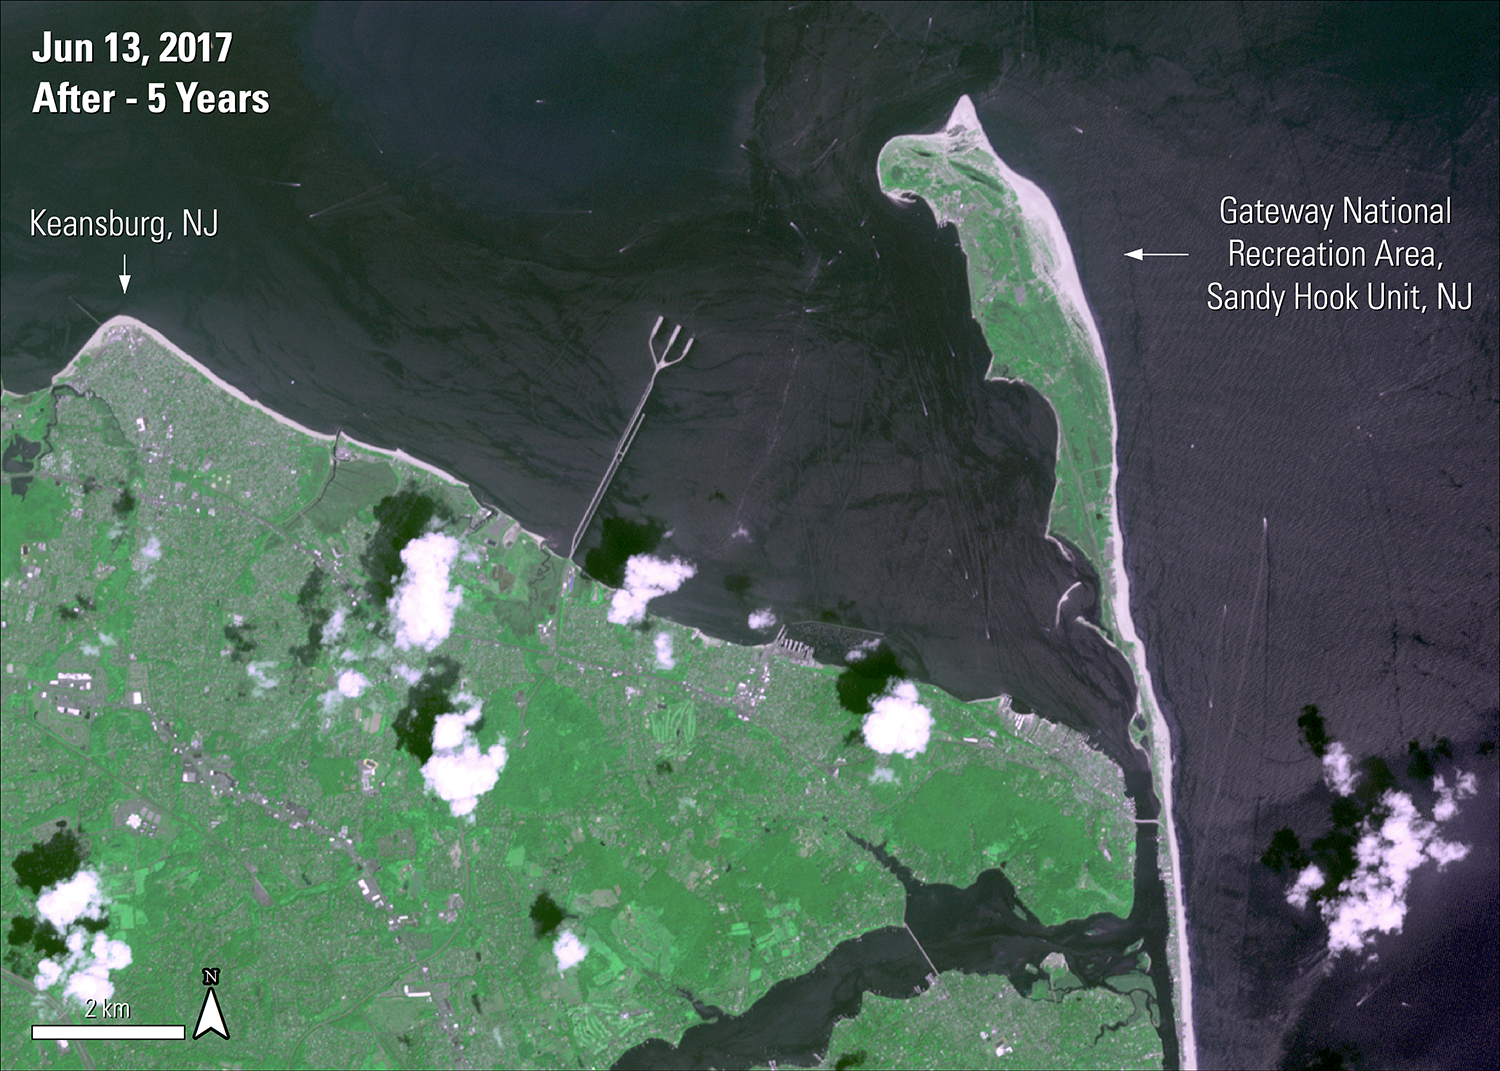
An ASTER L1T image of two areas in New Jersey before they were impacted by Superstorm Sandy.
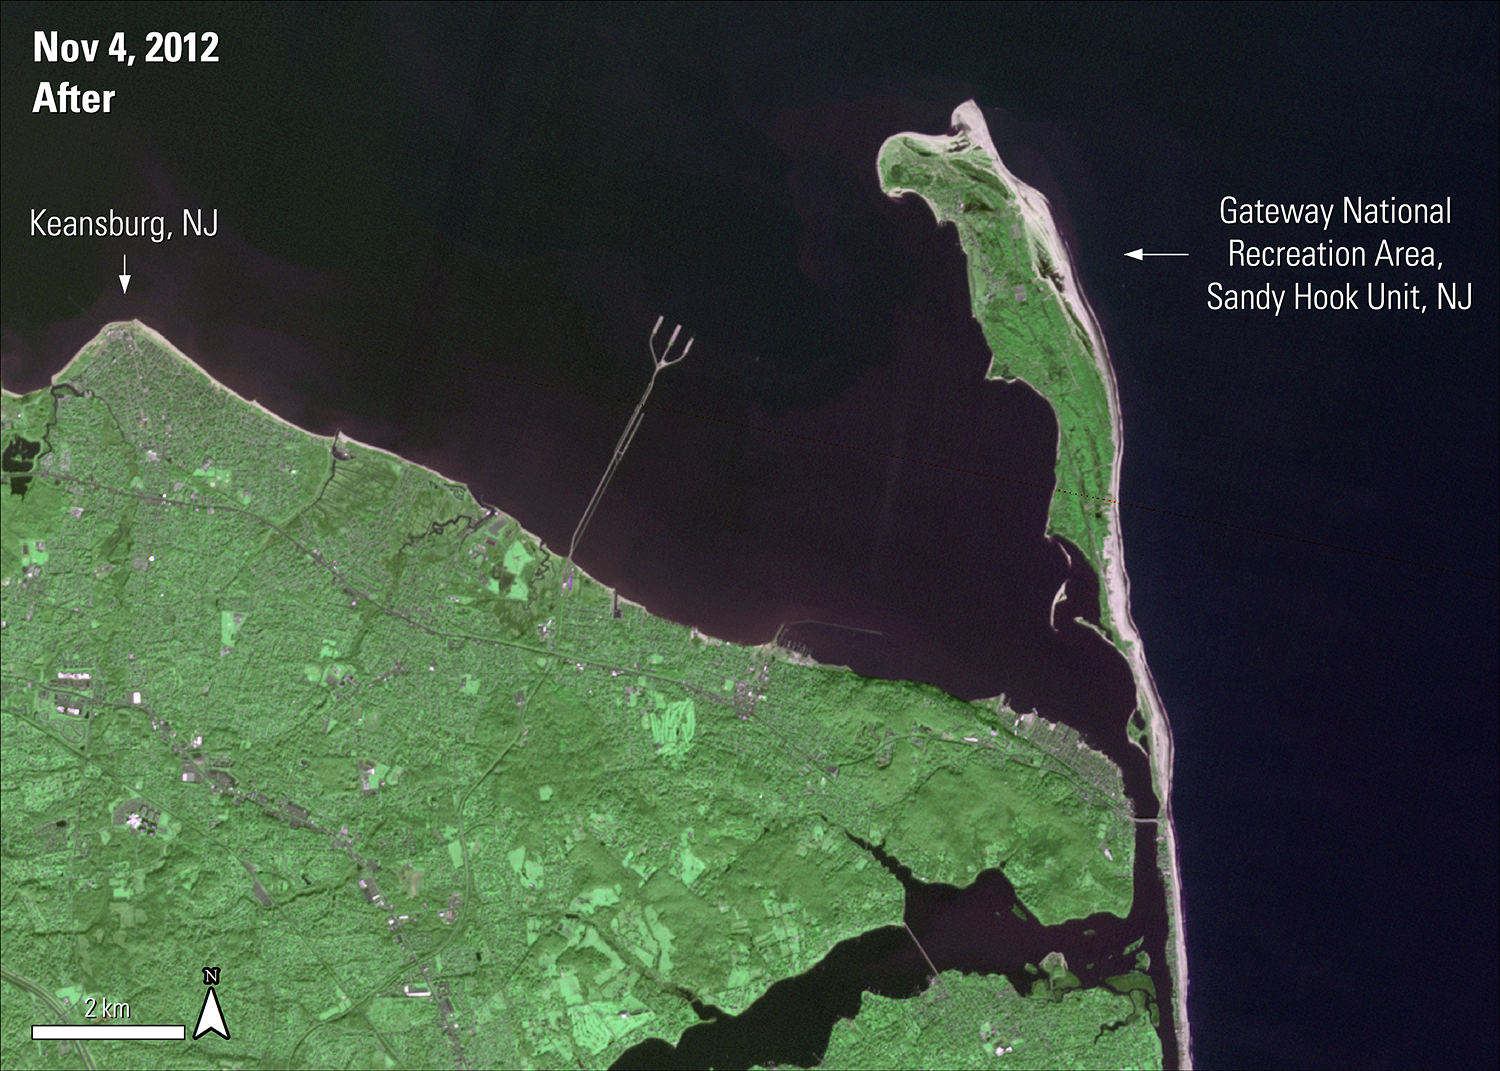
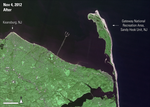
Superstorm Sandy made landfall in this area on October 29, 2012. The ASTER L1T image shows the area a week later. On the tip of Keansburg, New Jersey, is the Keansburg Amusement Park. This park was destroyed by Superstorm Sandy, and over half the area of Keansburg was inundated with flood waters. The Sandy Hook Unit of the Gateway National Recreation Area sustained major damage to the dunes and beach centers and to many of the buildings and utilities in the area.
Superstorm Sandy made landfall in this area on October 29, 2012. The ASTER L1T image shows the area a week later. On the tip of Keansburg, New Jersey, is the Keansburg Amusement Park. This park was destroyed by Superstorm Sandy, and over half the area of Keansburg was inundated with flood waters. The Sandy Hook Unit of the Gateway National Recreation Area sustained major damage to the dunes and beach centers and to many of the buildings and utilities in the area.
An ASTER L1T image of three areas before they were impacted by Superstorm Sandy near the borough of Queens in New York, New York.
Superstorm Sandy made landfall over this area on October 29, 2012. The ASTER L1T image shows the area a week later. In Breezy Point, a community on the Rockaway Peninsula, over 350 houses were destroyed by flooding and fire, and hundreds more were damaged. In all of the Rockaway Peninsula, over 1,000 homes were damaged. Almost half of the population of the Rockaway Peninsula was left without electricity, heat, or telephone service for at least 3 weeks after the storm. The Jamaica Bay Unit of the Gateway National Recreation Area sustained damage to several buildings, and the pond areas of the park were breached by the ocean. One of the parking lots of the park was used as a temporary location to store debris from Breezy Point.
This ASTER L1T image shows the same area from late spring in 2017. Some recovery efforts are visible along the coasts.
An ASTER L1T image of two areas in New Jersey before they were impacted by Superstorm Sandy.
Superstorm Sandy made landfall in this area on October 29, 2012. The ASTER L1T image shows the area a week later. On the tip of Keansburg, New Jersey, is the Keansburg Amusement Park. This park was destroyed by Superstorm Sandy, and over half the area of Keansburg was inundated with flood waters. The Sandy Hook Unit of the Gateway National Recreation Area sustained major damage to the dunes and beach centers and to many of the buildings and utilities in the area.
Superstorm Sandy made landfall in this area on October 29, 2012. The ASTER L1T image shows the area a week later. On the tip of Keansburg, New Jersey, is the Keansburg Amusement Park. This park was destroyed by Superstorm Sandy, and over half the area of Keansburg was inundated with flood waters. The Sandy Hook Unit of the Gateway National Recreation Area sustained major damage to the dunes and beach centers and to many of the buildings and utilities in the area.


References:
Blake, E.S., Kimberlain, T.B., Berg, R.J., Cangialosi, J.P., and Beven II, J.L., 2013, Tropical cyclone report—Hurricane Sandy (AL182012), 22–29 October 2012: National Hurricane Center, accessed June 6, 2017, at http://www.nhc.noaa.gov/data/tcr/AL182012_Sandy.pdf.
Diakakis, M., Deligiannakis, G., Katsetsiadou, K., and Lekkas, E., 2015, Hurricane Sandy mortality in the Caribbean and continental North America: Disaster Prevention and Management, v. 24, no. 1, p. 132-148. [Also available at https://doi.org/10.1108/DPM-05-2014-0082].
Drye, W., 2012, A timeline of Hurricane Sandy’s path of destruction: National Geographic Voices, November 2, 2012, accessed June 9, 2017, at http://voices.nationalgeographic.com/2012/11/02/a-timeline-of-hurricane-sandys-path-of-destruction/.
Keansburg, New Jersey, 2012, Flood inundation map, accessed June 9, 2017, at http://keansburgnj.gov/PDF/flood-inundation-map-knbg.pdf.
Lasky, J., 2017, Breezy Point, Queens—Tested by Hurricane Sandy: The New York Times, May 24, 2017, accessed June 9, 2017, at https://www.nytimes.com/2017/05/24/realestate/breezy-point-queens-tested-by-hurricane-sandy.html?_r=0.
Metropolitan Transportation Authority, New York City, 2015, Superstorm Sandy—Fix & fortify efforts continue, accessed June 9, 2017, at http://web.mta.info/sandy/nyct_girds.htm.
National Aeronautics and Space Administration, 2013, Hurricane Sandy (Atlantic Ocean), accessed June 8, 2017, at https://www.nasa.gov/mission_pages/hurricanes/archives/2012/h2012_Sandy.html#1.
National Oceanic and Atmospheric Administration, 2017, Above-normal Atlantic hurricane season is most likely this year: National Oceanic and Atmospheric Administration News & Features, May 25, 2017, accessed June 7, 2017, at http://www.noaa.gov/media-release/above-normal-atlantic-hurricane-season-is-most-likely-year.
National Park Service, 2015, Gateway recovers from Hurricane Sandy, accessed June 9, 2017, at https://www.nps.gov/gate/learn/news/sandy-recovery.htm.
National Weather Service National Hurricane Center, Saffir-Simpson Hurricane Wind Scale, accessed June 9, 2017, at http://www.nhc.noaa.gov/aboutsshws.php.
Sullivan, K., and Uccellini, L., 2017, Service assessment hurricane/post-tropical cyclone Sandy October 22-29, 2012, accessed June 19, 2017, at http://www.webcitation.org/6H4mLEXmg?url=http://www.nws.noaa.gov/os/assessments/pdfs/Sandy13.pdf.
Subaiya, S., Moussavi, C., Velasquez, A., and Stillman, J., 2014, A rapid needs assessment of the Rockaway Peninsula in New York City after Hurricane Sandy and the relationship of socioeconomic status to recovery: American Journal of Public Health, v. 104, no. 4, p. 632–638, accessed June 9, 2017, at http://dx.doi.org/10.2105/AJPH.2013.301668.
The Weather Channel, 2016, 4 years after superstorm Sandy, some towns still wrestle with consequences of the storm, accessed June 19, 2017, at https://weather.com/news/news/superstorm-sandy-four-years-later.
Material written by Danielle Golon1
1 Innovate!, Inc., contractor to the U.S. Geological Survey, Earth Resources Observation and Science (EROS) Center, Sioux Falls, South Dakota, USA. Work performed under USGS contract G15PD00403 for LP DAAC2.
2 LP DAAC Work performed under NASA contract NNG14HH33I.