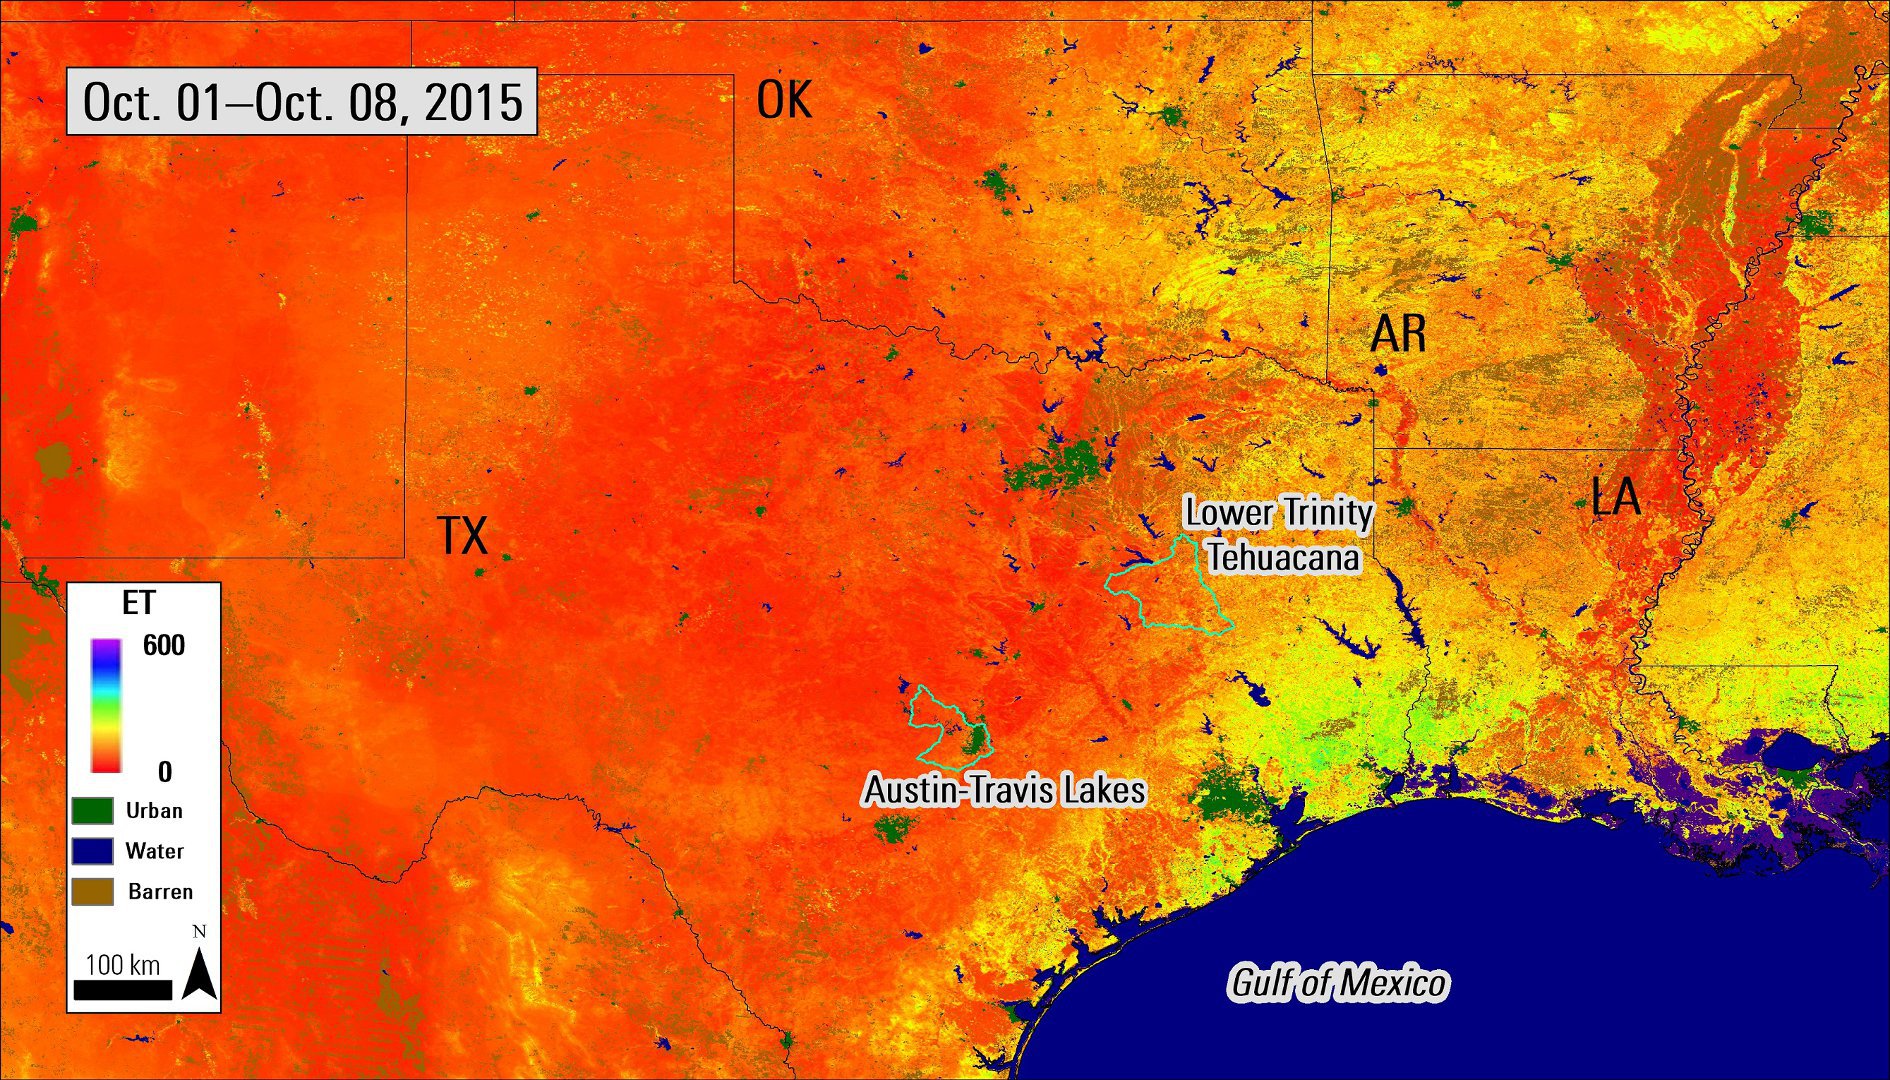
Terra MODIS 500-meter Evapotranspiration 8-day composite (MOD16A2.006) from October 01-08, 2015, over Texas and the south central United States with two of the HUC-8 watershed boundaries used in Velpuri et al. 2016 in cyan.
Granule ID:
MOD16A2.A2015281.h08v05.006.2017080093943
MOD16A2.A2015281.h08v06.006.2017082191559
MOD16A2.A2015281.h09v05.006.2017081162739
MOD16A2.A2015281.h09v06.006.2017080065009
MOD16A2.A2015281.h10v05.006.2017081162944
MOD16A2.A2015281.h10v06.006.2017080062056
DOI: 10.5067/MODIS/MOD16A2.006
As temperatures continue to rise into the summer months of the Northern Hemisphere, farmers, ranchers, and land managers all undoubtedly will be keeping an eye to the sky for rain. Without precipitation, soil moisture decreases; subsequently crops wither, grasslands turn brown, and lakes begin shrinking, resulting in one of Earth’s worst natural disasters: drought. Economically speaking, droughts are devastating to the agriculture economy, causing a lack of available resources for ranchers and extensive damage to crops. One state that will be keeping a very close eye to the sky is Texas. In 2011, Texas suffered its driest year on record and the ensuing drought was linked to $7.62 billion in agriculture-related losses, with livestock losses alone topping $3.23 billion. While the state did see some relief with the arrival of Hurricane Harvey in October 2017, by the end of May 2018, over two thirds of the state again experienced drought conditions.
Early warning systems and drought monitoring tools are essential to manage the impact of water scarcities and minimize drought losses. While precipitation is considered the best observed hydrologic variable, scientists also will be using “eyes in the sky,” or satellite sensors, to monitor the land surface. Remote sensing data are important because there are useful drought-indicating parameters besides precipitation that can be measured from space, including evapotranspiration (ET), vegetation indices, land surface temperature (LST), and soil moisture.
One of the least measured variables for understanding drought at large spatial scales is soil moisture. Soil moisture also may be one of the most important, as it combines responses of previous moisture, recent precipitation, and the ability of the soil and vegetation to retain moisture. One recent study by Velpuri et. al (2016) demonstrated the use of Soil Moisture Active Passive (SMAP) data for drought monitoring in the rangelands of Oklahoma and Texas by comparing SMAP soil moisture with precipitation data, modeled evapotranspiration, and Moderate Resolution Imaging Spectroradiometer (MODIS) land surface temperature data. The goal of the SMAP mission is to provide global mapping of soil moisture and freeze/thaw state with unprecedented resolution, coverage, and accuracy.
Using AppEEARS, or the Application for Extracting and Exploring Analysis Ready Samples, is one way to explore the combined capabilities of MODIS data products with SMAP soil moisture data products for investigating droughts in places like Texas. AppEEARS currently provides access to multiple datasets that could be useful for observing drought conditions, including the most recent SMAP soil moisture products, Terra MODIS Version 6 Land Surface Temperature (LST) (MOD11A2.006), and Terra and Aqua Combined MODIS Land Cover Type (LCT) (MCD12Q1.051*) data products. Additionally, the Terra MODIS Evapotranspiration (MOD16A2.006) 8-day composited product also is available. With AppEEARS, data can be subset spatially (point or area), by variable (identify only the data layers of interest), and temporally (time period of interest).
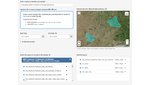
In the image below (Image 1) the AppEEARS Extract Area Sample form shows a request for the (hydrologic unit class) HUC-8 sub-basin level for two of the majority-rangeland watersheds used in the Velpuri et. al (2016) study. The interactive data visualizations that AppEEARS provides are shown in Images 2–4. In addition to the interactive data visualizations, results from AppEEARS can be output as GeoTIFF or NetCDF-4 files for each data layer and area of interest. Several .csv files containing summary statistics such as mean, range, and standard deviation, grouped by region of interest, product, and observation also are provided as output.
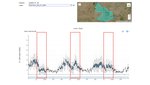
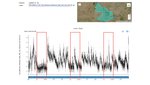
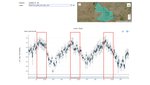
A drought occurred during the period of the Velpuri et. al (2016) study. The Terra MODIS Evapotranspiration composite image (above right) shows very low evapotranspiration over much of the study region in shades of orange-red in October 2015. Below, notice in Images 2-4 from around July 2015 to October 2015 (shown in red), that SMAP soil moisture and Terra MODIS ET are lower, compared with Terra MODIS LST which is higher, when compared with the July-October time frame in 2016 and 2017. When comparing SMAP soil moisture with ET in AppEEARS, a strong positive relationship can be seen by comparing Images 2 and 3 below. Also, SMAP soil moisture demonstrates a negative relationship with Terra MODIS LST which can be seen by comparing Images 3 and 4 below, where higher LST values correlate with lower soil moisture values in general. Higher land surface temperatures can be both a cause and a symptom of low soil moisture, as higher temperatures lead to decreased soil moisture, and drier soil can more easily reach higher temperatures.
Overall, Velpuri et. al (2016) found that SMAP soil moisture can complement and validate other agro-hydrologic variables used in rangeland ecosystem drought monitoring and can potentially be used as an additional input to develop a multi-index drought monitoring system. Combining multiple remote sensing-derived datasets from multiple sensors provides rich opportunities to understand land surface dynamics and drought, and ultimately can help farmers, ranchers, and decision makers mitigate the impact of drought as fast as possible. AppEEARS simplifies the process of combining geospatial data products from different Federal archives to help users better understand the dynamics of our planet.
(Author's Note 5/15/2020: At the time of publishing Combined MODIS Land Cover Version 5 data was available. This data has since been decommissioned. Users are encouraged to use the Version 6 product: https://doi.org/10.5067/MODIS/MCD12Q1.006)

Example of AppEEARS Extract Area Sample form. This request uses a shapefile containing two HUC-8 sub-basin watershed boundaries to subset data spatially from 2015–2018 for SMAP AM soil moisture (SPL3SMP_E.001), Terra MODIS Land Surface Temperature (MOD11A2.006), Combined MODIS Land Cover Type (MCD12Q1.051*), and Terra MODIS Evapotranspiration (MOD16A2.006).

Example of AppEEARS boxplot time series showing low Terra MODIS Evapotranspiration (ET) (MOD16A2.006) from around July to October 2015, likely due to drought conditions in the Austin-Travis Lakes HUC-8 unit. Notice the differences in ET from July-October 2015 vs. July-October 2016 and 2017.
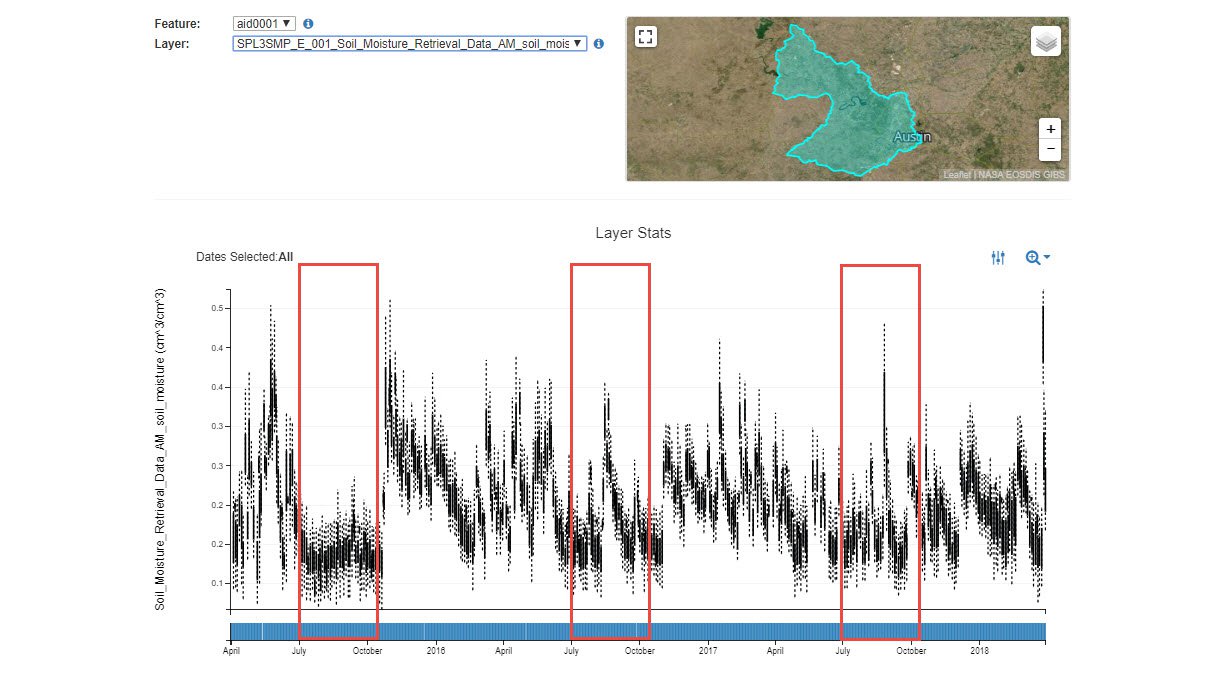
Example of AppEEARS boxplot time series showing very low SMAP AM soil moisture (SPL3SMP_E.001) from around July to October 2015, likely due to drought conditions in the Austin-Travis Lakes HUC-8 unit. Notice the differences in soil moisture from July-October 2015 vs. July-October 2016 and 2017.
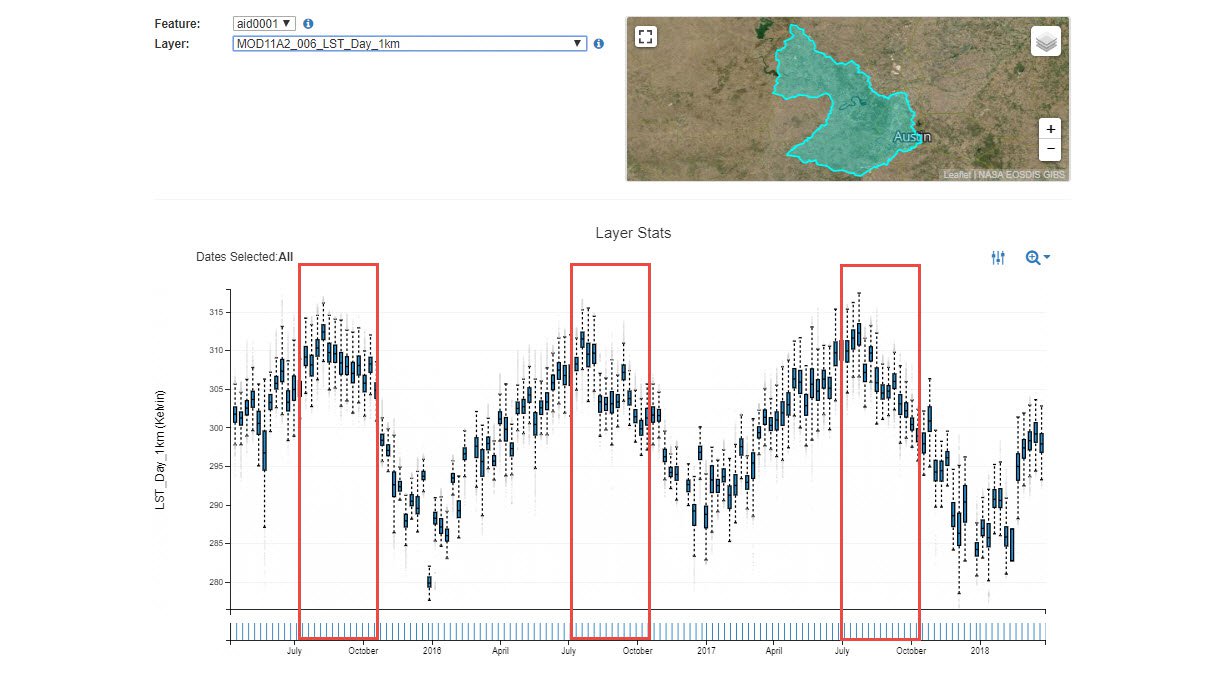
Example of AppEEARS boxplot time series showing high Terra MODIS Land Surface Temperature (MOD11A2.006) from around July to October 2015, which helped to cause drought conditions in the Austin-Travis Lakes HUC-8 unit. Notice the differences in LST from July-October 2015 vs. July-October 2016 and 2017.
Example of AppEEARS Extract Area Sample form. This request uses a shapefile containing two HUC-8 sub-basin watershed boundaries to subset data spatially from 2015–2018 for SMAP AM soil moisture (SPL3SMP_E.001), Terra MODIS Land Surface Temperature (MOD11A2.006), Combined MODIS Land Cover Type (MCD12Q1.051*), and Terra MODIS Evapotranspiration (MOD16A2.006).
Example of AppEEARS boxplot time series showing low Terra MODIS Evapotranspiration (ET) (MOD16A2.006) from around July to October 2015, likely due to drought conditions in the Austin-Travis Lakes HUC-8 unit. Notice the differences in ET from July-October 2015 vs. July-October 2016 and 2017.
Example of AppEEARS boxplot time series showing very low SMAP AM soil moisture (SPL3SMP_E.001) from around July to October 2015, likely due to drought conditions in the Austin-Travis Lakes HUC-8 unit. Notice the differences in soil moisture from July-October 2015 vs. July-October 2016 and 2017.
Example of AppEEARS boxplot time series showing high Terra MODIS Land Surface Temperature (MOD11A2.006) from around July to October 2015, which helped to cause drought conditions in the Austin-Travis Lakes HUC-8 unit. Notice the differences in LST from July-October 2015 vs. July-October 2016 and 2017.
References: (Author's Note 5/15/2020: At the time of publishing these references were available online, some resources may no longer be available.)
Artusa, A., 2018, United States Drought Monitor: Texas, accessed June 6, 2018, at droughtmonitor.unl.edu/CurrentMap/StateDroughtMonitor.aspx?TX.
Cobler, P., 2018, Drought returns to Texas just months after Hurricane Harvey floods state, accessed June 6, 2018 at https://www.texastribune.org/2018/01/24/texas-drought-ravages-panhandle/.
Fannin, B., 2012, Updated 2011 Texas agricultural drought losses total $7.62 billion, accessed June 6, 2018, at https://today.agrilife.org/2012/03/21/updated-2011-texas-agricultural-drought-losses-total-7-62-billion/.
Friedl, M., and Sulla-Menashe, D., 2010, MCD12Q1 MODIS/Terra+Aqua Land Cover Type Yearly L3 Global 500m SIN Grid V051 [Land Cover Type 1]: NASA EOSDIS Land Processes DAAC, accessed May 25, 2018 at https://lpdaac.usgs.gov/dataset_discovery/modis/modis_products_table/mcd12q1.
O'Neill, P. E., Chan, S., Njoku, E.G., Jackson, T., and Bindlish, R., 2016, SMAP Enhanced L3 Radiometer Global Daily 9 km EASE-Grid Soil Moisture, Version 1 [Soil_Moisture_Retrieval_Data_AM_soil_moisture]: NASA National Snow and Ice Data Center Distributed Active Archive Center (NSIDC), accessed May 25, 2018 at https://doi.org/10.5067/ZRO7EXJ8O3XI.
Running, S., Mu, Q., and Zhao, M., 2017, MOD16A2 MODIS/Terra Net Evapotranspiration 8-Day L4 Global 500m SIN Grid V006 [ET_500m]: NASA EOSDIS Land Processes DAAC, accessed May 25, 2018 at https://doi.org/10.5067/MODIS/MOD16A2.006.
USDA/NRCS - National Geospatial Center of Excellence, 2013, 12-Digit Watershed Boundary Dataset in HUC-8, accessed June 1, 2018, at https://gdg.sc.egov.usda.gov/.
Velpuri, N. M., Senay, G. B., and Morisette, J. T., 2016, Evaluating new SMAP soil moisture for drought monitoring in the rangelands of the U.S. high plains: Rangelands, v. 38 no. 4, 183-190, accessed May 25, 2018 at https://doi.org/10.1016/j.rala.2016.06.002.
Wan, Z., Hook, S., and Hulley, G, 2015, MOD11A2 MODIS/Terra Land Surface Temperature/Emissivity 8-Day L3 Global 1km SIN Grid V006 [LST_Day_1km]: NASA EOSDIS LP DAAC, accessed May 25, 2018, at https://doi.org/10.5067/MODIS/MOD11A2.006.
Material written by Cole Krehbiel1
1 Innovate!, Inc., contractor to the U.S. Geological Survey, Earth Resources Observation and Science (EROS) Center, Sioux Falls, South Dakota, USA. Work performed under USGS contract G15PD00467 for LP DAAC2.
2 LP DAAC Work performed under NASA contract NNG14HH33I.