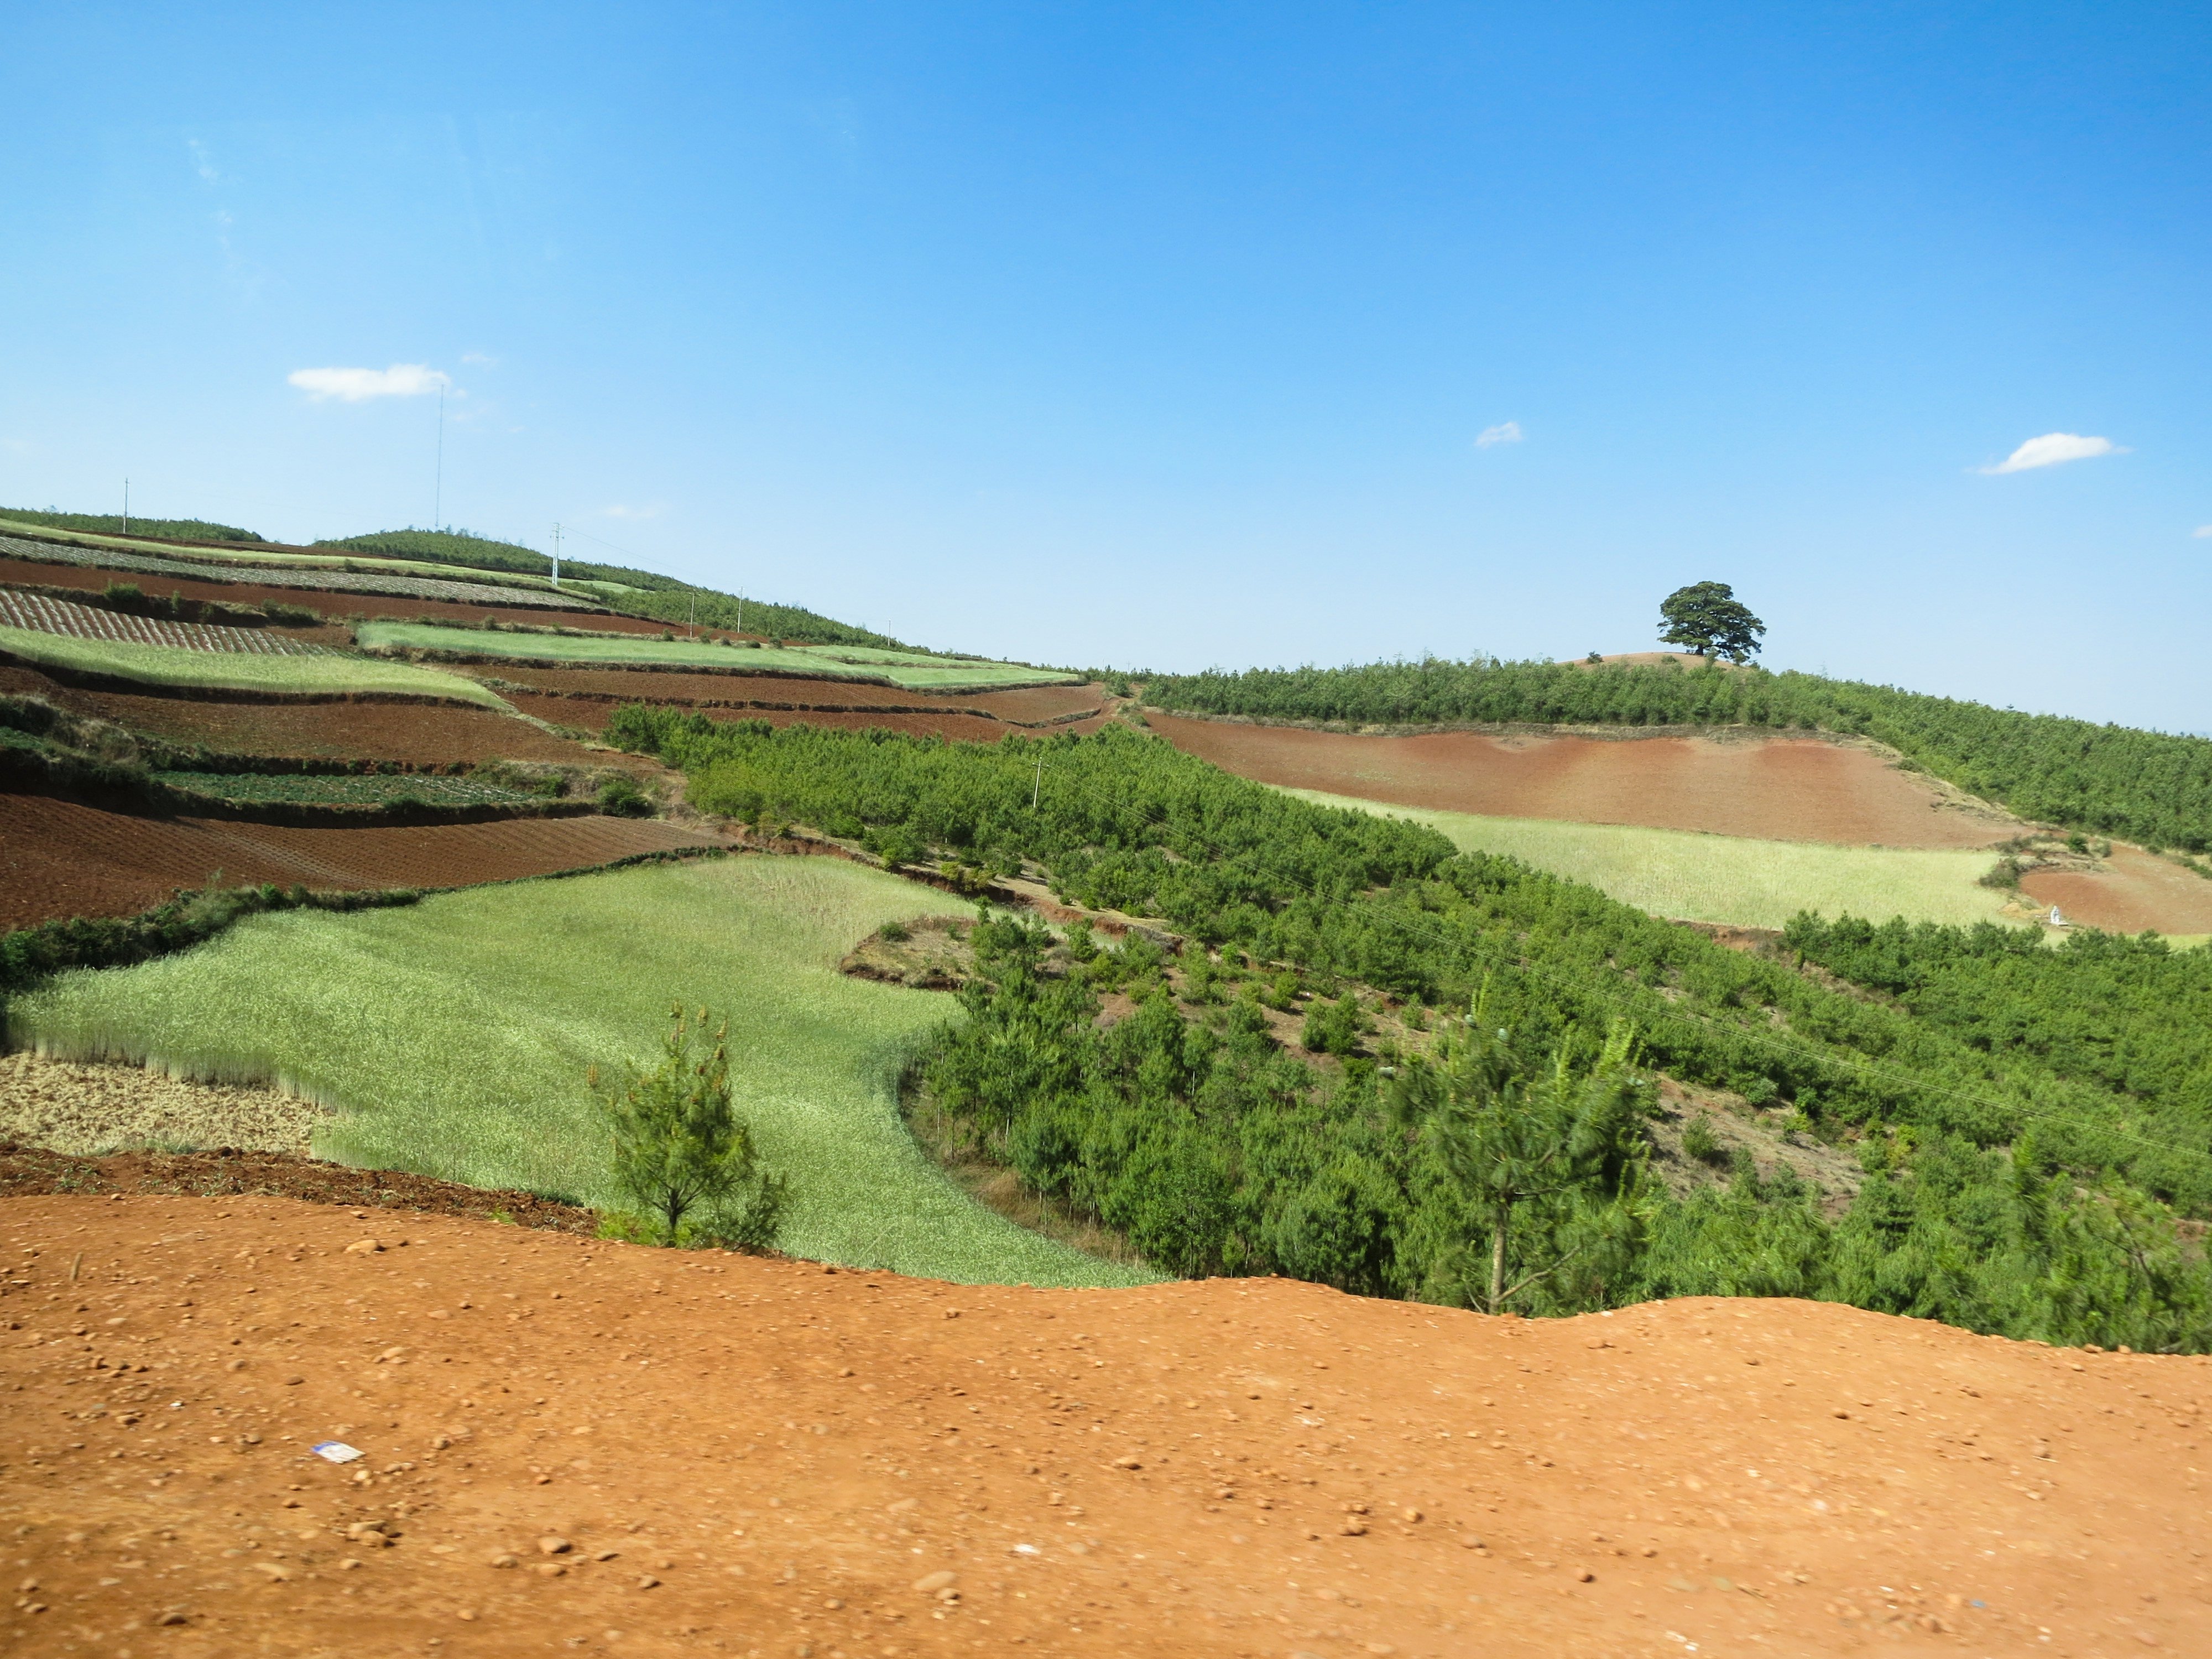
Example of reforestation, or afforestation, as a result of the Conversion of Cropland to Forest Program in southern China. cifor / flickr.com / CC by SA 2.0
Example of reforestation, or afforestation, as a result of the Conversion of Cropland to Forest Program in southern China. cifor / flickr.com / CC by SA 2.0
(Author's Note 2/28/2022: At the time of publishing these references were available online, some resources may no longer be available.)
Many recent remote sensing studies have focused on identifying the location, determining the causes, and quantifying the magnitude of global forest cover changes. Changes in forest cover can be a result of deforestation (decreases in forest cover), or reforestation, (increases in forest cover). One recent study by Nüchel and Svenning (2017) looked at deforestation and reforestation by investigating changes in tree cover from 2000 to 2010 in eastern China. The hypothesis of the study is that while locally some areas have seen forest losses and gains, as a whole, eastern China has seen increases in tree cover. Moreover, the scientists speculated that increases in tree cover occur in regions experiencing population decline, especially those with low human influence, and in areas with certain environmental conditions, such as higher actual evapotranspiration and higher slope/elevation.
To test their hypothesis, the researchers gathered tree cover data for 2000–2010 from the Terra Moderate Resolution Imaging Spectroradiometer (MODIS) Vegetation Continuous Fields (VCF, MOD44B) data product. The MODIS VCF product is a global representation of surface vegetation cover as gradients (percent), including tree cover, non-tree cover, and non-vegetated bare ground, produced annually at 250 meter (m) resolution. To analyze the impacts of anthropogenic factors on tree cover change, they used the Gridded Population of the World, Version 4 (GPWv4) Population Density (UN-Adjusted) dataset. GPW models the distribution of human population on a global raster surface (1 kilometer resolution), providing population data that are compatible with remote sensing datasets. The study also used the NASA Making Earth System Data Records for Use in Research Environments (MEaSUREs) Shuttle Radar Topography Mission (SRTM v3) 90 m resolution digital elevation model (DEM), and mean annual actual evapotranspiration (AET) from the Global High-Resolution Soil-Water Balance dataset. The authors calculated changes in tree cover and population density from 2000–2010, and derived slope from the SRTM DEM. They grouped the data to the prefecture and county levels, as well as into 5 by 5 kilometer grids, taking the mean of all variables at each spatial unit. The study used random forest modeling of the remote sensing-derived tree cover change data and linked changes to socioeconomic data (Population and environmental predictor variables (Elevation, Evapotranspiration).
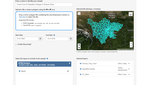
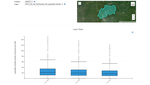
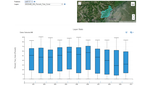
Before turning to results, it is notable that many aspects of this study could have been completed in AppEEARS, the Application for Extracting and Exploring Analysis Ready Samples. AppEEARS currently provides access to similar datasets, including the MODIS VCF, GPW UN-Adjusted Population Density, and SRTM DEM data. Additionally, AppEEARS recently added the MODIS Evapotranspiration (MOD16A2) 8-day composited products. AppEEARS allows you to subset data spatially (point or area), spectrally (only the datasets you are interested in), and temporally (time period of interest). Image 1 shows the AppEEARS Extract Area Sample form subset spatially at the county-level for all of Sichuan Prefecture, a region mentioned in the study as having some of the locally highest rates of both re- and deforestation. The interactive data visualizations that AppEEARS provides are shown in Images 2–5. In addition to the interactive data visualizations, results from AppEEARS are output as GeoTIFF or NetCDF-4 files and CSV files containing summary statistics such as mean, range, and standard deviation, grouped by region of interest, product, and observation.
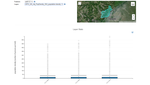
The study found that AET, slope/elevation, and changes in population density were all important explanatory factors for changes in tree cover. Decreased population density was linked to increased forest cover, and the authors suggest that this might be explained by marginal agriculture land abandonment. Cangxi County, Sichuan Prefecture demonstrates this trend, showing increased forest cover (Image 2) and decreased population density (Image 3) from 2000–2010. Meanwhile, Wenchuan County, Sichuan Prefecture shows decreased forest (Image 4) and increased population density (Image 5). Overall, the study’s findings show that increases in tree cover in eastern China are associated with low or declining human pressure, steep terrain (slope), and climatic conditions that favor tree growth. China also has enacted measures such as the Slope Land Conversion program, which aims to take marginal farmland with high slopes and convert the land back to forest. Forest cover change is of great concern across the planet as forests are sources of biodiversity and provide myriad ecosystem services to humans. Combining remote sensing-derived datasets from tree cover to elevation to evapotranspiration, along with socioeconomic data such as population density, provides rich opportunities to understand land surface dynamics and the various roles that humans and the environment play in changes in vegetation. AppEEARS simplifies the process of combining geospatial datasets from different sources to help users better understand the dynamics of our planet.

Example of AppEEARS Extract Area Sample form. This request is using a shapefile of counties in Sichuan Prefecture to subset data spatially from 2000–2010 for NASA MEaSUREs SRTM (SRTM v3), Terra MODIS Vegetation Continuous Fields (VCF) Percent Tree Cover (MOD44B.006), GPW UN-Adjusted Population Density (GPW v4), and Terra MODIS Evapotranspiration (MOD16A2.006).
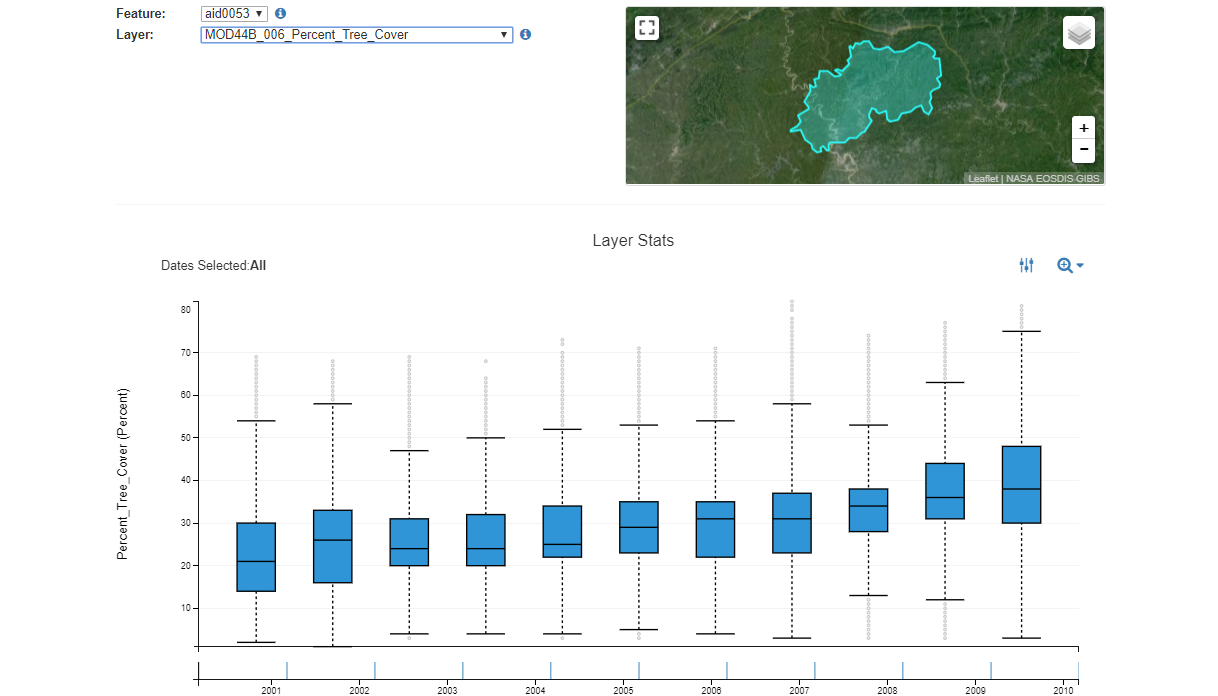
Example of AppEEARS boxplot time series showing annual Terra MODIS VCF Percent Tree Cover (MOD44B.006) increasing from 2000–2010 for Cangxi County, China.

Example of AppEEARS boxplot time series showing UN-Adjusted Population Density (GPW v4) decreasing from 2000–2010 for Cangxi County, China.

Example of AppEEARS boxplot time series showing annual Terra MODIS VCF Percent Tree Cover (MOD44B.006) decreasing from 2000–2010 for Wenchuan County, China.

Example of AppEEARS boxplot time series showing UN-Adjusted Population Density GPW v4 increasing from 2000–2010 for Wenchuan County, China.
Example of AppEEARS Extract Area Sample form. This request is using a shapefile of counties in Sichuan Prefecture to subset data spatially from 2000–2010 for NASA MEaSUREs SRTM (SRTM v3), Terra MODIS Vegetation Continuous Fields (VCF) Percent Tree Cover (MOD44B.006), GPW UN-Adjusted Population Density (GPW v4), and Terra MODIS Evapotranspiration (MOD16A2.006).
Example of AppEEARS boxplot time series showing annual Terra MODIS VCF Percent Tree Cover (MOD44B.006) increasing from 2000–2010 for Cangxi County, China.
Example of AppEEARS boxplot time series showing UN-Adjusted Population Density (GPW v4) decreasing from 2000–2010 for Cangxi County, China.
Example of AppEEARS boxplot time series showing annual Terra MODIS VCF Percent Tree Cover (MOD44B.006) decreasing from 2000–2010 for Wenchuan County, China.
Example of AppEEARS boxplot time series showing UN-Adjusted Population Density GPW v4 increasing from 2000–2010 for Wenchuan County, China.

References:
Center for International Earth Science Information Network, CIESIN, Columbia University, 2015, Gridded population of the world, Version 4 (GPWv4)—Population density adjusted to match 2015 revision UN WPP country totals dataset: NASA Socioeconomic Data and Applications Center (SEDAC), accessed March 7, 2018, at https://doi.org/10.7927/H4SF2T42.
Dimiceli, C., Carroll, M., Sohlberg, R., Kim, D.H., Kelly, M., and Townshend, J.R.G., 2015, MOD44B—MODIS/Terra vegetation continuous fields yearly L3 global 250m SIN grid V006 dataset: NASA EOSDIS Land Processes DAAC, accessed March 6, 2018, at https://doi.org/10.5067/MODIS/MOD44B.006.
Nüchel, J., and Svenning, J.C., 2017, Recent tree cover increases in eastern China linked to low, declining human pressure, steep topography, and climatic conditions favoring tree growth: PLoS ONE, v. 12, no. 6, e0177552, accessed March 7, 2018, at https://doi.org/10.1371/journal.pone.0177552.
Reuter, H.I., Nelson, A., and Guevara, E., 2008, Hole-filled SRTM for the globe Version 4 dataset: CGIAR-CSI SRTM 90m Database, accessed March 7, 2018, at http://srtm.csi.cgiar.org.
Trabucco, A., and Zomer, R.J., 2010, Global high-resolution soil-water balance database: CGIAR Consortium for Spatial Information, accessed March 6, 2018, at http://www.cgiar-csi.org/data/global-high-resolution-soil-water-balance.
Material written by Cole Krehbiel1
1 Innovate!, Inc., contractor to the U.S. Geological Survey, Earth Resources Observation and Science (EROS) Center, Sioux Falls, South Dakota, USA. Work performed under USGS contract G15PD00467 for LP DAAC2.
2 LP DAAC Work performed under NASA contract NNG14HH33I.