A false color composite using the CONUS weekly WELD (WELDUSWK) data product of agriculture in Collyer, Kansas. Agricultural crops, like those seen in this image, can be automatically identified using algorithms with WELD data.
Granule ID:
CONUS.week22.2010.h14v10.doy152to152.v1.5
A false color composite using the CONUS weekly WELD (WELDUSWK) data product of agriculture in Collyer, Kansas. Agricultural crops, like those seen in this image, can be automatically identified using algorithms with WELD data.
Granule ID:
CONUS.week22.2010.h14v10.doy152to152.v1.5
(Author's Note 5/15/2020: WELD data have since been decommissioned. Users are encouraged to use Global WELD (GWELD) data in place of WELD data. More information on GWELD.)
Web-Enabled Landsat Data (WELD) is a National Aeronautics and Space Administration (NASA) Making Earth Science Data Records for Use in Research Environments (MEaSUREs) project that created composited mosaics of the Conterminous United States (CONUS) and Alaska using Landsat Enhanced Thematic Mapper Plus (ETM+) data from December 2002 through November 2012. A first of its kind, the WELD data products were designed with the purpose of providing scienctific quality Landat data consistent in both temporal resolution and quality at a continental scale with limited clouds. WELD products are available at no charge.
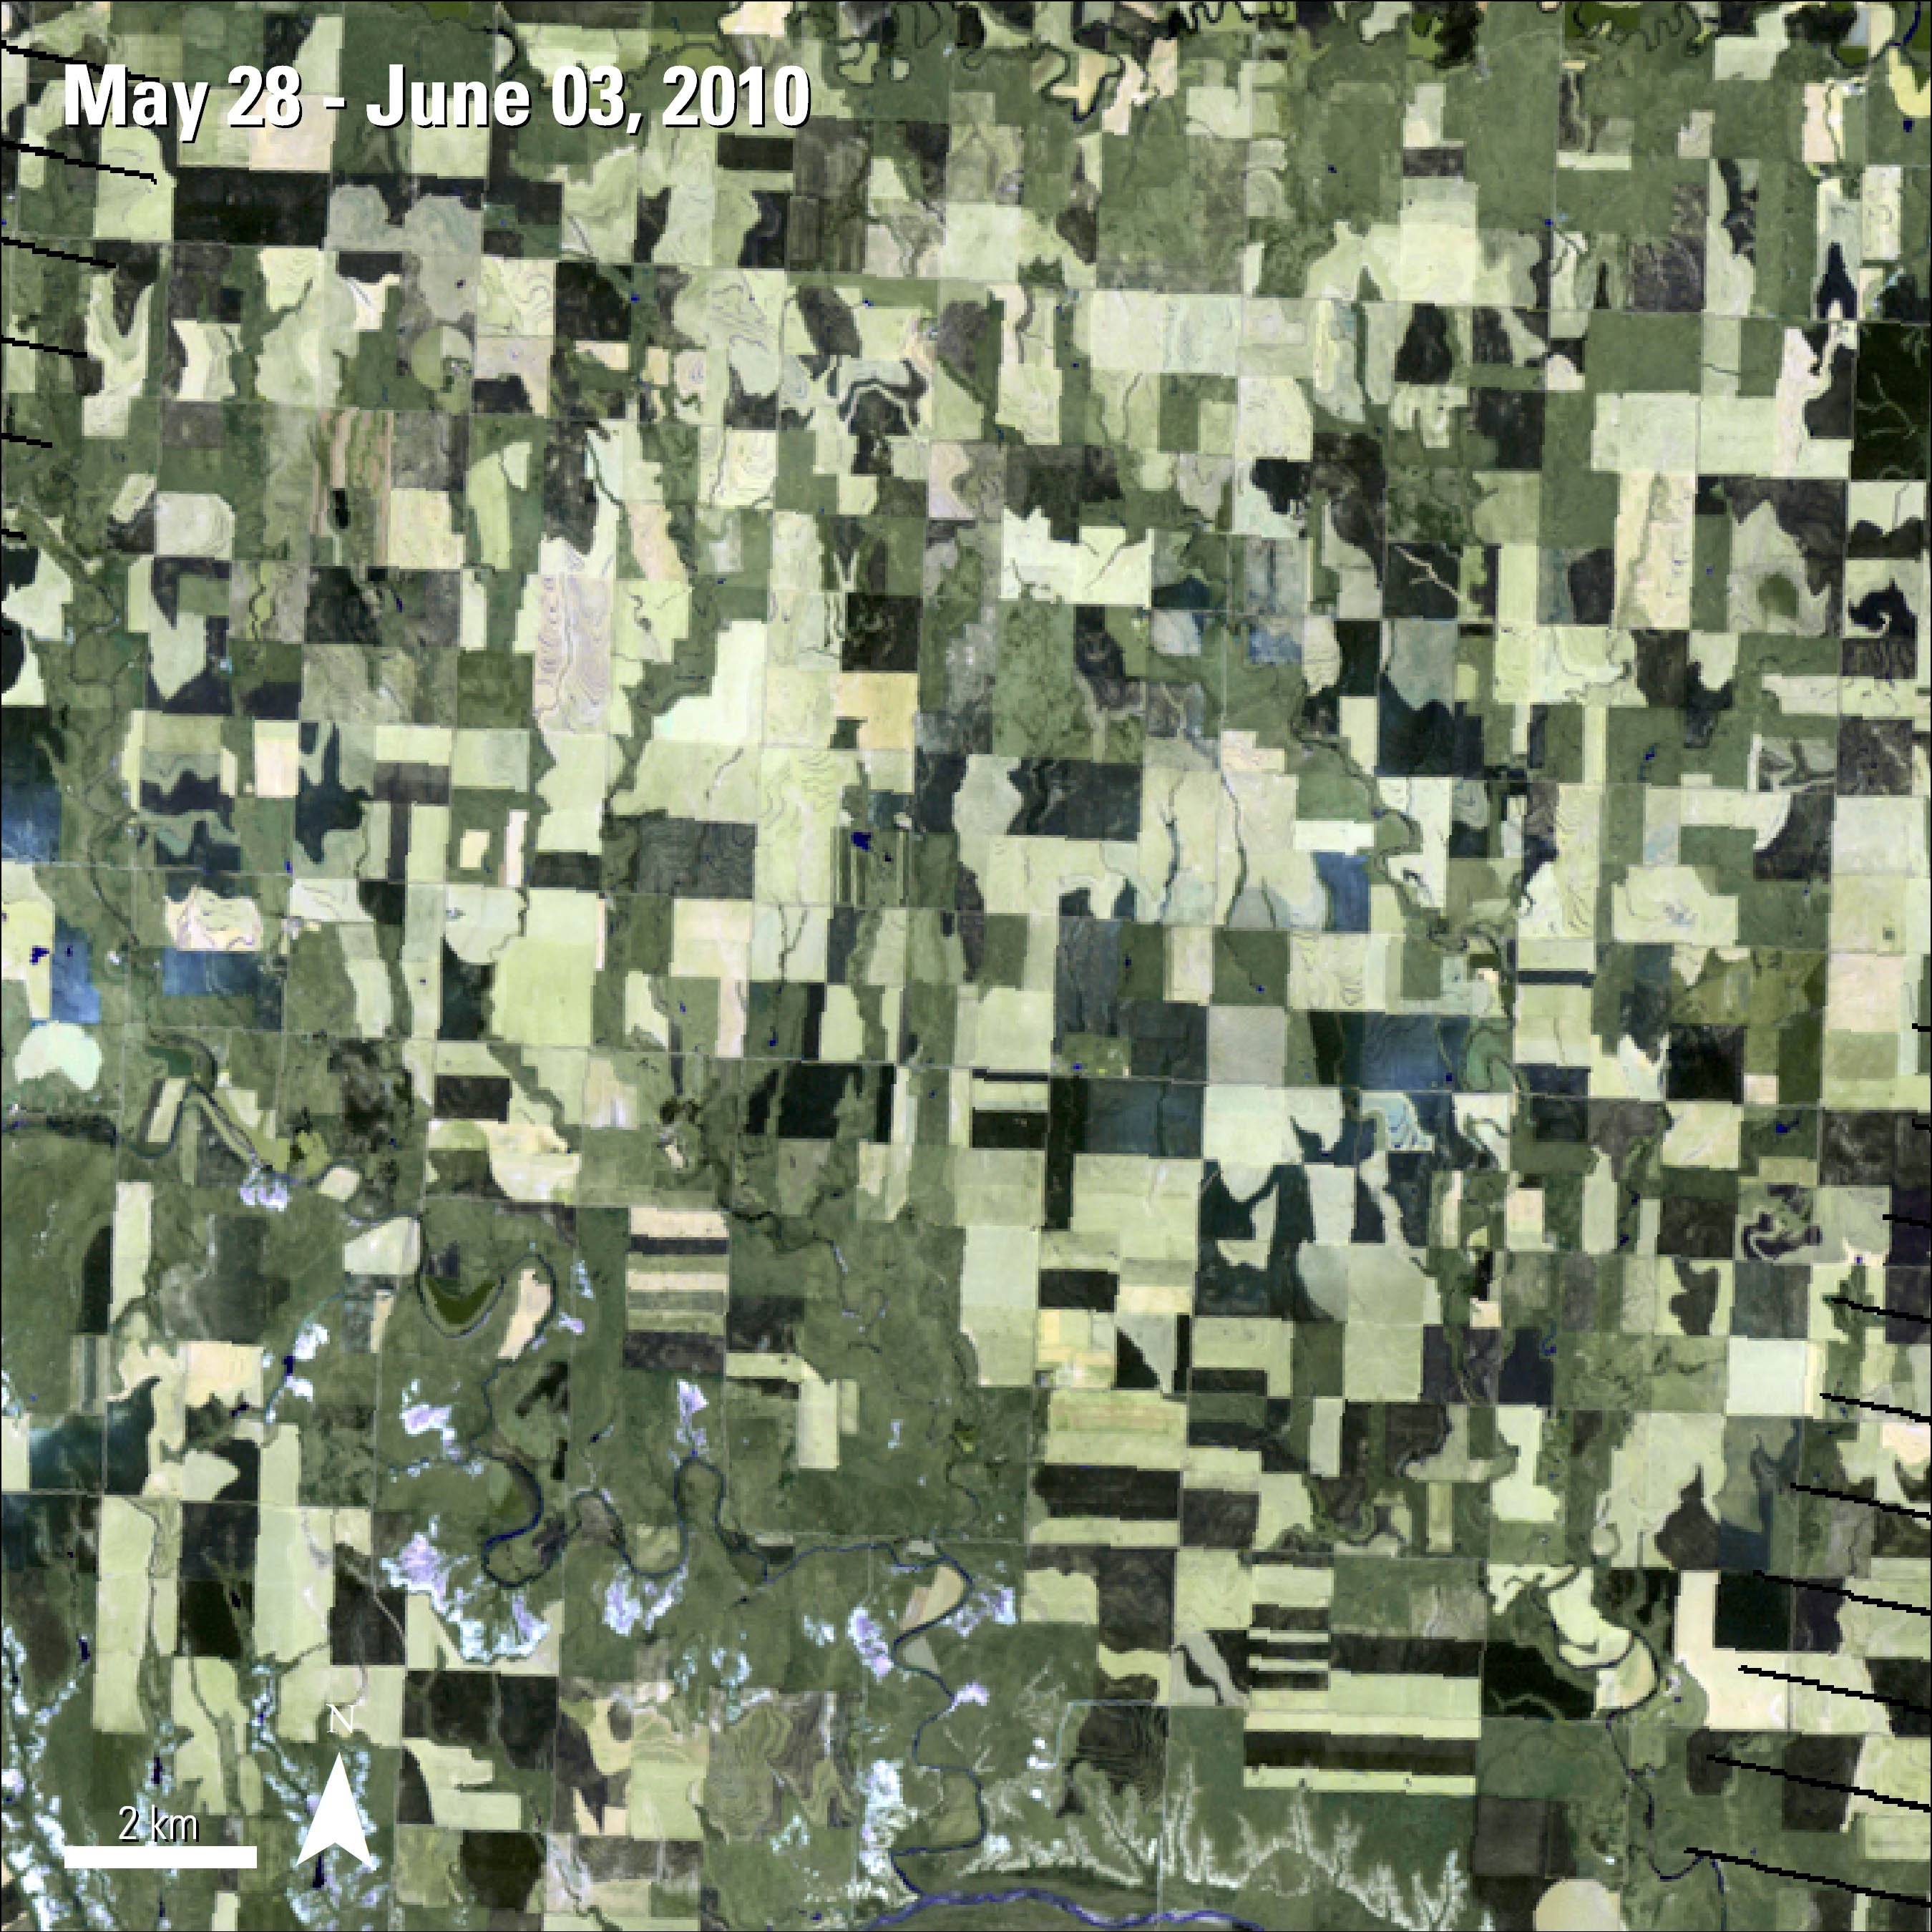
WELD data are useful for extracting agricultural information in the United States. For example, Yan and Roy (2014) use an automated object-based methodology with weekly CONUS WELD data to extract agricultural crop fields in Texas, California, and South Dakota. The authors are able to identify rectangular, center-pivot, and irregularly-shaped agricultural fields from each of these states from 2006 to 2010 by using several algorithms and creating maps from the Normalized Difference Vegetation Index (NDVI) in the weekly WELD product (WELDUSWK). Fields using center-pivot irrigation (the circular fields) and other types of fields in northern Texas are visible in the weekly WELD and summer seasonal WELD images below. Using the authors’ methodology, researchers could automatically identify crops in the weekly WELD image without having to manually examine imagery. The author’s results agree with the Cropland Data Layer (CDL) classification data and independent measurements made by the United States Department of Agriculture (USDA) and the National Agricultural Statistics Service (NASS).
In a recently released publication, Yan and Roy (2016) refine their methodology to extract agricultural crop fields throughout the Midwest and Western United States using weekly CONUS WELD data from December 2009 to November 2010. The refined methodology includes new algorithms with CDL that allow the authors to improve distinguishing crops, like those seen in the above weekly WELD image of western Kansas, from non-crop areas, such as pastures or grasslands. As a result, the authors have produced the first spatially explicit CONUS crop field size maps and crop type information. With this methodology, and future research, researchers can use WELD data to extract agricultural field data specific to their area of interest and observe agricultural field changes more easily. Automated crop mapping can be useful in many future economic and environmental agricultural research projects, especially when used in combination with Landsat, MODIS, and other moderate resolution satellite data information.
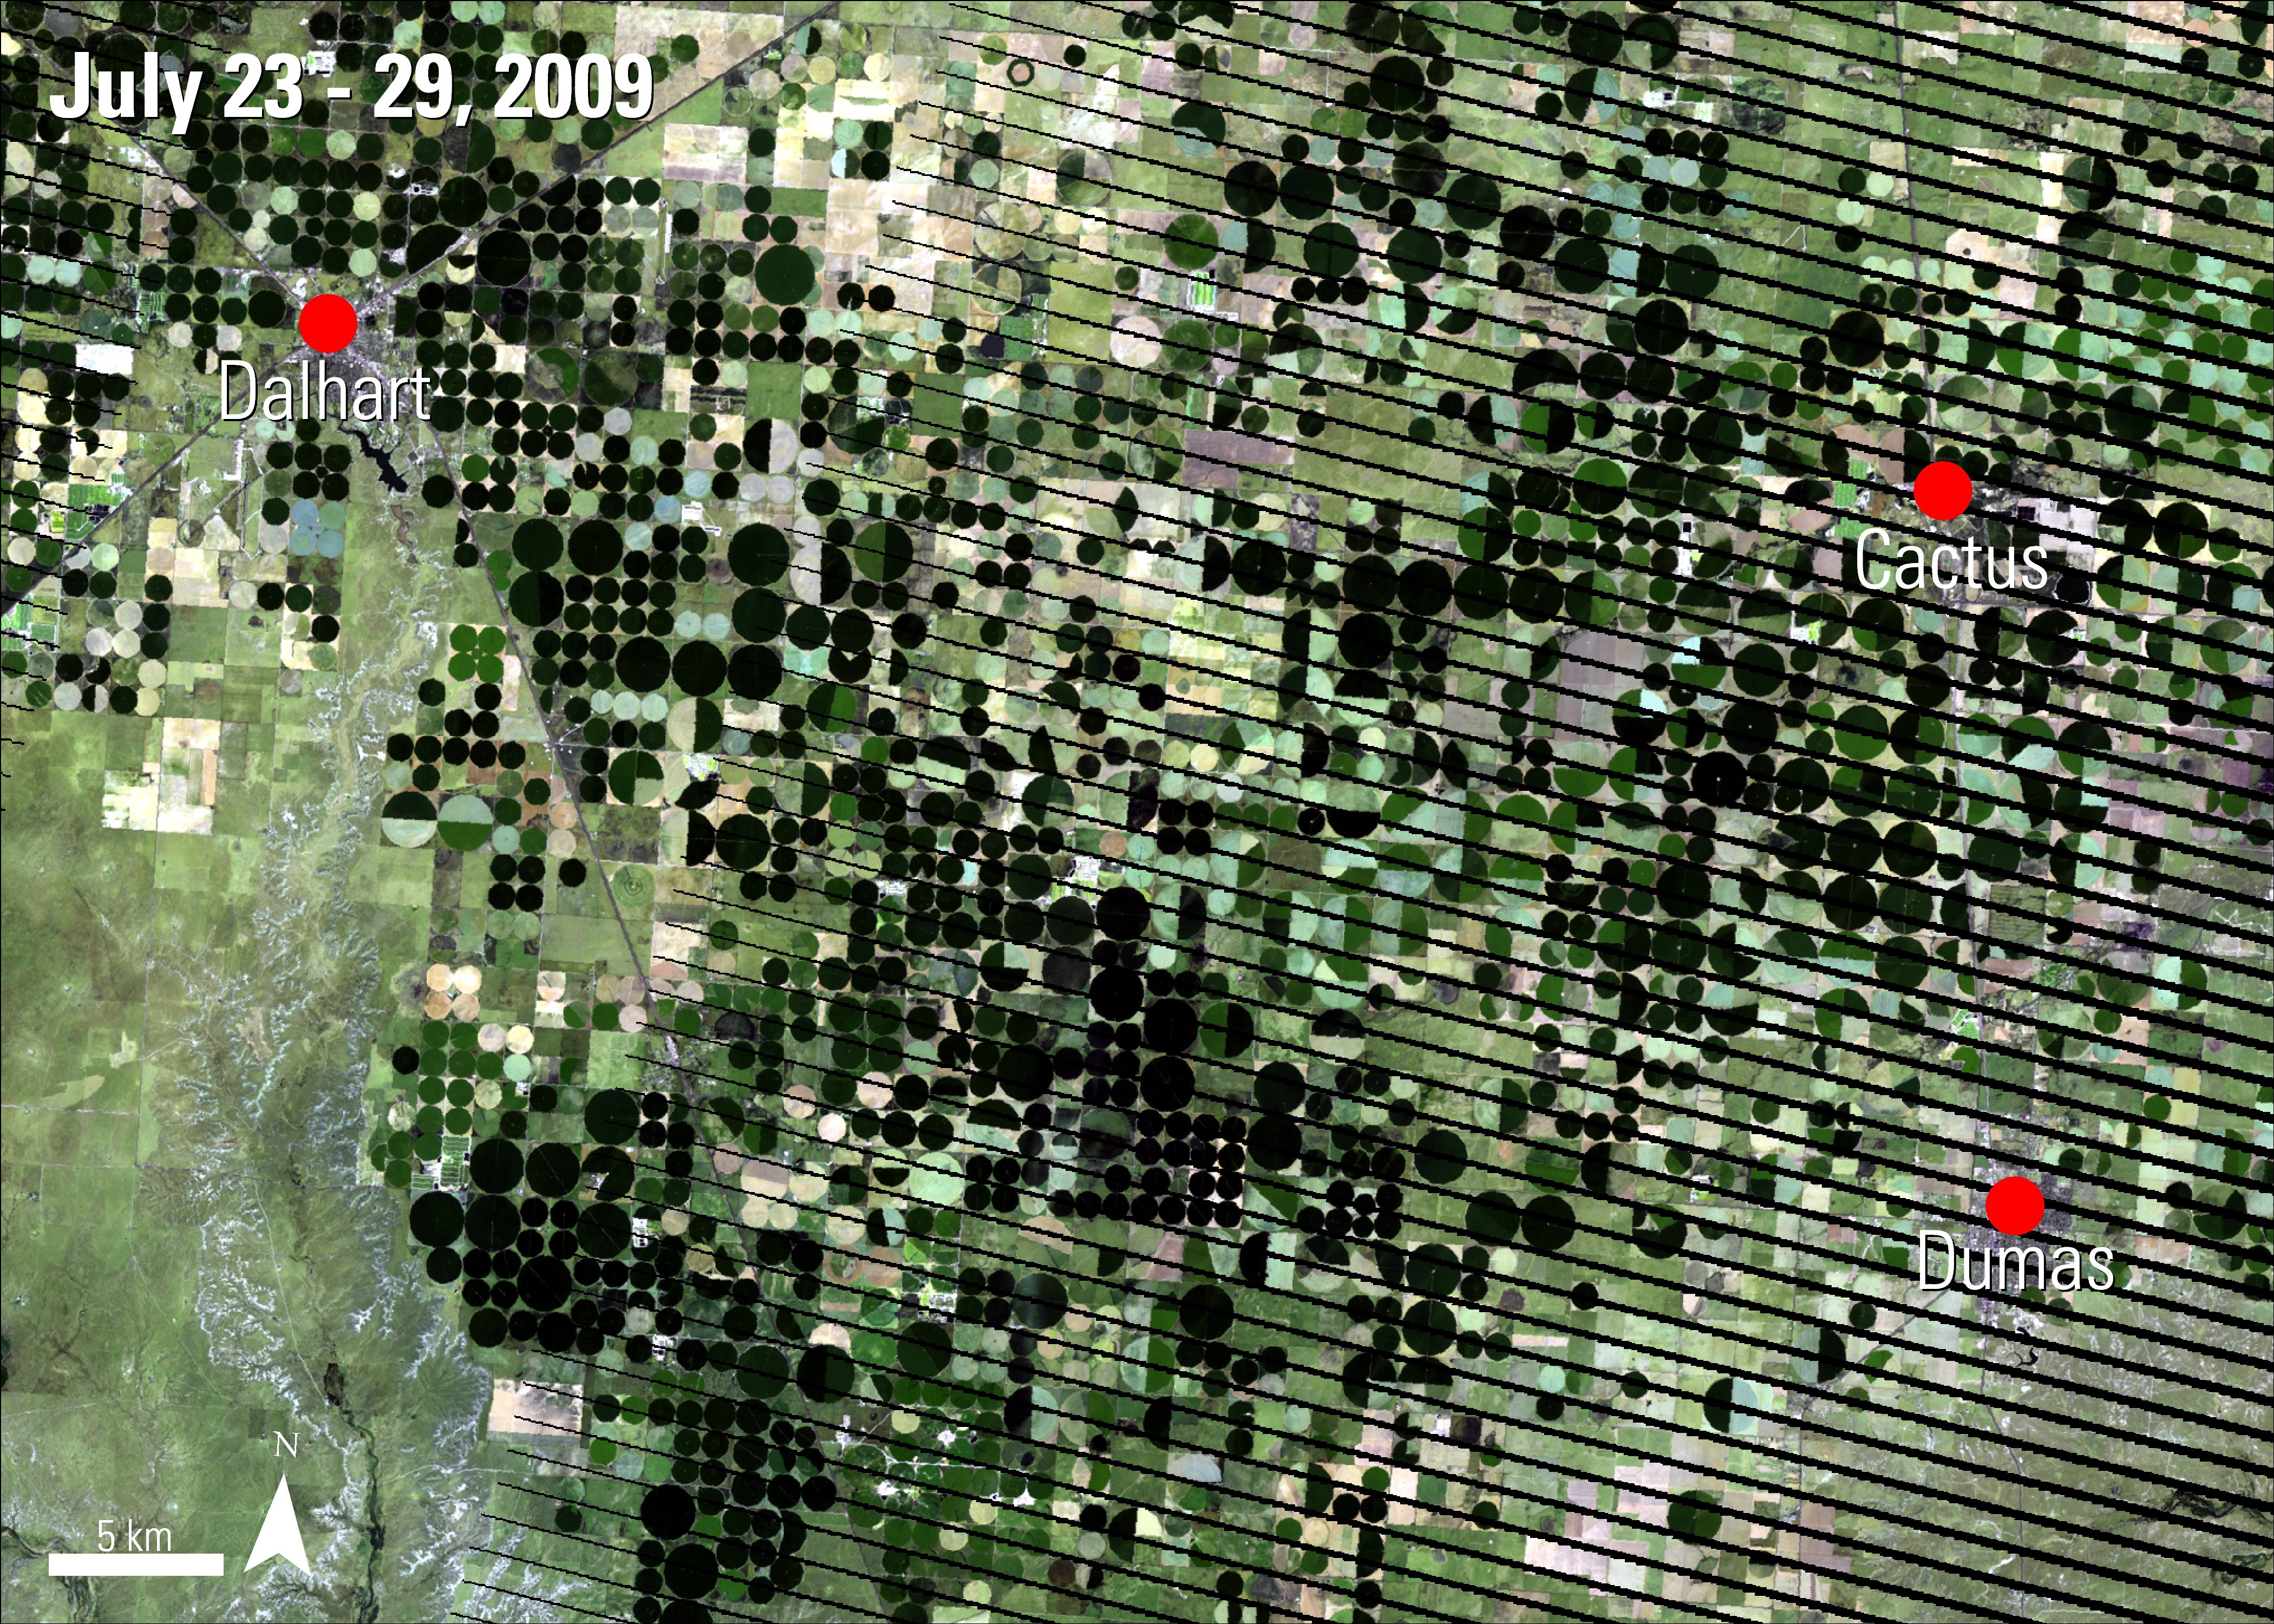
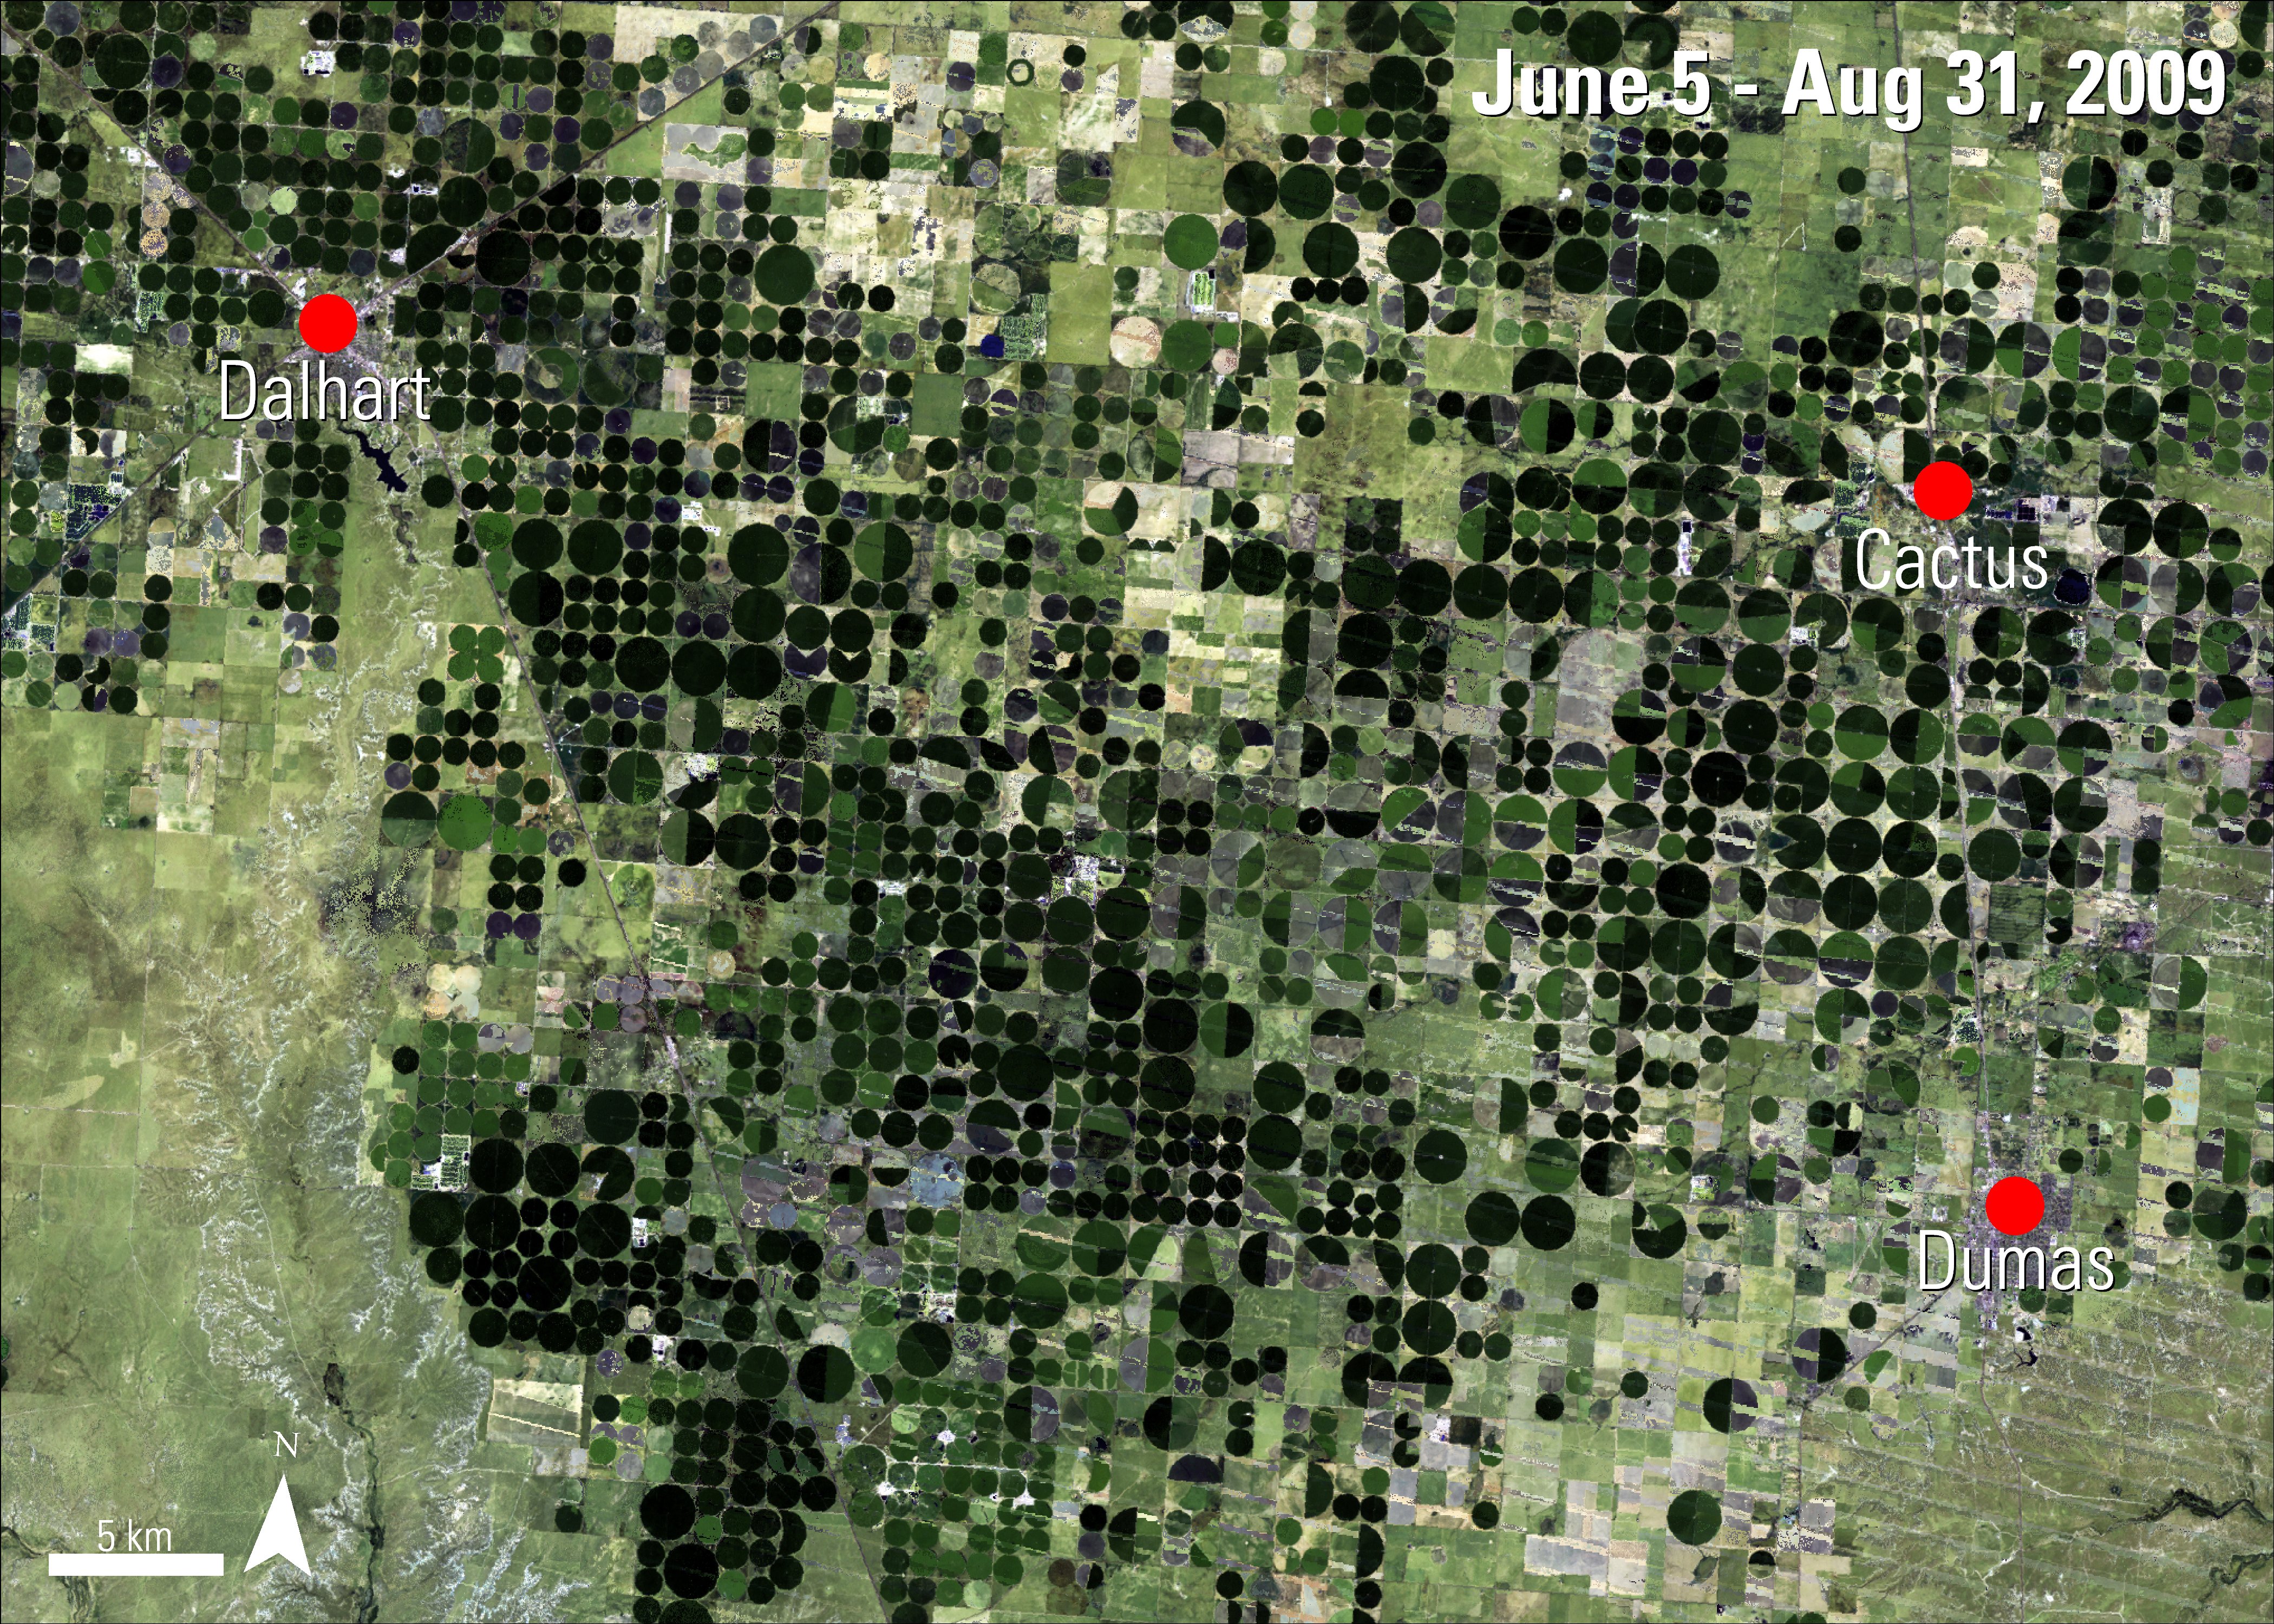
Use the slider tool to compare these false color composites of the weekly and seasonal WELD data products. The two images show center-pivot fields, the circles in the image, in northern Texas. The left image is a CONUS weekly WELD (WELDUSWK) image from 2009. The black lines in the image are due to Landsat scan lines. The image on the right features the same area using the CONUS seasonal WELD (WELDUSSE) data product during summer 2009. Using their object-based methodology, the authors can automatically identify types of agriculture in the area.
Granule ID:
CONUS.week30.2009.h13v12.doy204to204.v1.5.hdf
CONUS.summer.2009.h13v12.doy156to243.v1.5.hdf
More information about WELD data:
WELD data of CONUS are offered as weekly, monthly, seasonal, and annual temporal resolutions.
WELD data of Alaska are offered as weekly, monthly, seasonal, and annual temporal resolutions.
WELD data is also available as a 5-Year Land Cover Land Use Change product.
References: (Author's Note 5/15/2020: At the time of publishing these references were available online, some resources may no longer be available.)
Roy, D., Ju, J., Kline, K., Scaramuzza, P., Kovalskyy, V., Hansen, M., Loveland, T., and Zhang, C., 2010, Web-enabled Landsat Data (WELD): Landsat ETM+ composited mosaics of the conterminous United States: Remote Sensing of Environment, v. 114, p. 35-49, accessed February 16, 2016, at http://dx.doi.org/10.1016/j.rse.2009.08.011.
U .S. Geological Survey, 2015, Web-enabled Landsat data (Weld Projects): Landsat missions, accessed February 16, 2016, at https://landsat.usgs.gov/WELD.php.
U .S. Geological Survey, 2012, Weld: web-enabled Landsat data: U.S. Geological Survey, accessed February 16, 2016, at http://weld.cr.usgs.gov/.
Yan, L., and Roy, D., 2014, Automated crop field extraction from multi-temporal Web Enabled Landsat Data: Remote Sensing of Environment, v. 144, p. 42-64, accessed February 18, 2016, at http://dx.doi.org/10.1016/j.rse.2014.01.006.
Yan, L., and Roy, D., 2016, Conterminous United States crop field size quantification from multi-temporal Landsat data: Remote Sensing of Environment, v. 172, p. 67-86, accessed February 18, 2016, at http://dx.doi.org/10.1016/j.rse.2015.10.034.
Material written by Danielle Golon1
1 Innovate!, Inc., contractor to the U.S. Geological Survey, Earth Resources Observation and Science (EROS) Center, Sioux Falls, South Dakota, USA. Work performed under USGS contract G15PD00766 for LP DAAC2.
2 LP DAAC Work performed under NASA contract NNG14HH33I.