eBird is a community citizen science (CS) driven project developed by the Cornell Lab of Ornithology to help advance bird related science, conservation, and education efforts. First launched in 2002, eBird allows birdwatchers around the world to submit their bird observations, via their free application, to identify when, where, and how they observed various birds. Observations are reviewed by experts for quality and then made available to the public. Over 100 million observations have been reported and these observations have been used to support conservation and research efforts.
The eBird team just recently developed interactive Trends Map Web Application to help visualize and describe population occurrence and change for over 1,000 bird species using eBird data. Using this web application scientists and bird enthusiasts alike can look at “Abundance” or the amount of individuals birds observed by expert e-birders for that species, the weekly estimate of the abundance for every week of the year, trends of that bird’s abundance during its breeding season, and the boundary of that specific bird’s range during the different points of its annual cycle (Fink and others 2022). This information can help researchers determine the overall health of a population using a global snapshot rather than a localized idea. State and regional statistics are also made available through the map, which allows users to further specify the region they are interested in and how bird species occupy that space throughout the year.
To create these various maps, the eBird team combines the expert eBirder observations with geospatial data, including remote sensing data products distributed by NASA’s Land Processes Distributed Active Archive Center (LP DAAC). Data that is collected from eBird users are used in statistical models to create visual maps and images related to the different tab functions on the map. The LP DAAC Data products include the Terra and Aqua combined Moderate Resolution Imaging Spectroradiometer (MODIS) Land Cover Type (MCD12Q1) and Yearly Land Water Mask (MOD44W), as well as the Terra Advanced Spaceborne Thermal Emission and Reflection Radiometer (ASTER) Global Water Bodies Database (ASTWBD) and Global digital Elevation Model (ASTGTM). The MODIS product was used specifically for its temporal ability to capture land cover, use, and hydrology. Twenty-one vegetative indexes are used to describe and identify each pixel generated by MODIS and ASTER.
The Western Meadowlark ( Sturnella neglecta) is a species common to the Midwest in the United States and is the state bird of North Dakota as well as several other states. The bird is commonly found in flocks throughout agricultural field and short prairie grasslands. Using the eBird trends map web application, North Dakota birders can examine when they might expect to get a glimpse of the state bird. As shown in the Map 1 below, typically the Western Meadowlark is found in the state of North Dakota during its breeding season from May 10-August 24. However, North Dakota birders might still see the bird during the pre and post breeding season as well.
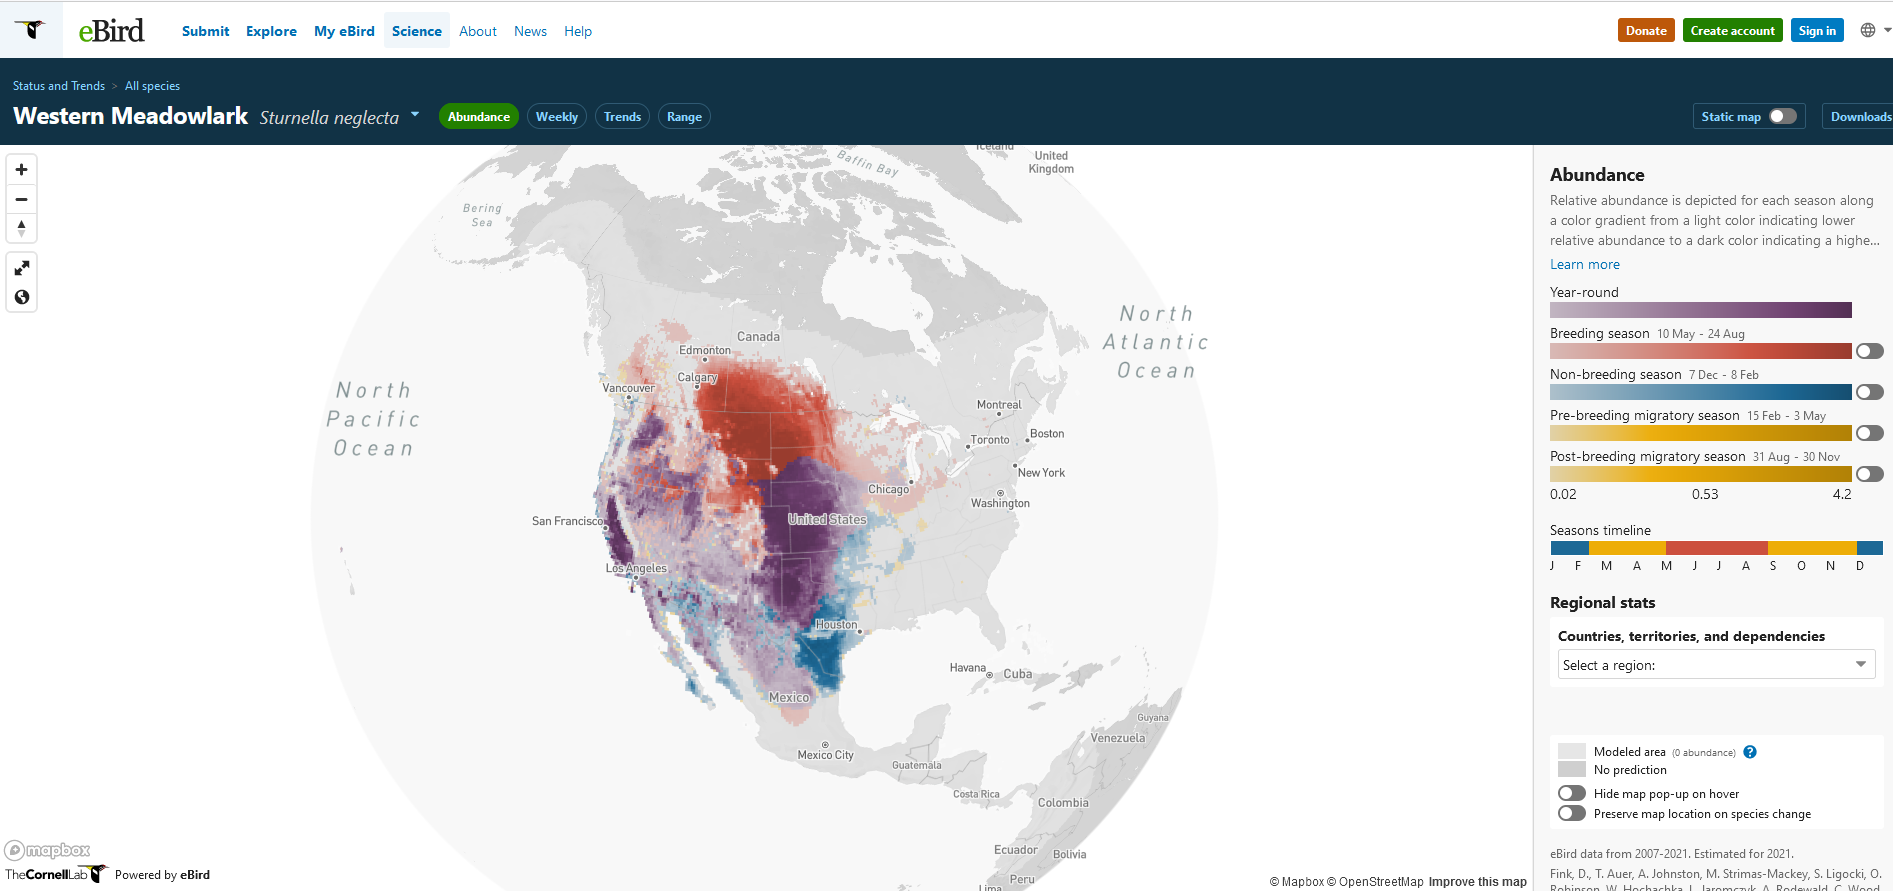
The Abundance tab shows the relative abundance of a species via a color a gradient that indicates lower relative abundance (light color) to high relative abundance (dark color). Year-round abundance is shown in purple, abundance during the breeding seasons is shown in red, the non-breeding season is shown in blue, and the pre and post breeding seasons are shown in shades of yellow. In the case of the Western Meadowlark, while the year-round abundance occurs throughout the Midwest of the United States, the spread of abundance of the Western Meadowlark moves to the north during breeding season and further south during non-breeding season.
Map of Abundance created by The Cornell Lab of Ornithology (2023)
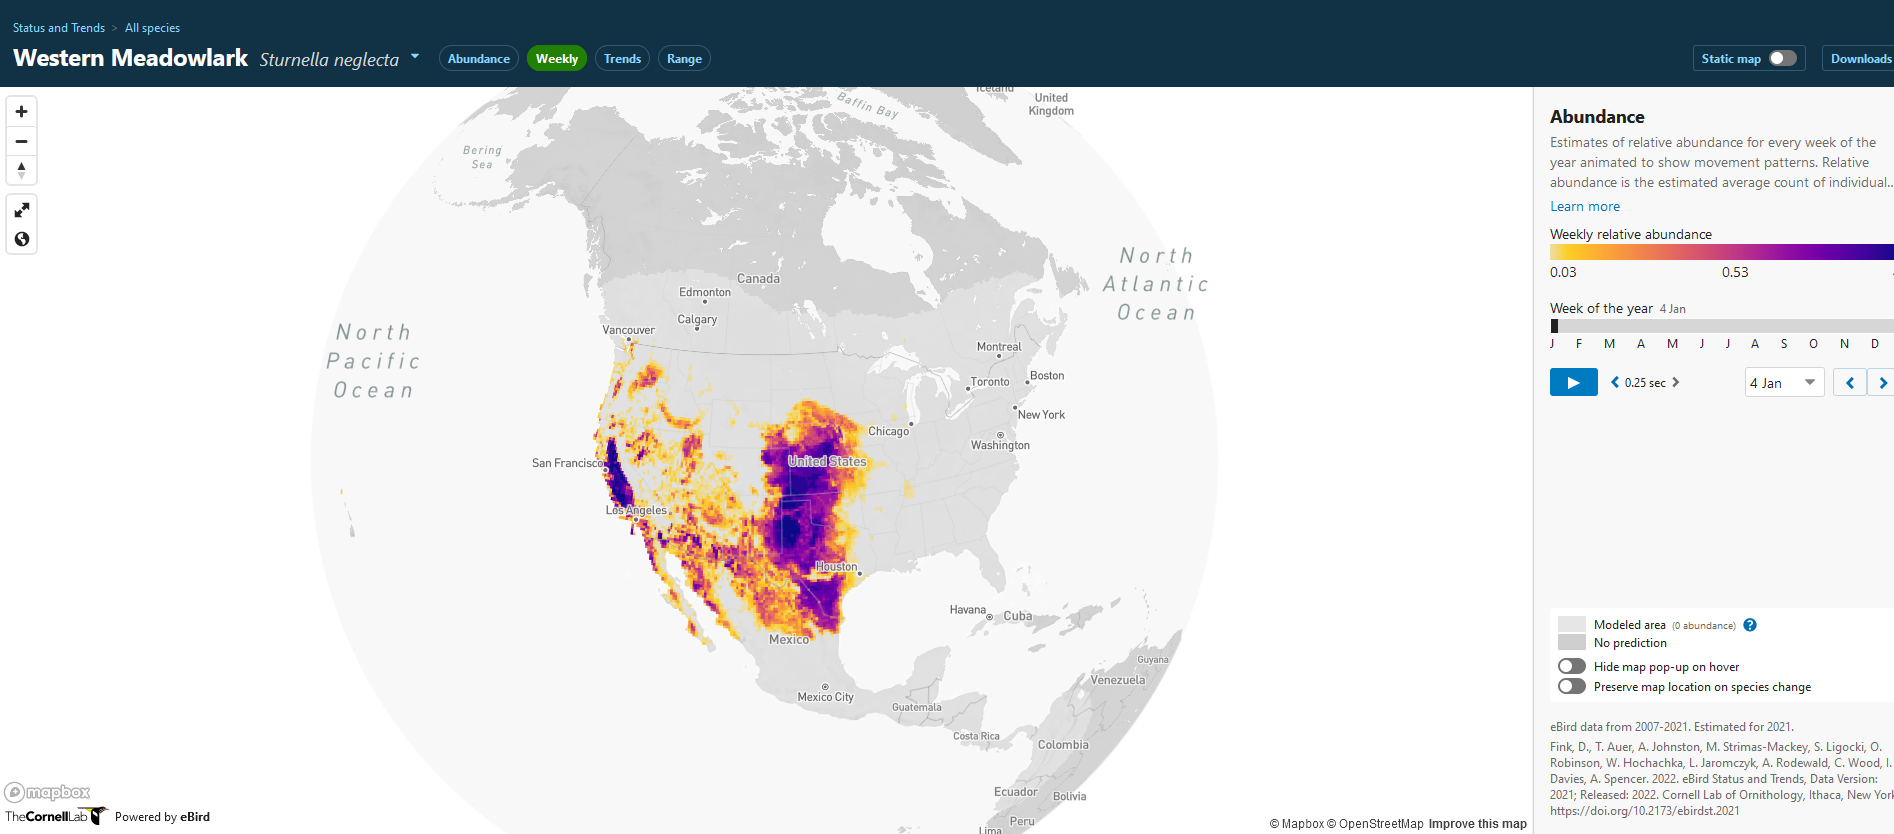
The Weekly tab trend shows the movement patterns of the Western Meadowlark every week of the year. The animation estimates the location you would most likely find this bird. Low abundance is shown as shades of yellow while high abundance is shown in shades of purple. By clicking on the animation, users can see how abundance changes each month of the year and are able to specifically look at certain weeks throughout the year by choosing a week in the drop-down box. Movement is shown for the Western Meadowlark as it goes north for the breeding seasons and south for the non-breeding seasons.
Map of Weekly Abundance created by The Cornell Lab of Ornithology (2023)
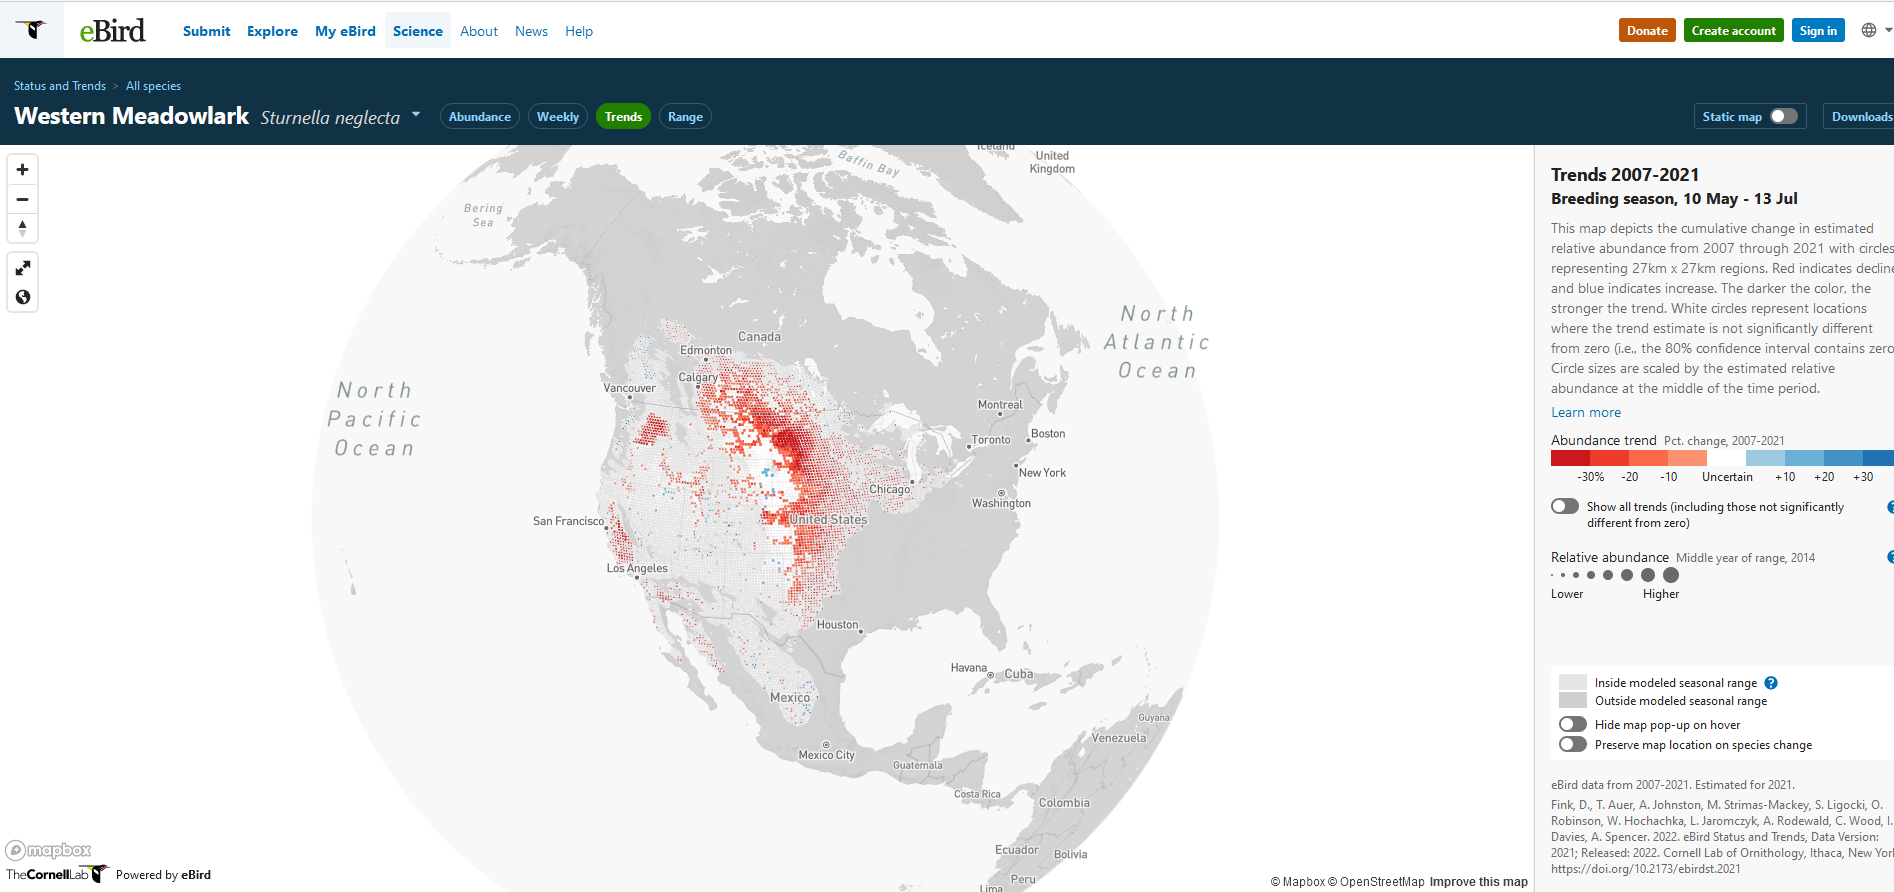
The Trends tab shows the overall change in the species abundance with red dots indicating a decline with darker red dots indicate a stronger change. Blue dots indicate an increase in abundance and white dots show no difference in abundance. The size of the dot is estimated by the relative abundance in the middle of that time period. Percentage of change is taken from the year 2007 through 2021. The Western Meadowlark is shown as decreasing in relative abundance throughout much of the western Midwest however an increase is seen in further west states such as Wyoming, Utah, and Nevada.
Map of Trends created by The Cornell Lab of Ornithology (2023)

The Range tab shows the boundary of the species and the estimation that the species is present within that area. Year-round observations are shown in purple, and the Western Meadowlarks range is shown through much of the Midwest and the western part of the United States. The breeding season is shown in red and the Western Meadowlark heads to the north of the United States and into Canada. Pre and post breeding seasons are shown in yellow. A seasonal timeline is available, and color coordinated with which season the species is in and where you would most likely be able to observe it. Regional statistics are also available through the drop-down box and available for your specific area of interest.
Map of Range created by The Cornell Lab of Ornithology (2023)
The Abundance tab shows the relative abundance of a species via a color a gradient that indicates lower relative abundance (light color) to high relative abundance (dark color). Year-round abundance is shown in purple, abundance during the breeding seasons is shown in red, the non-breeding season is shown in blue, and the pre and post breeding seasons are shown in shades of yellow. In the case of the Western Meadowlark, while the year-round abundance occurs throughout the Midwest of the United States, the spread of abundance of the Western Meadowlark moves to the north during breeding season and further south during non-breeding season.
Map of Abundance created by The Cornell Lab of Ornithology (2023)
The Weekly tab trend shows the movement patterns of the Western Meadowlark every week of the year. The animation estimates the location you would most likely find this bird. Low abundance is shown as shades of yellow while high abundance is shown in shades of purple. By clicking on the animation, users can see how abundance changes each month of the year and are able to specifically look at certain weeks throughout the year by choosing a week in the drop-down box. Movement is shown for the Western Meadowlark as it goes north for the breeding seasons and south for the non-breeding seasons.
Map of Weekly Abundance created by The Cornell Lab of Ornithology (2023)
The Trends tab shows the overall change in the species abundance with red dots indicating a decline with darker red dots indicate a stronger change. Blue dots indicate an increase in abundance and white dots show no difference in abundance. The size of the dot is estimated by the relative abundance in the middle of that time period. Percentage of change is taken from the year 2007 through 2021. The Western Meadowlark is shown as decreasing in relative abundance throughout much of the western Midwest however an increase is seen in further west states such as Wyoming, Utah, and Nevada.
Map of Trends created by The Cornell Lab of Ornithology (2023)
The Range tab shows the boundary of the species and the estimation that the species is present within that area. Year-round observations are shown in purple, and the Western Meadowlarks range is shown through much of the Midwest and the western part of the United States. The breeding season is shown in red and the Western Meadowlark heads to the north of the United States and into Canada. Pre and post breeding seasons are shown in yellow. A seasonal timeline is available, and color coordinated with which season the species is in and where you would most likely be able to observe it. Regional statistics are also available through the drop-down box and available for your specific area of interest.
Map of Range created by The Cornell Lab of Ornithology (2023)


For users interested in only visual maps the Trends map are a very useful tool. However, for users that are more interested in a statistical analysis approach, eBird also offers RStudio scripts that work directly with their data. The document Best Practices for Using eBird Data has step by steps instructions that allow users to extract data and introduce their own habitat and environmental variables by working directly with the LP DAAC satellite-based land cover products (MODIS and ASTER) and other datasets mentioned above (Strimas-Mackey,M. and others 2020). Full tutorials for modeling occupancy, encounter rate, and relative abundance are also available.
As a part of the open science initiative, all eBird data is free to the public along with the scripts and tutorials developed by the scientists at The Cornell Lab of Ornithology.
References
Carroll, M., DiMiceli, C., Wooten, M., Hubbard, A., Sohlberg, R., Townshend, J. (2017). MOD44W MODIS/Terra Land Water Mask Derived from MODIS and SRTM L3 Global 250m SIN Grid V006 [Data set]. NASA EOSDIS Land Processes DAAC. Accessed 2023-03-29 from https://doi.org/10.5067/MODIS/MOD44W.006
eBird Status and Trends. eBird. (n.d.). Retrieved April 4, 2023, from https://science.ebird.org/en/status-and-trends
Fink, D., T. Auer, A. Johnston, M. Strimas-Mackey, S. Ligocki, O. Robinson, W. Hochachka, L. Jaromczyk, A. Rodewald, C. Wood, I. Davies, A. Spencer. 2022. eBird Status and Trends, Data Version: 2021; Released: 2022. Cornell Lab of Ornithology, Ithaca, New York. https://doi.org/10.2173/ebirdst.2021
Friedl, M., Sulla-Menashe, D. (2022). MODIS/Terra+Aqua Land Cover Type Yearly L3 Global 500m SIN Grid V061 [Data set]. NASA EOSDIS Land Processes DAAC. Accessed 2023-03-29 from https://doi.org/10.5067/MODIS/MCD12Q1.061
Murray, N.J., Phinn, S.R., DeWitt, M. et al. The global distribution and trajectory of tidal flats. Nature 565, 222–225 (2019). https://doi.org/10.1038/s41586-018-0805-8
NASA/METI/AIST/Japan Spacesystems and U.S./Japan ASTER Science Team (2019). ASTER Global Water Bodies Database V001 [Data set]. NASA EOSDIS Land Processes DAAC. Accessed 2023-03-29 from https://doi.org/10.5067/ASTER/ASTWBD.001
NASA/METI/AIST/Japan Spacesystems and U.S./Japan ASTER Science Team (2019). ASTER Global Digital Elevation Model V003 [Data set]. NASA EOSDIS Land Processes DAAC. Accessed 2023-03-29 from https://doi.org/10.5067/ASTER/ASTGTM.003
Sayre, R., S. Noble, S. Hamann, R. Smith, D. Wright, S. Breyer, K. Butler, K. Van Graafeiland, C. Frye, D. Karagulle, D. Hopkins, D. Stephens, K. Kelly, Z, basher, D. Burton, J. Cress, K. Atkins, D. van Sistine, B. Friesen, B. Allee, T. Allen, P. Aniello, I Asaad, M. Costello, K. Goodin, P. Harris, M. Kavanaugh, H. Lillis, E. Manca, F. Muller-Karger, B. Nyberg, R. Parsons, J. Saarinen, J. Steiner, and A. Reed. 2018. A new 30-meter resolution global shoreline vector and associated global islands database for the development of standardized global ecological coastal units. Journal of Operational Oceanography – A Special Blue Planet Edition. DOI:10.1080/1755876X.2018.1529714. https://doi.org/10.1080/1755876X.2018.1529714
Strimas-Mackey, M., W.M. Hochachka, V. Ruiz-Gutierrez, O.J. Robinson, E.T. Miller, T. Auer, S. Kelling, D. Fink, A. Johnston. 2020. Best Practices for Using eBird Data. Version 1.0. https://cornelllabofornithology.github.io/ebird-best-practices/. Cornell Lab of Ornithology, Ithaca, New York. https://doi.org/10.5281/zenodo.3620739