Data products from the Land Processes (LP) Distributed Active Archive Center (DAAC) are used in many different applications. They play an important role in modeling, help to detect changes to the landscape, and are a way to assess ecosystem variables, to name a few. Three of those applications, published between July and September 2016, are highlighted below. A more exhaustive, albeit not complete, list can be accessed via the LP DAAC Publications webpage.
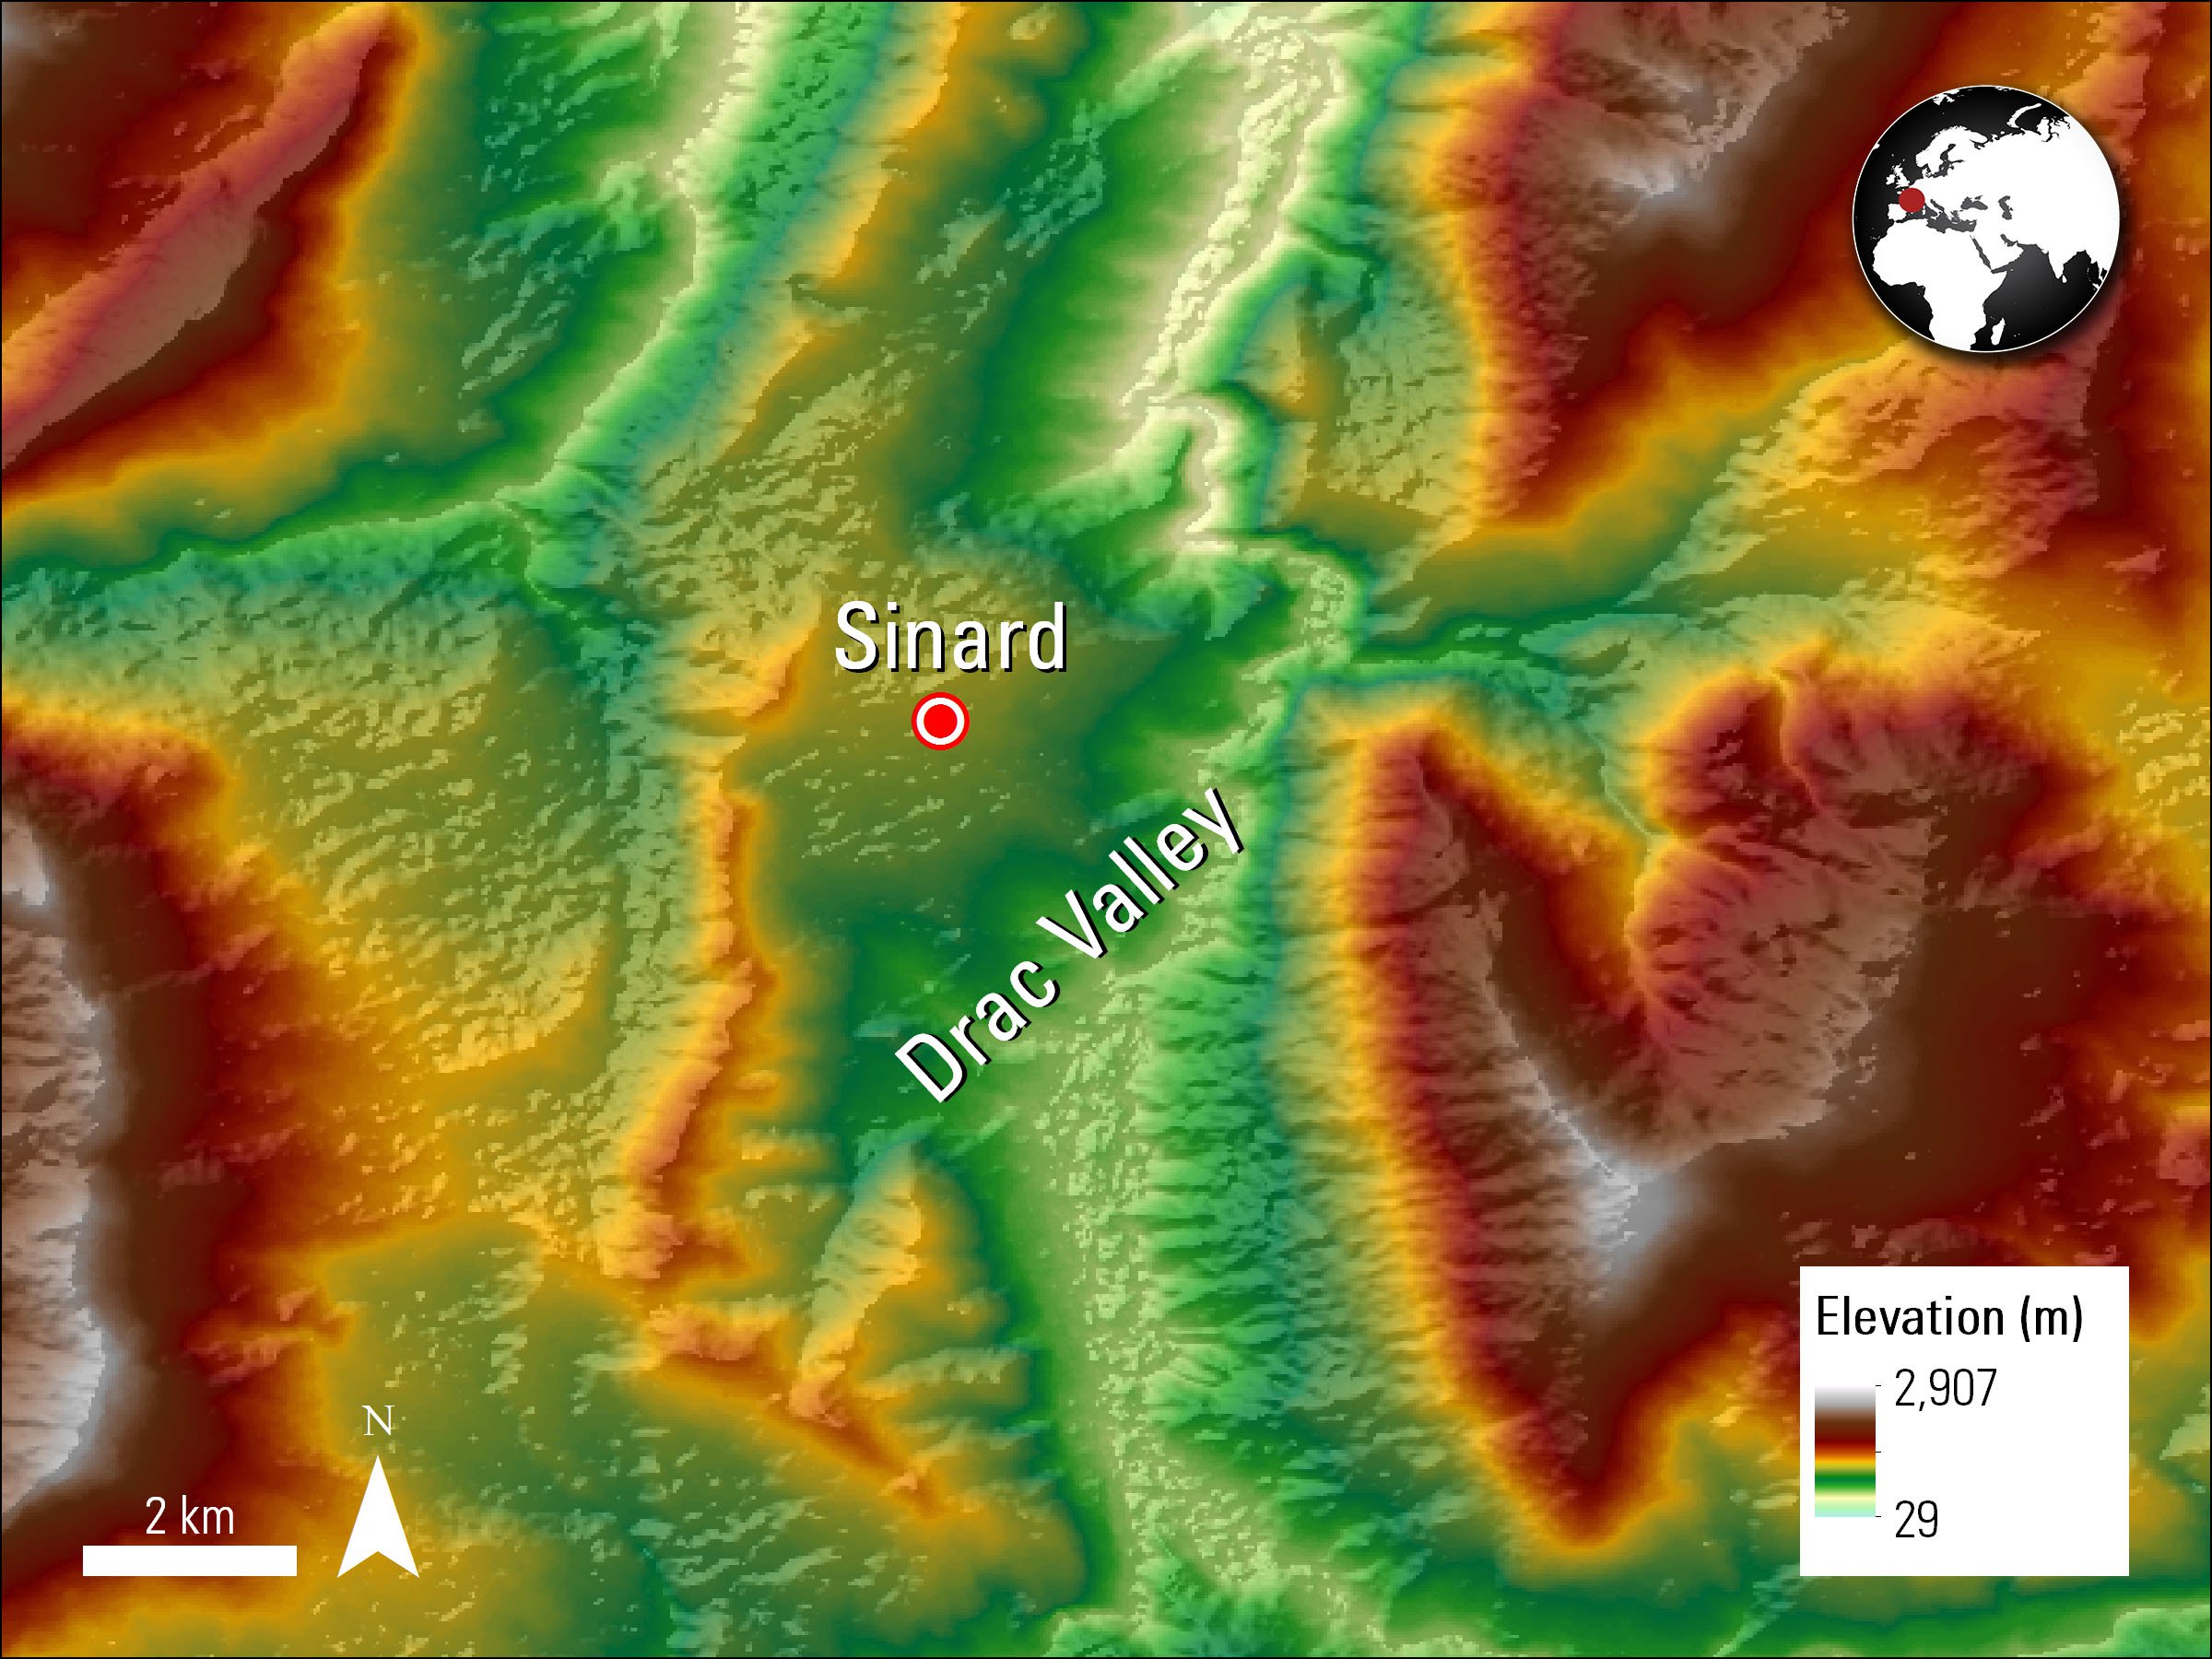
This image was created using the ASTER Global Digital Elevation Model (GDEM) product and shows the elevation of the area around the Drac Valley, where the Harmaliere landslide occurred. The image has been enhanced with a hillshade effect. ASTER GDEM is a product of NASA and METI.
Granule IDs:
ASTGTM2_N45E005_dem
ASTGTM2_N44E005_dem
Fernandez, P., and Whitworth M., 2016, A new technique for the detection of large scale landslides in glacio-lacustrine deposits using image correlation based upon aerial imagery—A case study from the French Alps: International Journal of Applied Earth Observation and Geoinformation, v. 52, p. 1-11. [Also available at http://dx.doi.org/10.1016/j.jag.2016.05.002].
This study looked at the Harmaliere landslide in the French Alps using aerial photography from 2001 to 2003, the Terra Advanced Spaceborne Thermal Emission and Reflection Radiometer (ASTER) Global Digital Elevation Model (GDEM) Version 2, and Global Positioning System (GPS) ground control data. In March 1981, the Harmaliere landslide occurred near the village of Sinard in the Drac Valley of the French Alps, shown in the image to the left. Fernandez and Whitworth’s (2016) study uses software to correlate aerial images, and then uses those images to detect changes over time in the landslide area. The authors chose to use ASTER GDEM data to correct for high relief related distortions and topographic effects the software found while matching aerial images. Fernandez and Whitworth (2016) report movement and deformation, particularly in the western flank of the landslide, which had not been previously identified. Their results can potentially show patterns for future movement in the Harmaliere landslide area. The authors state that the method used in their study can also be applied to other areas that have been captured with aerial imagery for a long time span and contain good ground control data.
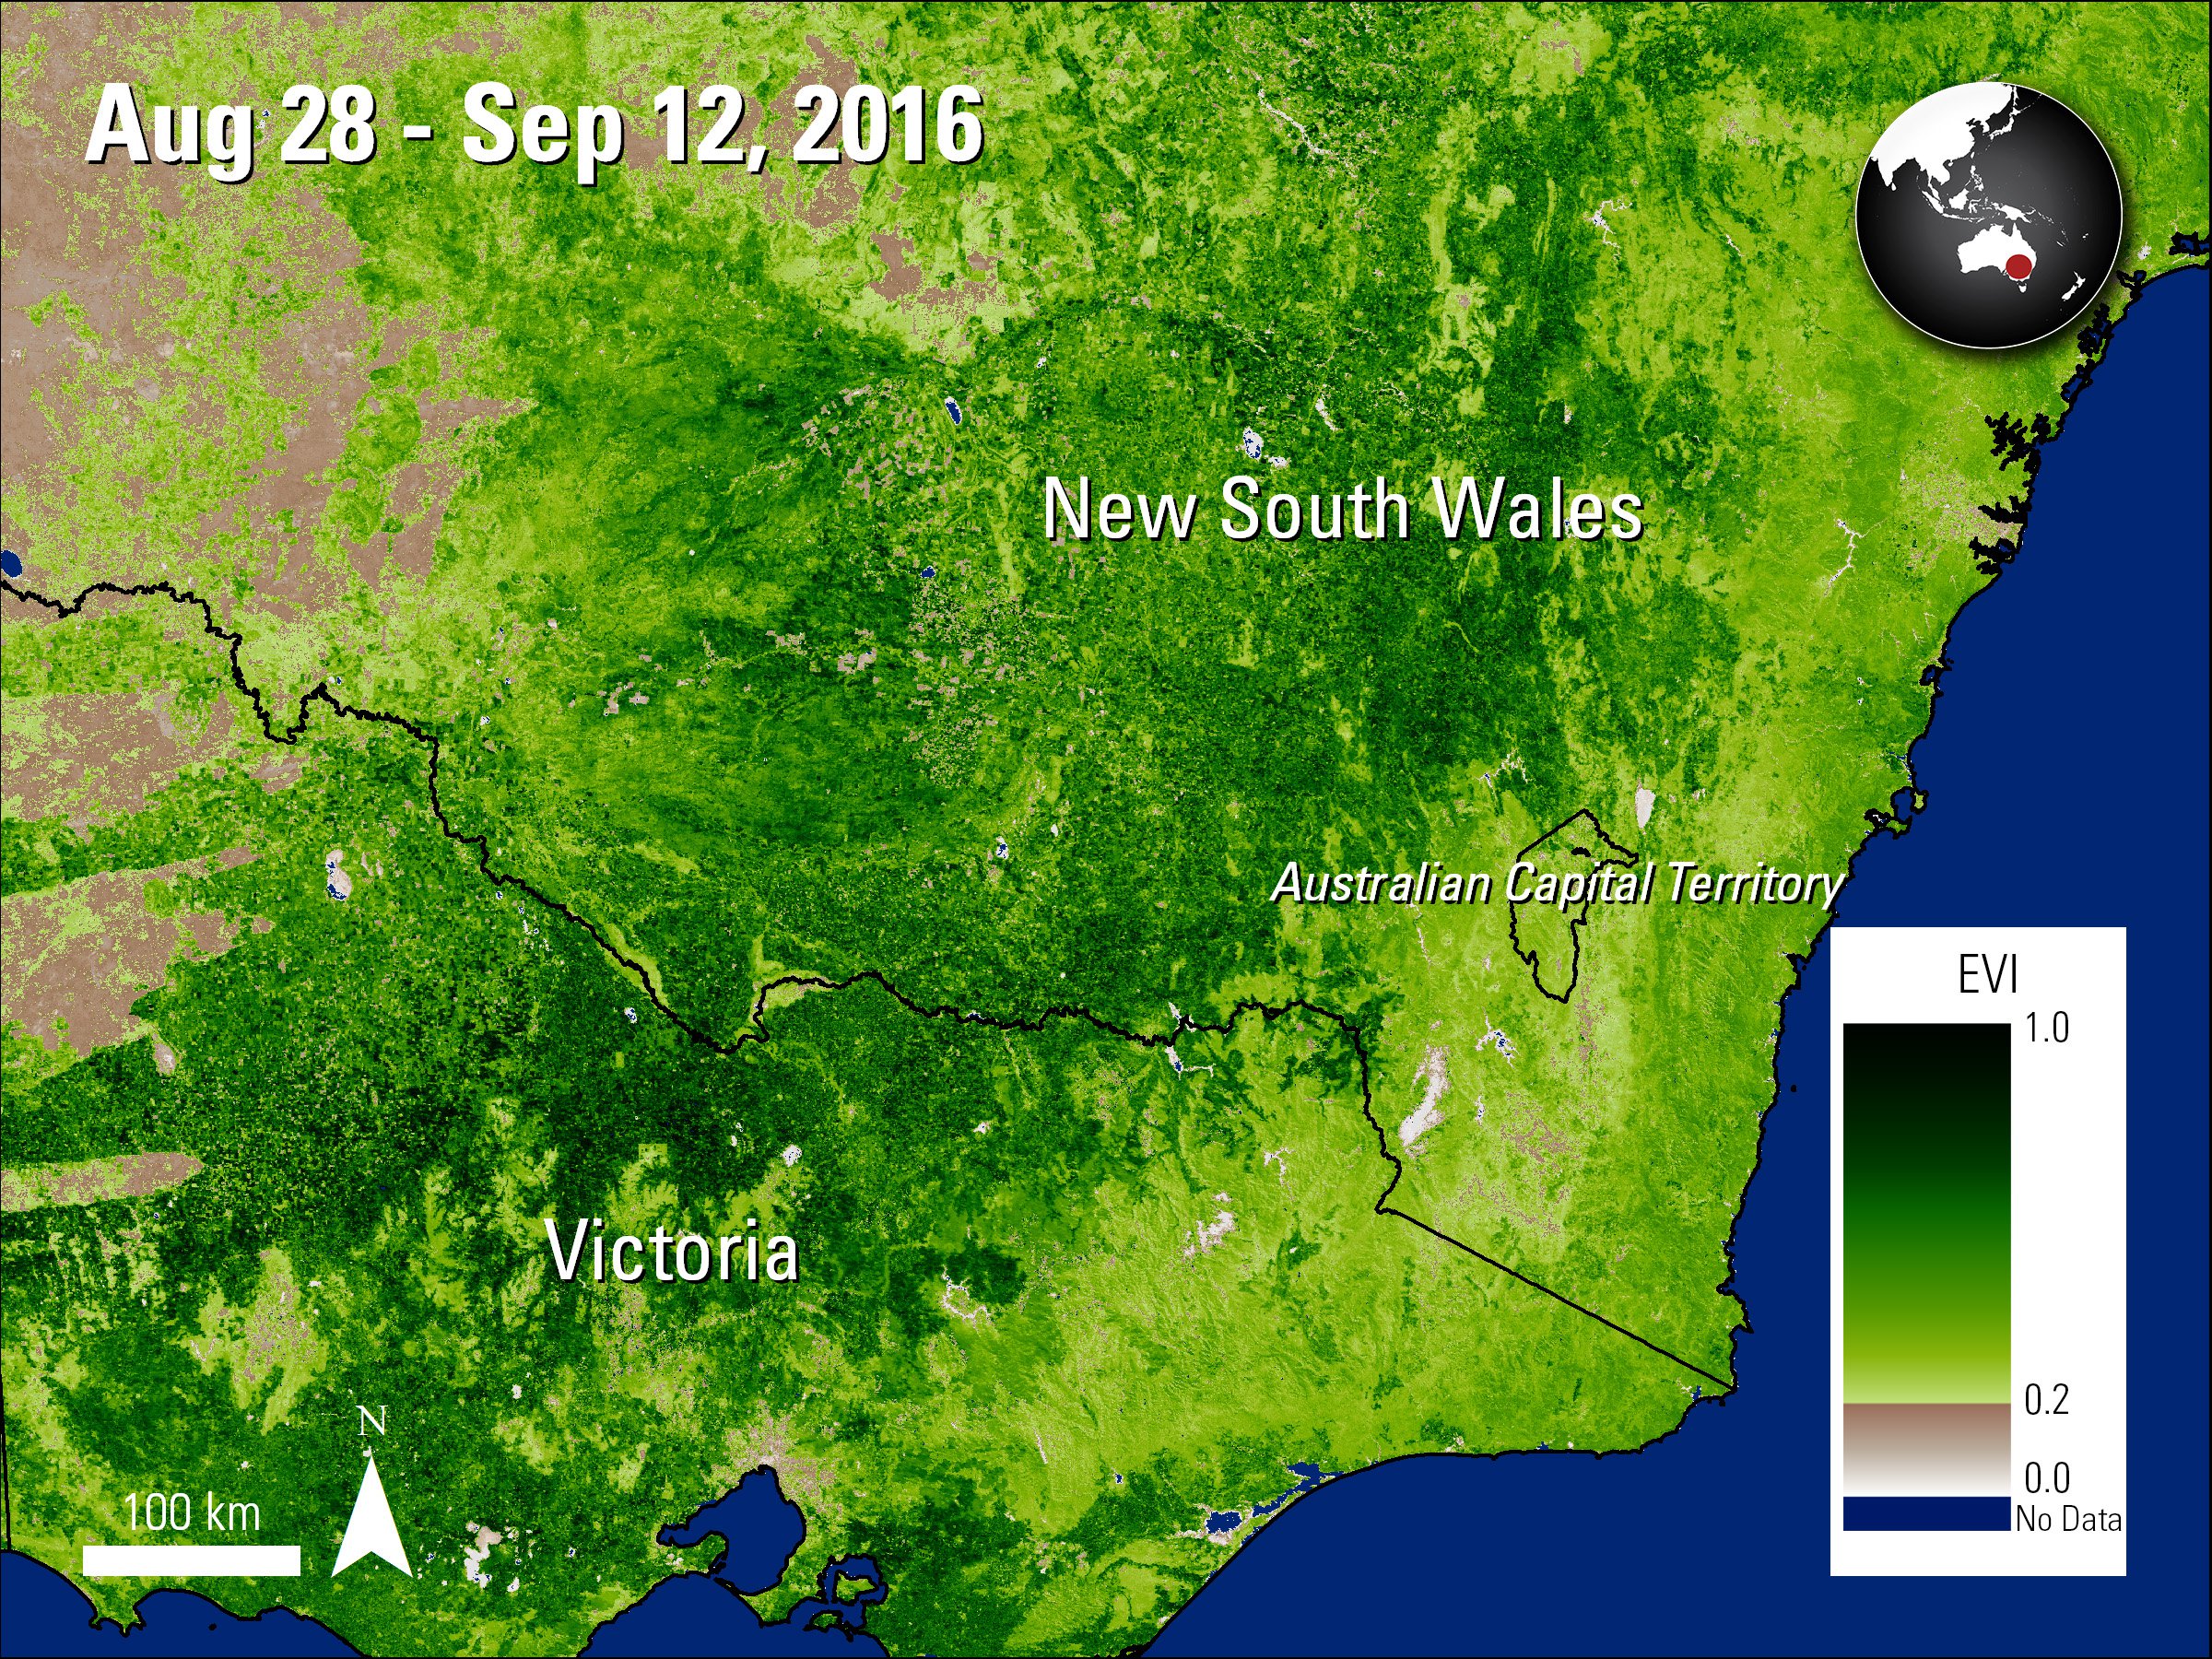
An example image of southeastern Australia showing the Enhanced Vegetation Index (EVI) of the area. The darker green color indicates more growth in the region.
Granule IDs:
MOD13Q1.A2016241.h29v12.006.2016263150734
MOD13Q1.A2016241.h30v12.006.2016263150730
DOI:
10.5067/MODIS/MOD13Q1.006
Boundary source:
Global Administrative Unit Layers (GAUL) dataset, implemented by FAO within the CountrySTAT and Agricultural Market Information System (AMIS) projects
Arundel, J., Winter, S., Gui, G., and Keatley, M., 2016, A web-based application for beekeepers to visualise patterns of growth in floral resources using MODIS data: Environmental Modelling & Software, v. 83, p. 116-125. [Also available at http://dx.doi.org/10.1016/j.envsoft.2016.05.010].
This paper describes a free web-based application, BeeBox, for beekeepers and bee enthusiasts in the Australian states of Victoria, New South Wales, Queensland, and South Australia. BeeBox provides users with preprocessed Terra Moderate Resolution Imaging Spectroradiometer (MODIS) Enhanced Vegetation Index (EVI) (MOD13Q1) data to show growing and flowering patterns of eucalyptus trees, a major source of food for bees. Information from this application can be used to predict where and when flowering events will occur, which can aid beekeepers in determining where to place their hives. Arundel and others (2016) use Terra MODIS data from February 2000 to present day as their main dataset due to MODIS’s consistent coverage. The authors specifically chose to use the 16-day composited data because it contains less cloud coverage as well as atmospheric contamination and requires less storage for their application. BeeBox allows beekeepers to identify a specific area of interest and then provides them with averaged EVI information of the area through time. The authors conducted a case study to demonstrate the application by using the Terra MODIS EVI layer to observe flowering patterns of the Eucalyptus tricarpa (Red Ironbark) species. The authors found there was a strong flowering pattern and honey production during 2000, 2004, and 2006. Conversely, they observed weaker incidents in 2002 and 2003. Their results correlate with the flowering interval that Red Ironbark typically experiences. In the future the authors see the BeeBox expanding to provide global coverage and also to provide information for other industries.
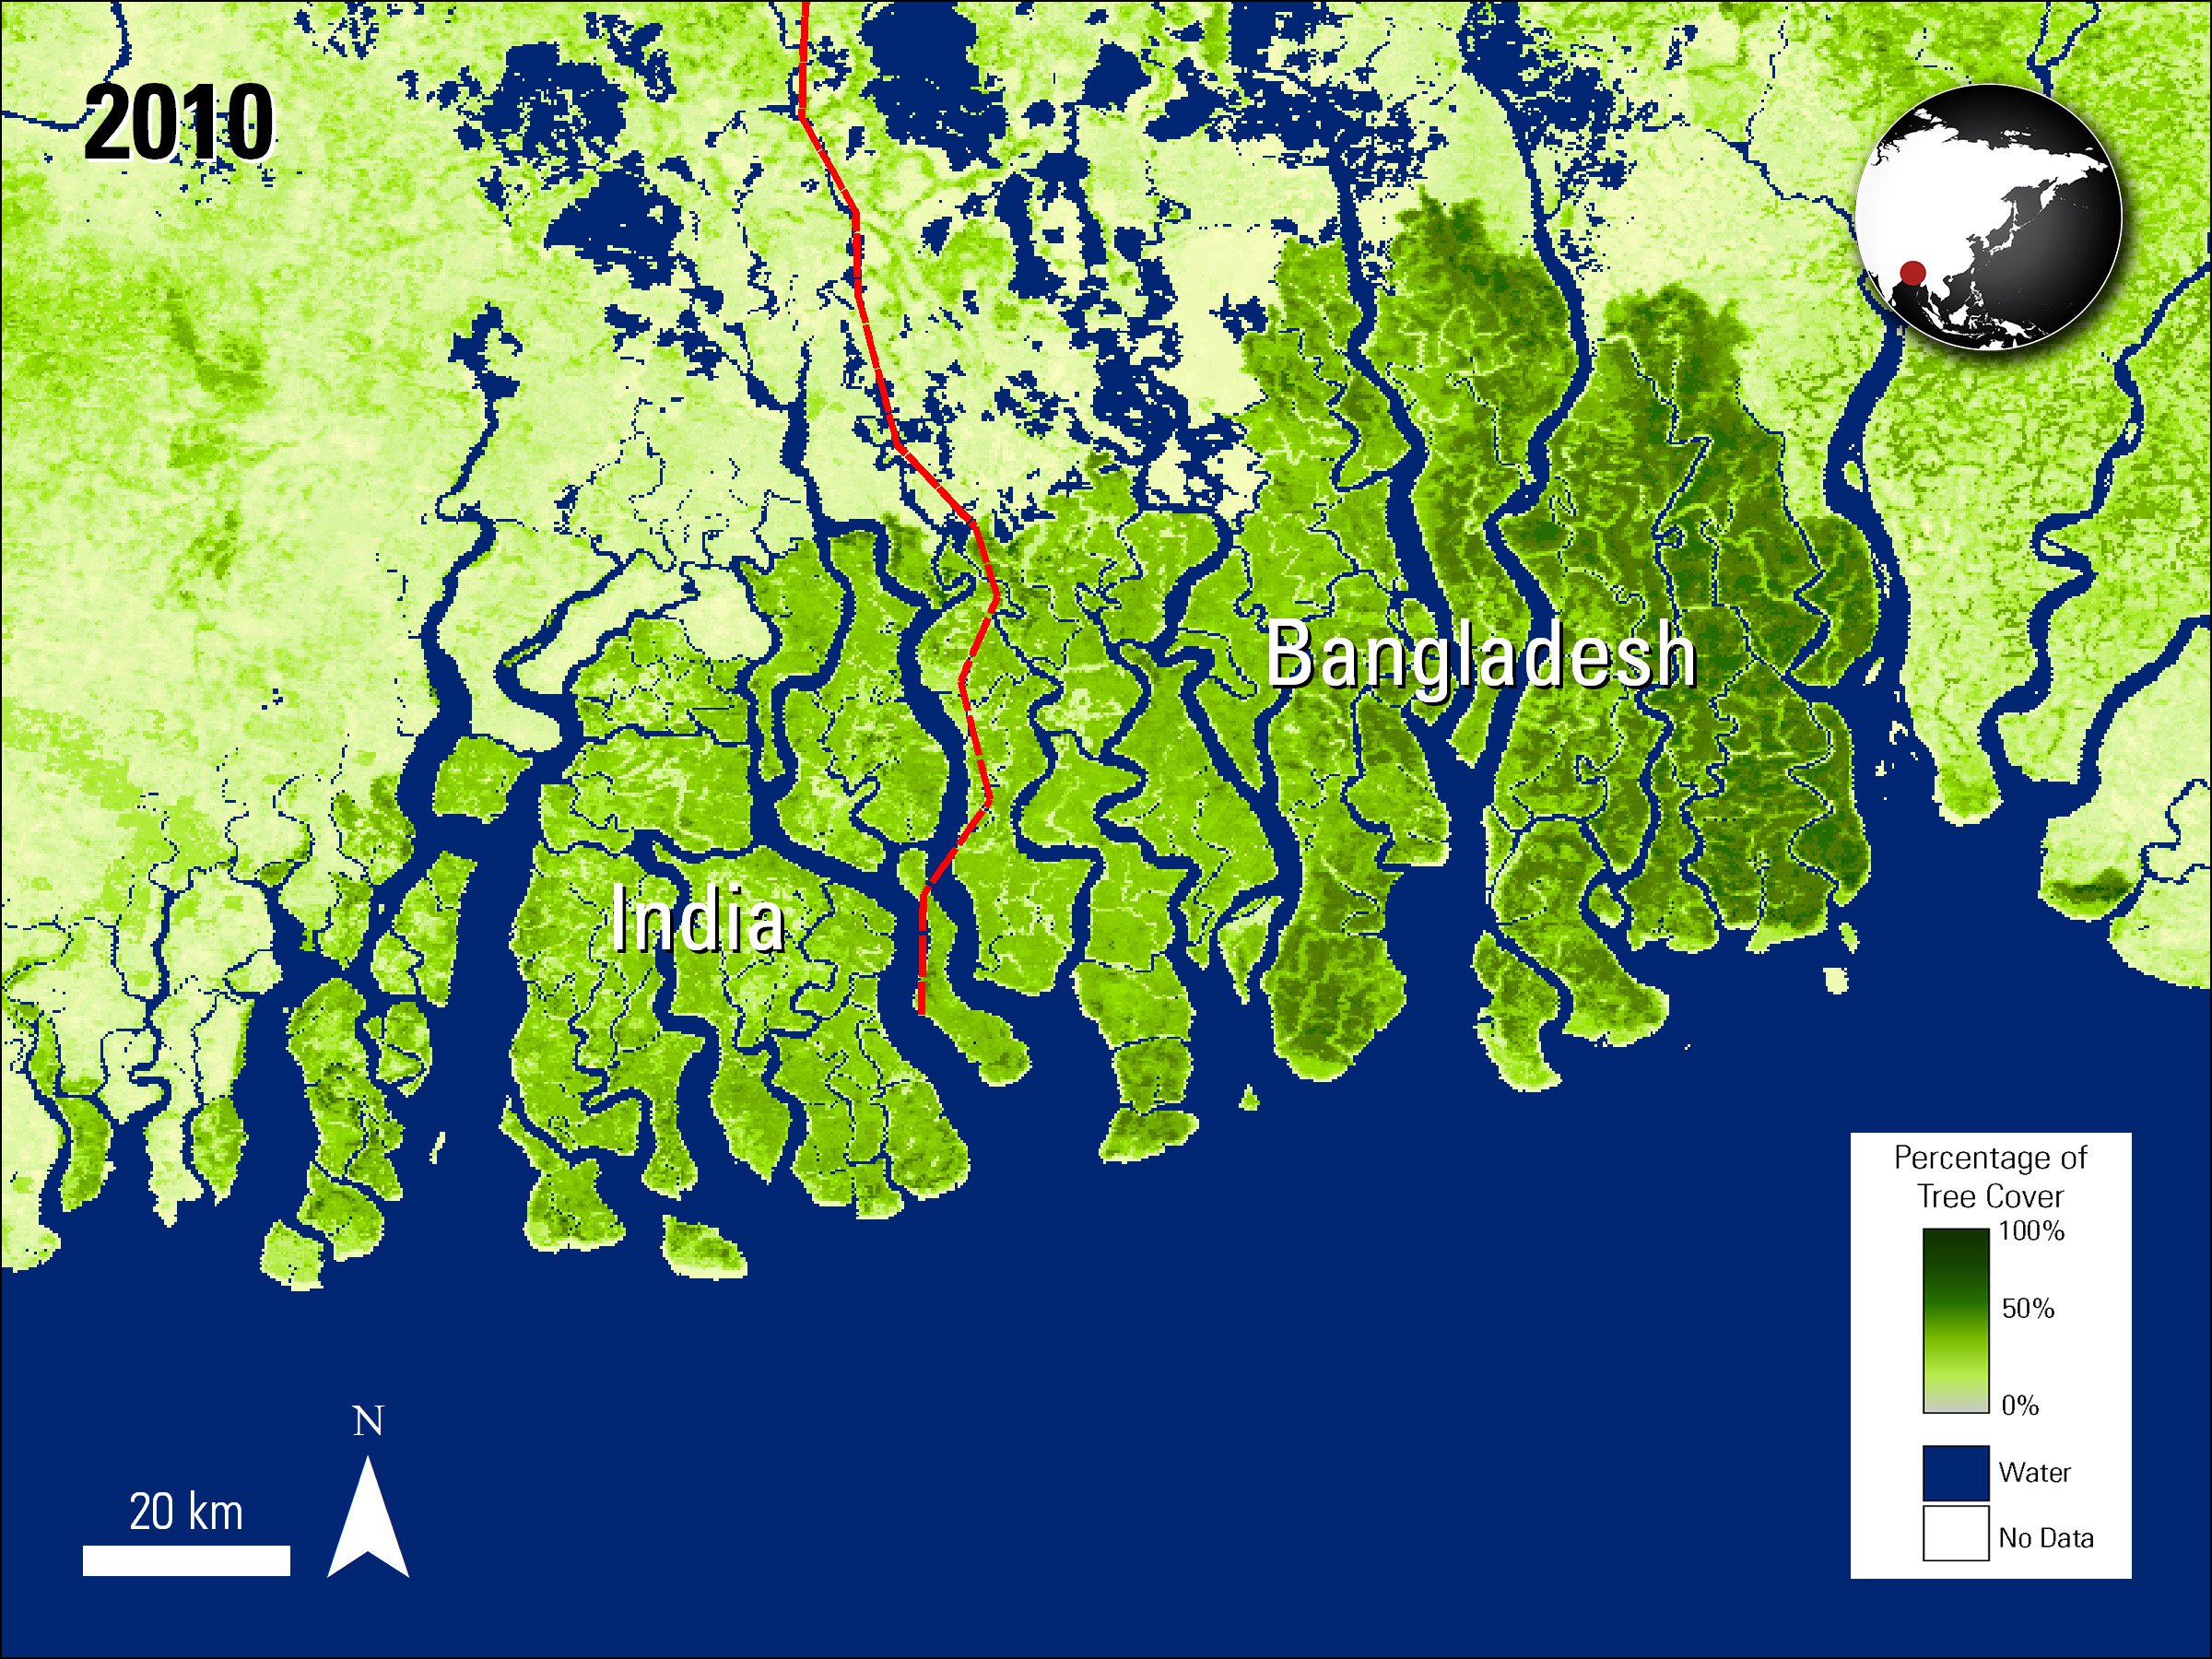
A Terra MODIS image showing percentage of tree cover of the Sundarbans forest in Bangladesh and India. The dark green vegetation of the forest is visible in the image when compared to the surrounding area. The red line symbolizes the border between the two countries.
Granule ID:
MOD44B.A2010065.h26v06.051.2014313033848
Boundary source:
Global Administrative Unit Layers (GAUL) dataset, implemented by FAO within the CountrySTAT and Agricultural Market Information System (AMIS) projects
Ishtiaque, A., Myint, S., and Wang, C., 2016, Examining the ecosystem health and sustainability of the world's largest mangrove forest using multi-temporal MODIS products: Science of the Total Environment, v. 569-570, p. 1241-1254. [Also available at http://dx.doi.org/10.1016/j.scitotenv.2016.06.200].
The world’s largest contiguous mangrove forest is the Sundarbans forest, located along the coast of Bangladesh and India. While portions of the Sundarbans are a National Park, a wildlife sanctuary, and a forest reserve, the area is still under constant threat from both environmental forces and anthropogenic activities. Ishtiaque and others (2016) are using four Terra MODIS land data products distributed by the LP DAAC, and a MODIS evapotranspiration product, as parameters to observe ecological changes in the Sundarbans forest from 2000 to 2010. The authors use Terra MODIS’s Yearly Vegetation Continuous Fields data (MOD44B), shown in the image to the left, to identify the percentage of tree cover (PTC) in the forest. The authors use several other Terra MODIS data products as well. To observe the biomass richness of the forest the authors use EVI from the monthly Vegetation Indices product (MOD13A3). The yearly Net Primary Production (NPP) (MOD17A3) is used to observe the net amount of carbon added to the plant biomass in the forest. The Leaf Area Index (LAI) data product (MOD15A2) is used to measure the amount of canopy foliage in the forest. The authors observe the Sundarbans overall using these parameters, and they also create annual image stacks of each product to perform a pixel-based time-series trend analysis of each product. Based on these Terra MODIS data parameters the authors find that overall the Sundarbans are degrading at a slow, but steady rate, with decreases in PTC, EVI, NPP and LAI. They find the eastern side of the forest is experiencing higher rates of degradation, with certain parcels degrading more rapidly than the rest of the forest. Their study agrees with a previous study that used radar imagery in the area. The authors state that results from this study can be used to aid management agencies and policy makers in providing better forest management in the future to help protect the Sundarbans. The authors also believe that the parameters used in this study can be used to study and monitor the health of other forest ecosystems around the world.
Author's note: This paper used MOD17A3 data, which has since been replaced by MOD17A3H and MOD15A2, which has since been replaced by MOD15A2H.
Material written by Danielle Golon1
1 Innovate!, Inc., contractor to the U.S. Geological Survey, Earth Resources Observation and Science (EROS) Center, Sioux Falls, South Dakota, USA. Work performed under USGS contract G15PD00766 for LP DAAC2.
2 LP DAAC Work performed under NASA contract NNG14HH33I.