Data products from the Land Processes (LP) DAAC are used in many different applications. They play an important role in modeling, help to detect changes to the landscape, and are a way to assess ecosystem variables, among others. A few of these applications that have been published between October and December 2014 are highlighted below and a more exhaustive, albeit not complete, list is available here.
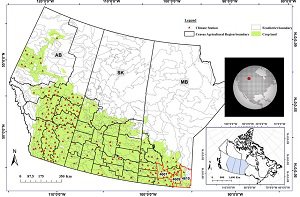
ECDs and CARs across the Western Canadian Prairie; the cropland in light- green was the focus of this study. The CARs outlined in red were those identified as having poorer ICCYF performance for spring wheat (Kouadio, L. et al., 2014; CC-BY-4.0).
ECDs and CARs across the Western Canadian Prairie; the cropland in light- green was the focus of this study. The CARs outlined in red were those identified as having poorer ICCYF performance for spring wheat (Kouadio, L. et al., 2014; CC-BY-4.0).
Kouadio, L., Newlands, N.K., Davidson, A., Zhang, Y., and Chipanshi, A., 2014, Assessing the Performance of MODIS NDVI and EVI for Seasonal Crop Yield Forecasting at the Ecodistrict Scale: Remote Sensing, v. 6, no. 10, p. 10193-10214. [Also available at http://dx.doi.org/10.3390/Rs61010193]
This study investigates the use of MODIS-derived vegetation indices (MOD13Q1) for forecasting spring wheat yield at the ecodistrict (ECD) scale in three provinces across western Canada with the Integrated Canadian Crop Yield Forecasters (ICCYF) for the 2000 to 2010 period. The study compares these forecasts and their accuracy to forecasts at the Census Agricultural Region (CAR) scale. An ECD is a subdivision of a single ecoregion and has specific climate, soil, landscape, and ecological aspects. CARs consist of neighboring census divisions. Agroclimate measurements (daily temperatures and precipitation, soil characteristics, and soil moisture) combined with MODIS derived Normalized Difference Vegetation Index (NDVI) and Enhanced Vegetation Index (EVI) are used as inputs for the in-season yield forecasting of spring wheat from 2000 through 2010. Results show that both inputs (agroclimate plus MODIS-NDVI and agroclimate plus MODIS-EVI) equally predict spring wheat yields at the ECD scale. The CARs or coarser statistical units had poorer ICCYF performance as reported in previous studies. Therefore, this study found that the model performance improved at the finer ECD scale.
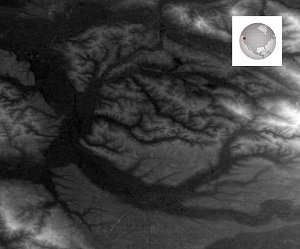
ASTER GDEM, a product of NASA and Japan’s Ministry of Economy, Trade, and Industry (METI), was one of several satellite-based remote sensing datasets used to study elevation change patterns over time at the Centralia Coal Mine in Centralia, Washington.
ASTER GDEM, a product of NASA and Japan’s Ministry of Economy, Trade, and Industry (METI), was one of several satellite-based remote sensing datasets used to study elevation change patterns over time at the Centralia Coal Mine in Centralia, Washington.
Prush, V.B., and Lohman, R.B., 2014, Time-varying elevation change at the Centralia coal mine in Centralia, Washington (USA), constrained with InSAR, ASTER, and optical imagery: IEEE Journal of Selected Topics in Applied Earth Observations and Remote Sensing. [Also available at http://dx.doi.org/10.1109/JSTARS.2014.2348412]
Digital elevation models (DEMs) are used to study elevation changes over a 30 year period at the Centralia Coal Mine in Centralia, Washington in this study. InSAR observations and other DEMs are used to create the time series. The other DEMs include the National Elevation Dataset (NED), the Shuttle Radar Topography Mission (SRTM), DEMs derived from individual scenes of Advanced Spaceborne Thermal Emission and Reflection Radiometer (ASTER) imagery, and the ASTER Global Digital Elevation Model (GDEM). Elevation change was observed across all datasets relative to NED, which was used as the baseline. There were several regions of significant positive and negative elevation changes. Negative values were areas that experienced a decrease in elevation due to the removal of materials. Positive values were areas that experienced an increase in elevation due to depressions being filled in and raised above their original elevation, or piling by transporting material from one place to another. This study demonstrated the ability to utilize time series DEM data to determine the elevation change patterns over time that were attributed to excavation and transport of materials at an operational coal mine between 1971 and 2006.
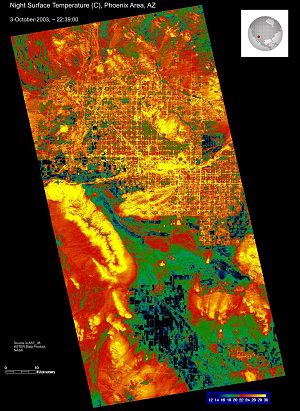
An example of a nighttime ASTER surface temperature image of Phoenix, Arizona (NASA/GSFC/METI/Japan Space Systems, and U.S./Japan ASTER Science Team).
An example of a nighttime ASTER surface temperature image of Phoenix, Arizona (NASA/GSFC/METI/Japan Space Systems, and U.S./Japan ASTER Science Team).
Zheng, B., Myint, S.W., and Fan, C., 2014, Spatial configuration of anthropogenic land cover impacts on urban warming: Landscape and Urban Planning, v. 130, no. 1, p. 104-111. [Also available at http://dx.doi.org/10.1016/j.landurbplan.2014.07.001.]
The urban heat island (UHI) effect refers to higher temperatures in urban areas relative to temperatures in surrounding rural areas. The goal of this study is to better understand how spatial patterns of anthropogenic land cover features influence land surface temperature (LST) within Phoenix, Arizona. Anthropogenic land cover is created by human land use and in this study includes commercial, industrial, and residential buildings, grassland, unmanaged soils, and manmade water bodies. An urban classification map of Phoenix was derived from a high-resolution QuickBird image from May 24, 2007. Then summertime LST data were acquired from two ASTER images (AST_08), one daytime and the other nighttime. Local Moran’s I, a continuous spatial autocorrelation index, was used to measure the spatial pattern of land cover classes in Phoenix. Results show that both random patterns and clusters of paved surfaces exhibit an increase in surface temperature night, but are more obvious in the clustered paved areas. Weaker effects of spatial patterns of paved surface on LST are observed when the building fraction exceeds 50%. This weaker correlation could be due to cooling effects created by the shade of buildings. LST was observed to be higher for areas that are more than 50% paved and areas with more than 90% combined fraction of paved surfaces and soils. Since the results of this study indicate a strong influence of cluster patterns of paved surfaces on LST, urban planners could utilize this information to help minimize UHI effects.
Material written by: Kari Beckendorf1 and Lindsey Harriman1
1 Innovate!, Inc., contractor to the U.S. Geological Survey, Earth Resources Observation and Science (EROS) Center, Sioux Falls, South Dakota, USA. Work performed under USGS contract G10PC00044 for LP DAAC2.
2 LP DAAC Work performed under NASA contract NNG14HH33I.