(Author's Note 3/1/2024: At the time of publishing these references were available online, some resources may no longer be available.)
Data products distributed by the Land Processes (LP) Distributed Active Archive Center (DAAC) are used in many different applications. They play an important role in modeling, help to detect changes to the landscape, and are a way to assess ecosystem variables, to name a few. Three of those applications, published between October and December 2016, are highlighted below. A more exhaustive, albeit not complete, list can be accessed via the LP DAAC Publications webpage.
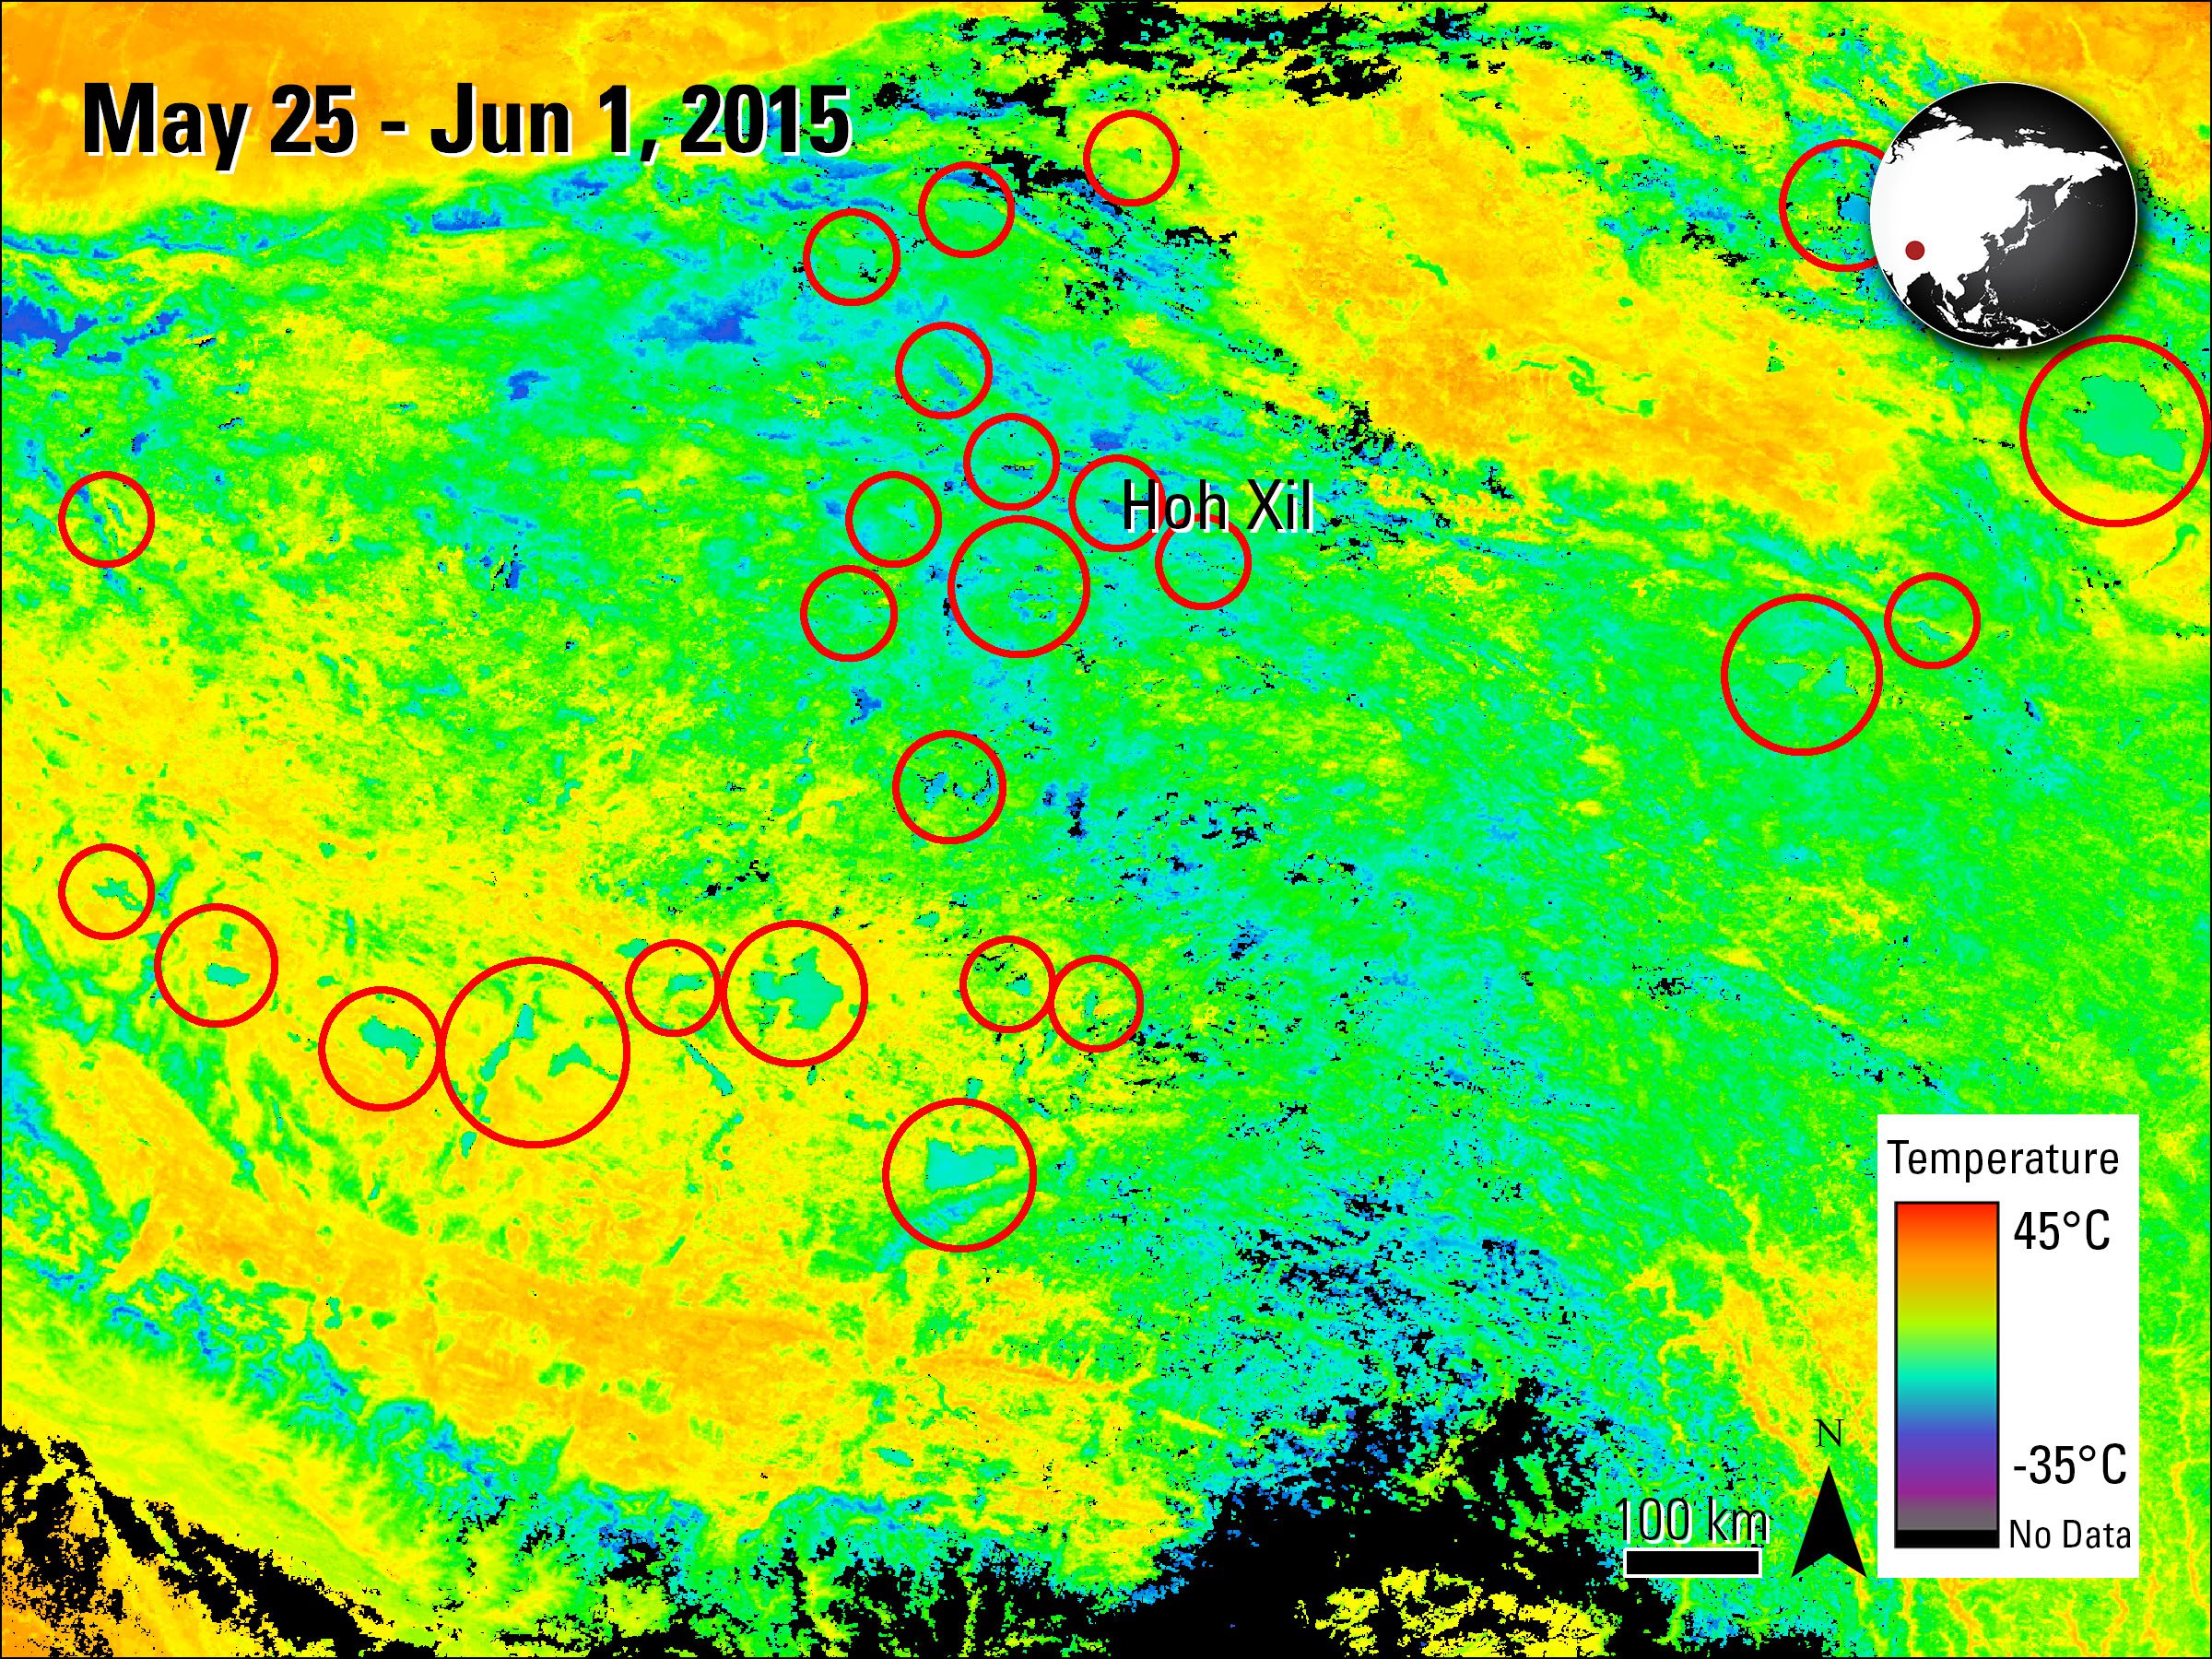
Several of the lakes from the Song and others’ (2016) research are circled in red in this Terra MODIS Land Surface Temperature (LST) image, showing part of the Tibetan Plateau.
Granule IDs:
MOD11A2.A2015145.h24v05.005.2015155124748
MOD11A2.A2015145.h25v06.005.2015155123841
MOD11A2.A2015145.h26v06.005.2015155125407
MOD11A2.A2015145.h26v05.005.2015155124910
MOD11A2.A2015145.h25v05.005.2015155124949
MOD11A2.A2015145.h24v06.005.2015155124440
Song, K., Wang, M., Du, J., Yuan, Y., Ma, J., Wang, M., and Mu, G., 2016, Spatiotemporal variations of lake surface temperature across the Tibetan Plateau using MODIS LST product: Remote Sensing, v. 8, no. 10, p. 854–874. [Also available at http://dx.doi.org/10.3390/rs8100854].
In this paper, Song and others (2016) use Terra Moderate Resolution Imaging Spectroradiometer (MODIS) Land Surface Temperature (LST) (MOD11A2) data from 2000 to 2015 to investigate lake water surface temperature (LWST) of 56 large lakes on the Tibetan Plateau. LWST is an important factor in controlling the ecosystem of a lake; changes in water temperature can significantly alter the ecosystem. The conventional approach to studying lake temperatures involves the use of loggers to obtain in situ data, which can be dangerous in this remote region’s harsh environment. Additionally, this methodology can provide limited spatial coverage. According to the authors, Terra MODIS LST data are advantageous for this study because consistent spatiotemporal coverage over the region is available. To obtain the data, the authors use the MODIS Reprojection Tool (MRTWeb) to extract and mosaic five tiles of 8-day LST data over the region. These data were validated with field survey and weather station measurements.
Over the course of the study period, the LWST ranged between -2.0°C and 14.0°C. Daytime temperature measurements revealed warmer lakes in the southern part of the plateau and cooler lakes in the northern Hoh Xil region, shown in the image to the left. Similar temperatures were apparent in the nighttime LST data, with the exception of a few lakes in the north showing relatively high nighttime temperatures. Based on the daytime LST measurements, the authors found that several lakes had a statistically significant change of LWST during the study period, including 3 lakes that were warming and 16 lakes that were cooling. Based on nighttime temperatures, the authors also found that 21 lakes had a LWST change with 8 lakes warming and 13 lakes cooling. The authors conclude that further research is needed to study other factors that might impact the LWST, including water salinity and the groundwater supply.
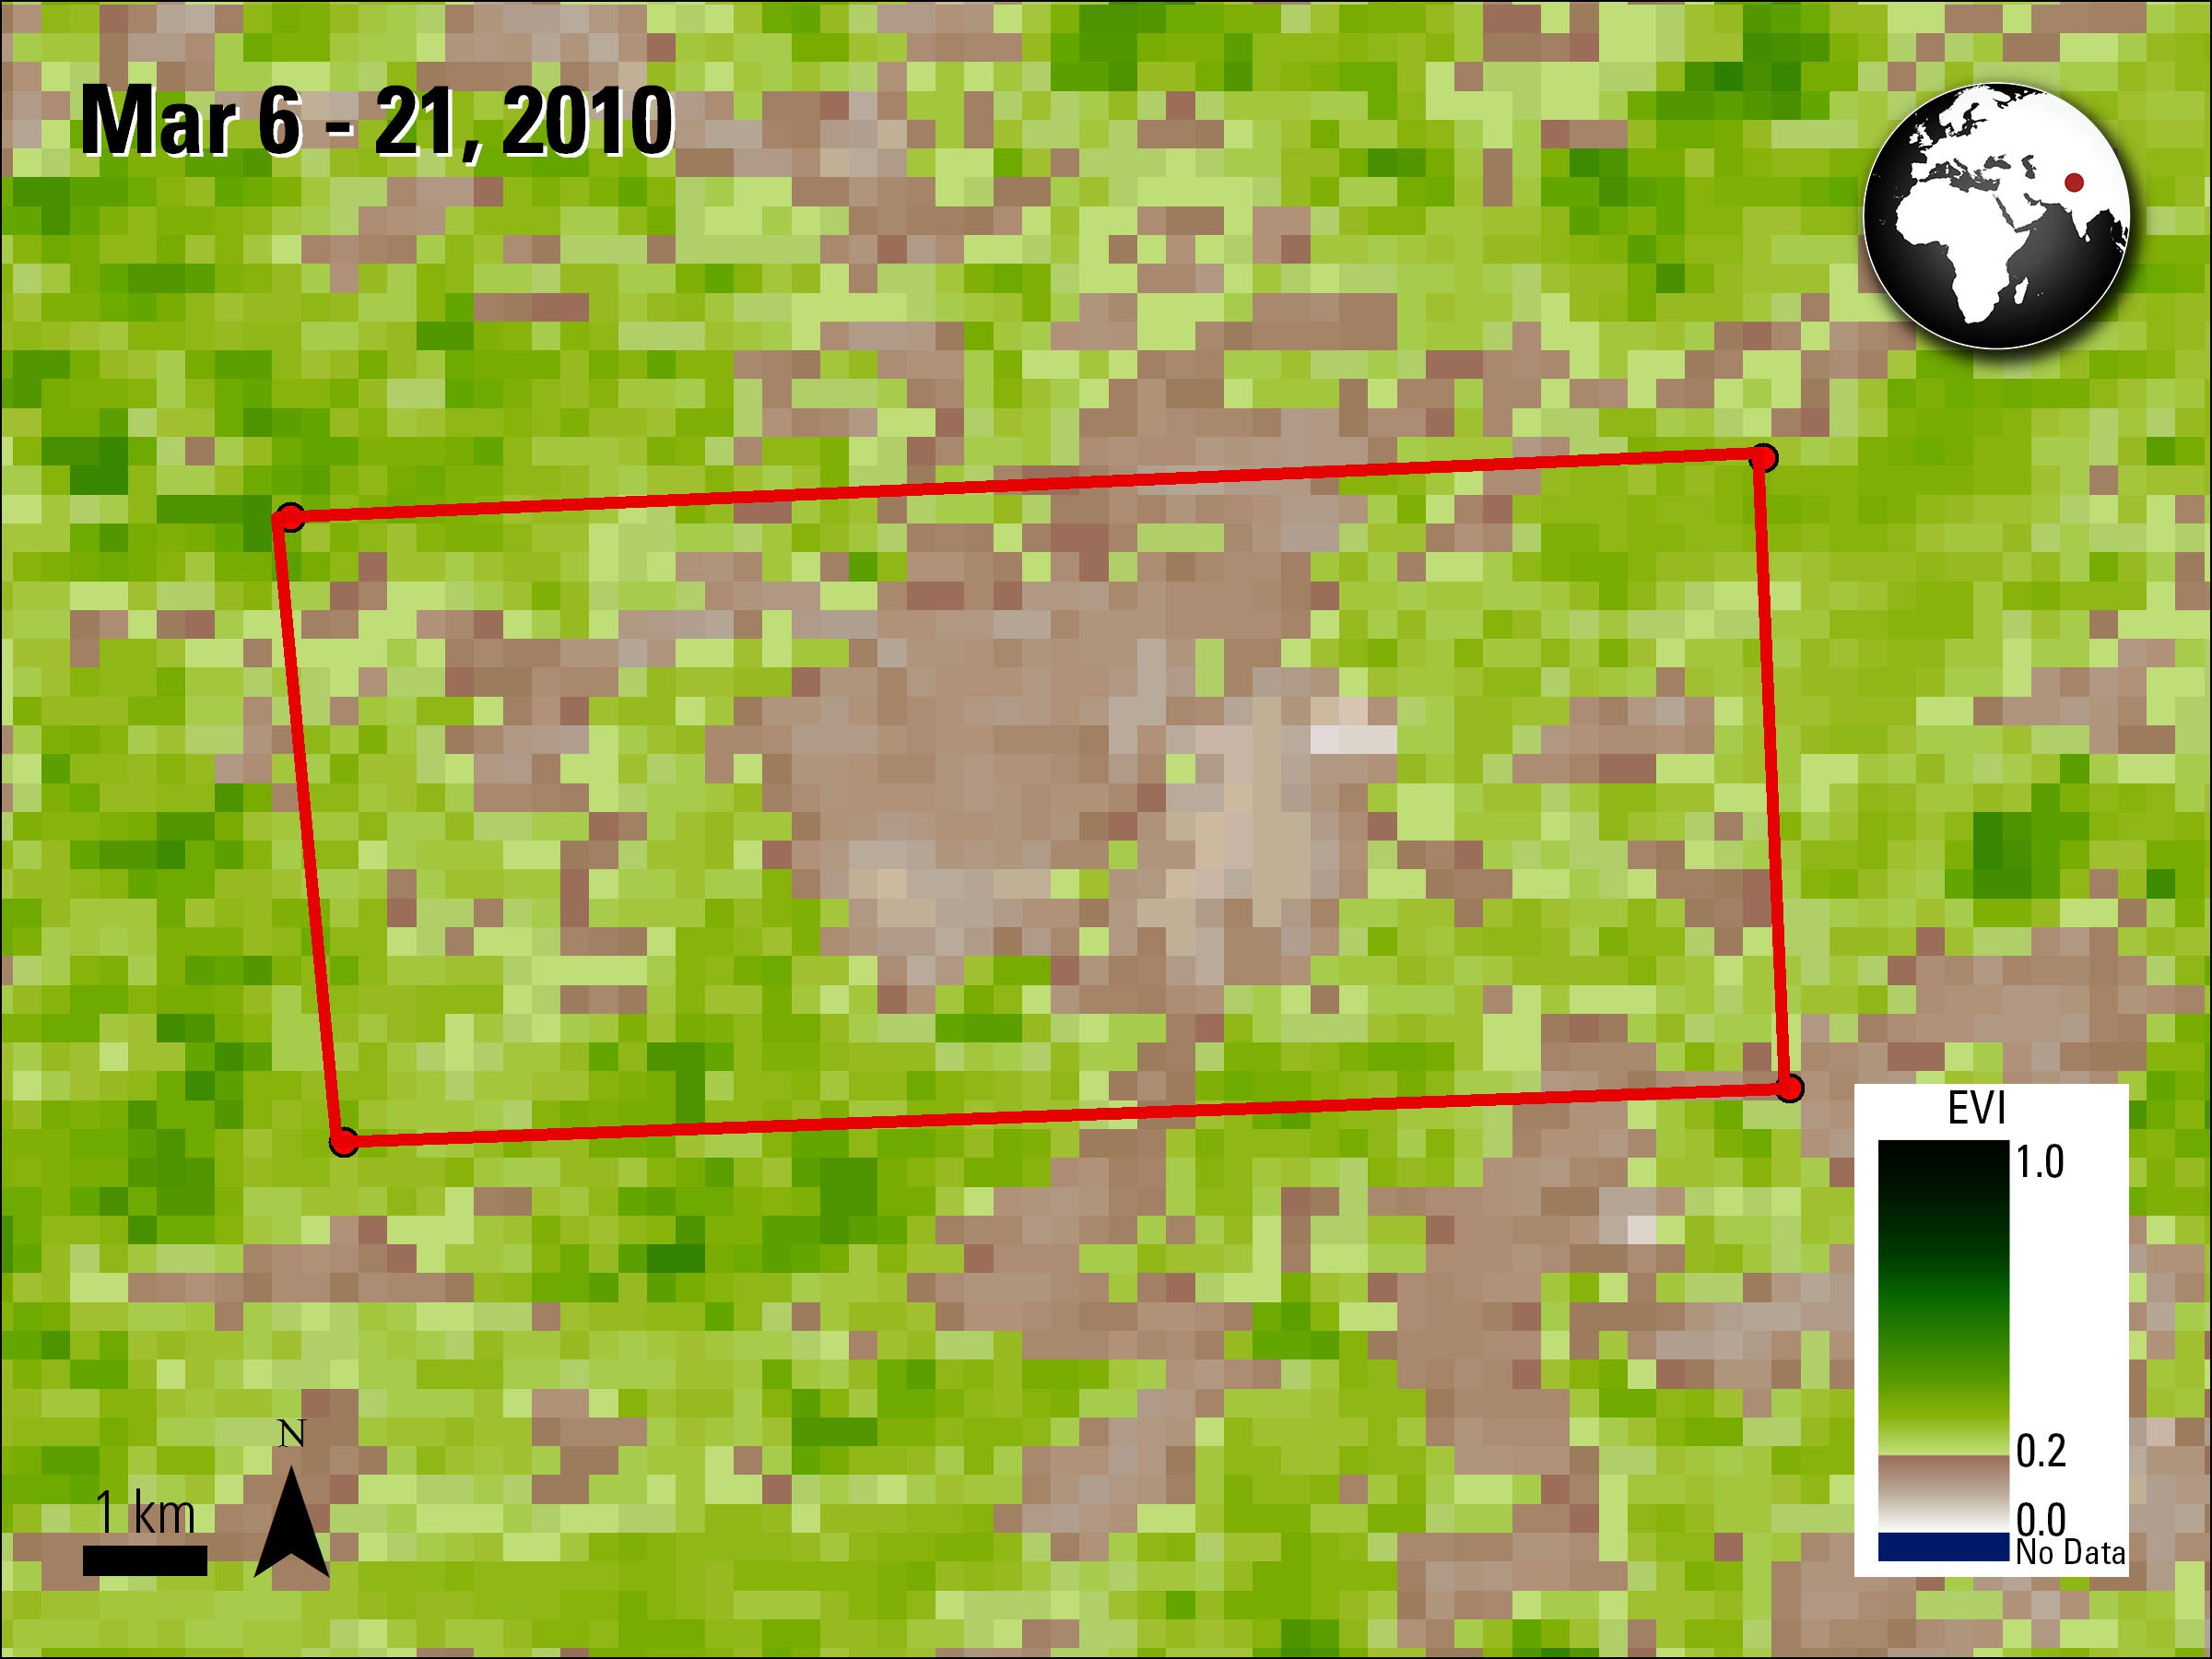
A Terra MODIS image from early March 2010 shows the Enhanced Vegetation Index (EVI) of the Yasmin and others (2016) study area, outlined in red.
Granule ID:
MOD13Q1.A2010065.h24v05.005.2010084071821
A Terra MODIS image from early March 2010 shows the Enhanced Vegetation Index (EVI) of the Yasmin and others (2016) study area, outlined in red.
Granule ID:
MOD13Q1.A2010065.h24v05.005.2010084071821
Yasmin, N., Fahim Khokhar, M., Tanveer, S., Saqib, Z., and Razzaq Khan, W., 2016, Dynamical assessment of vegetation trends over Margalla Hills National Park by using MODIS vegetation indices: Pakistan Journal of Agricultural Sciences, v. 54, no. 4, p. 1–10.
In this study, Yasmin and others (2016) use MODIS Vegetation Indices data from the LP DAAC Data Pool to study vegetation degradation in the Margalla Hills National Park (MHNP) near Islamabad, Pakistan, between February 2000 and March 2011. They chose to study vegetation because of its sensitivity to natural and human-induced environmental changes. Terra MODIS Vegetation Indices (MOD13Q1) data were chosen for this study because of its cloud-free 16-day temporal interval at 250-meter spatial resolution, available at no cost. In addition, the authors note that MODIS data provide a long-term remote sensing record of key ecological parameters. Both the Normalized Difference Vegetation Index (NDVI) and the Enhanced Vegetation Index (EVI) data layers are used to identify locations within the MHNP that exhibit significant changes in vegetation. Using the Vegetation Indices data the authors found both increasing and decreasing vegetation trends throughout the park. The authors found the study area experienced a 3% decrease in vegetation, and a 31% increase in vegetation using the NDVI layer. Alternatively, the EVI layer showed a 4% decrease and a 13.5% increase. The authors then compared the NDVI and EVI data to images of MHNP on Google Earth. The authors found that areas of vegetation degradation were impacted by anthropogenic factors, including limestone extraction, picnic areas and urban development. The authors found that the southern and western areas of the park, both of which have a larger human presence, experienced greater decreases in vegetation overall.
Read the “Monitoring Phenology in National Parks” Data in Action story for another example of how Vegetation Indices data are used to study national parks.
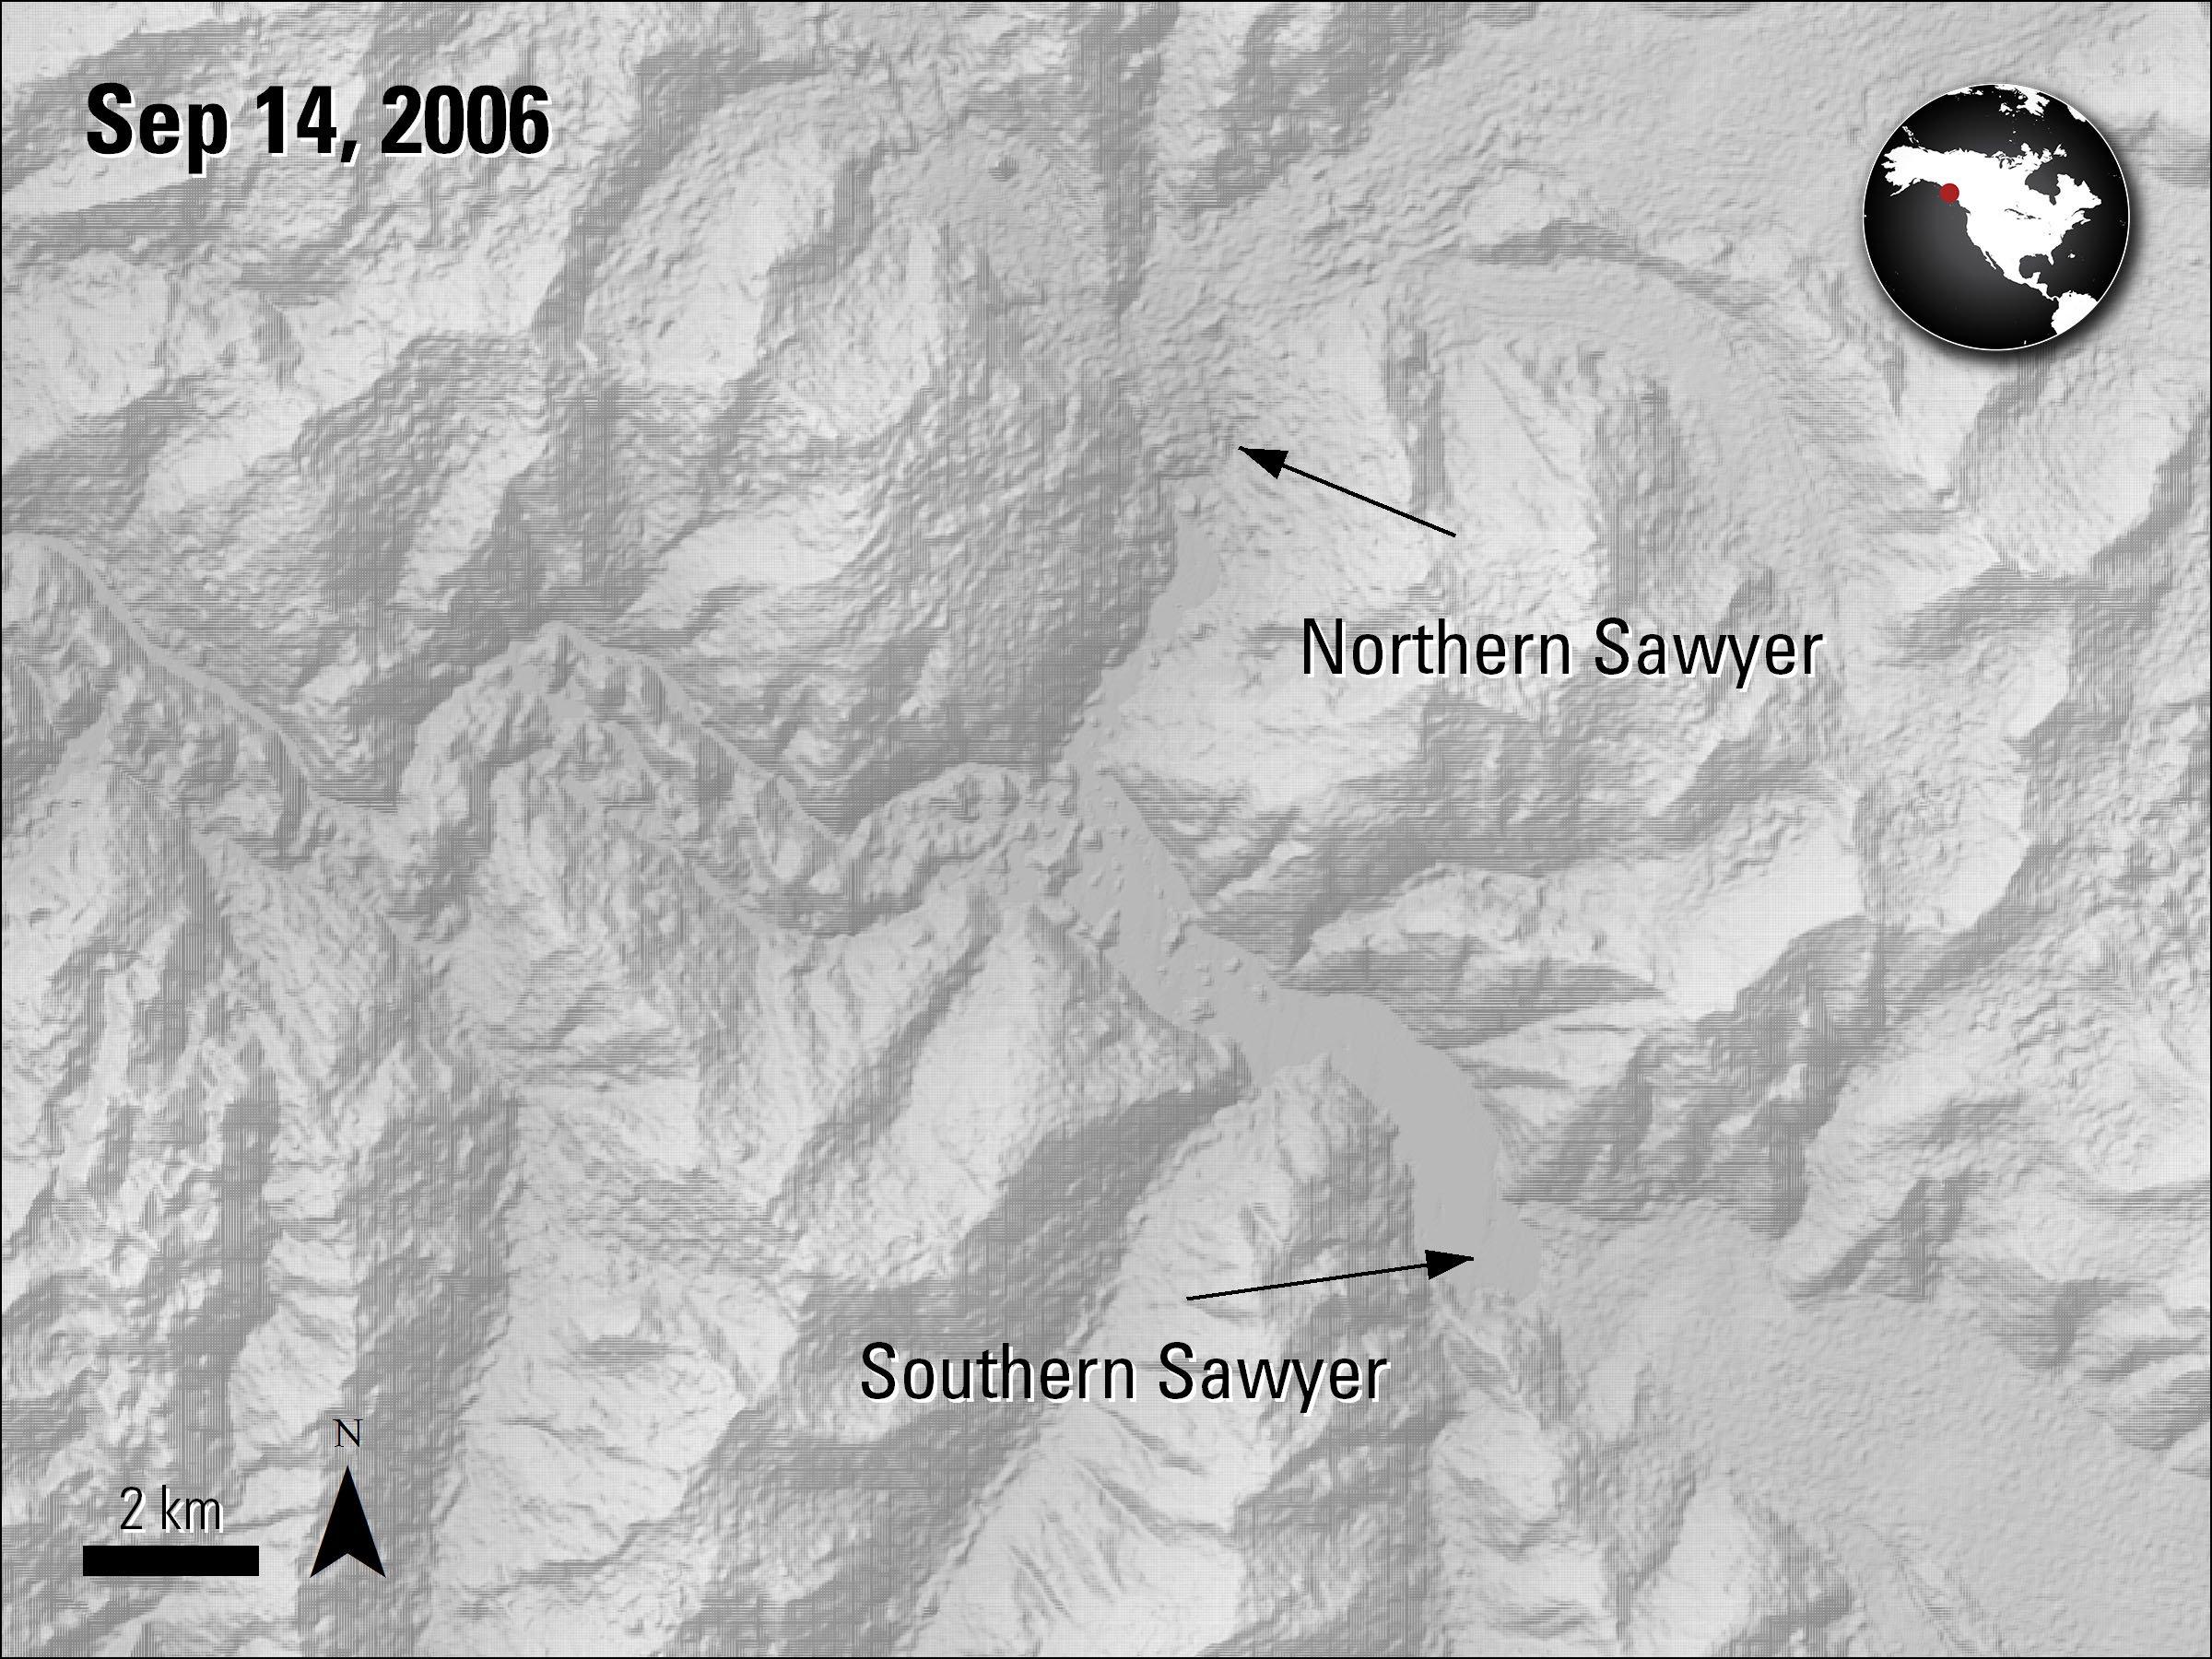
A view of the Northern Sawyer and Southern Sawyer glaciers in Alaska, using the ASTER DEM data. These two glaciers are examples of the largest marine-terminating glaciers in the Stikine Icefield.
Granule ID:
AST14DEM_0039142006202344_20161228151803_10553
DOI:
10.5067/ASTER/AST14DEM.003
A view of the Northern Sawyer and Southern Sawyer glaciers in Alaska, using the ASTER DEM data. These two glaciers are examples of the largest marine-terminating glaciers in the Stikine Icefield.
Granule ID:
AST14DEM_0039142006202344_20161228151803_10553
DOI:
10.5067/ASTER/AST14DEM.003
Melkonian, A., Willis, M., and Pritchard, M., 2016, Stikine icefield mass loss between 2000 and 2013/2014: Frontiers in Earth Science, v. 4, art. 89. [Also available at https://doi.org/10.3389/feart.2016.00089].
Alaskan glaciers are sensitive to changing climate variables. The effects can be observed by surface melting, water runoff, and iceberg calving. Melkonian and others (2016) use Advanced Spaceborne Thermal Emission and Reflection Radiometer (ASTER) Digital Elevation Model (DEM) data (AST14DEM) from 2000 to 2014 to study the loss in glacier mass with different terminus types in the Stikine Icefield along the border between the United States and Canada. The thinning rates of the icefield are estimated by applying a weighted linear regression on a pixel-by-pixel basis to the ASTER data. The ASTER data are co-registered vertically and horizontally with Shuttle Radar Topography Mission (SRTM) DEM data, as SRTM elevation data are impacted less by clouds and snow. Melkonian and others (2016) use these data to determine that marine-terminating glaciers (glaciers that end in water) are thinning more rapidly than land-terminating glaciers (glaciers that end inland). The fronts of the Northern Sawyer and Southern Sawyer marine-terminating glaciers, shown in the ASTER DEM image to the left, revealed the highest thinning rate. Overall, the authors found that the Stikine Icefield mass changed between −3.3 ± 1.1 gigatonnes (Gt) per year during the study period. The authors also looked at glacier velocities using other satellite imagery from 1985 to 2014 and found that marine-terminating glaciers in the icefield also have higher terminus velocities than other glaciers in the icefield.
Material written by Danielle Golon1
1 Innovate!, Inc., contractor to the U.S. Geological Survey, Earth Resources Observation and Science (EROS) Center, Sioux Falls, South Dakota, USA. Work performed under USGS contract G15PD00403 for LP DAAC2.
2 LP DAAC Work performed under NASA contract NNG14HH33I.