Sensing Our Planet: NASA Earth Science Research Features 2016 cover
Sensing Our Planet: NASA Earth Science Research Features 2016 cover
(Author's Note 2/28/2022: At the time of publishing these references were available online, some resources may no longer be available.)
Each year, the Sensing Our Planet publication features intriguing research that highlights how scientists are using Earth science data to learn about our planet. Research described in the articles uses data archived and managed by NASA Earth Observing System Data and Information System (EOSDIS) Distributed Active Archive Centers (DAACs). These articles are also a resource for learning about science and about the data, for discovering new and interdisciplinary uses of science datasets, and for locating data and education resources.
Articles and images from Sensing Our Planet: NASA Earth Science Research Features 2016 are available online at the NASA Earthdata website in both pdf and web formats.
A few of the 2016 stories feature data distributed by the Land Processes DAAC (LP DAAC). The data products used are from the Moderate Resolution Imaging Spectroradiometer (MODIS) sensor, aboard both the Terra and Aqua satellites.
Feeling hot hot hot
Heat waves are happening all over the world. Over 620 people die each year of heat-related deaths in the United States alone. Therefore, researchers are using satellite data to map the most heat sensitive areas in cities with the most vulnerable populations, including the elderly and children. One of these cities is Philadelphia, Pennsylvania, chosen by researchers due to its active stance in adapting to climate change. In this study, researchers used daily Aqua MODIS land surface temperature (LST) (MYD11A2) data with in-situ (on site) data to see just how hot the city got. They also used the MODIS LST data to specifically examine how hot it was in areas where residents are most sensitive to increased temperatures. Finally, the researchers looked at Aqua MODIS vegetation indices Normalized Difference Vegetation Index (NDVI) (MYD13A2) data to see how the city’s greening efforts were making an impact on temperature. Click the link above to learn how these data are helping the city develop plans to assist residents during future heat waves, and to see the shocking results they found while looking at the NDVI data.
The power of particles
Can an agricultural burn in Mexico cause a stronger outbreak of tornados in Alabama? That’s what researchers wanted to know, and they used NASA satellite remote sensing data to find out. These researchers looked at smoke from an agricultural burn in Yucatán, Mexico, just days before a massive outbreak of 122 tornados hit the southeastern United States on April 27, 2011. To study this event, the researchers created several simulations of the conditions that led up to the tornado outbreak using aerosol, cloud, and plume heights data from NASA’s LAADS and ASDC DAACs, combined with Terra and Aqua MODIS fire data (MOD14 and MYD14) from the LP DAAC. Read the article to find out how smoke plays a role in tornados.
Crisis in the Crescent
The Fertile Crescent, once known for being a lush oasis in the middle of a desert, is becoming a dry climate plagued with drought. At the same time, this area has seen turbulence from war, political unrest, and an increasing population. Researchers are now using Terra MODIS vegetation indices (MOD13C2) data from the LP DAAC to see if political uprisings correlate with times of drought. The researchers are using data sources from other DAACs around the country to look at issues in the region, as well, including aerosol data from LAADS and ASDC, gravity data from PO DAAC, wind and humidity data from GES DISC, and temperature, precipitation, and sea level pressure from ORNL. Read the article to learn what these researchers found.
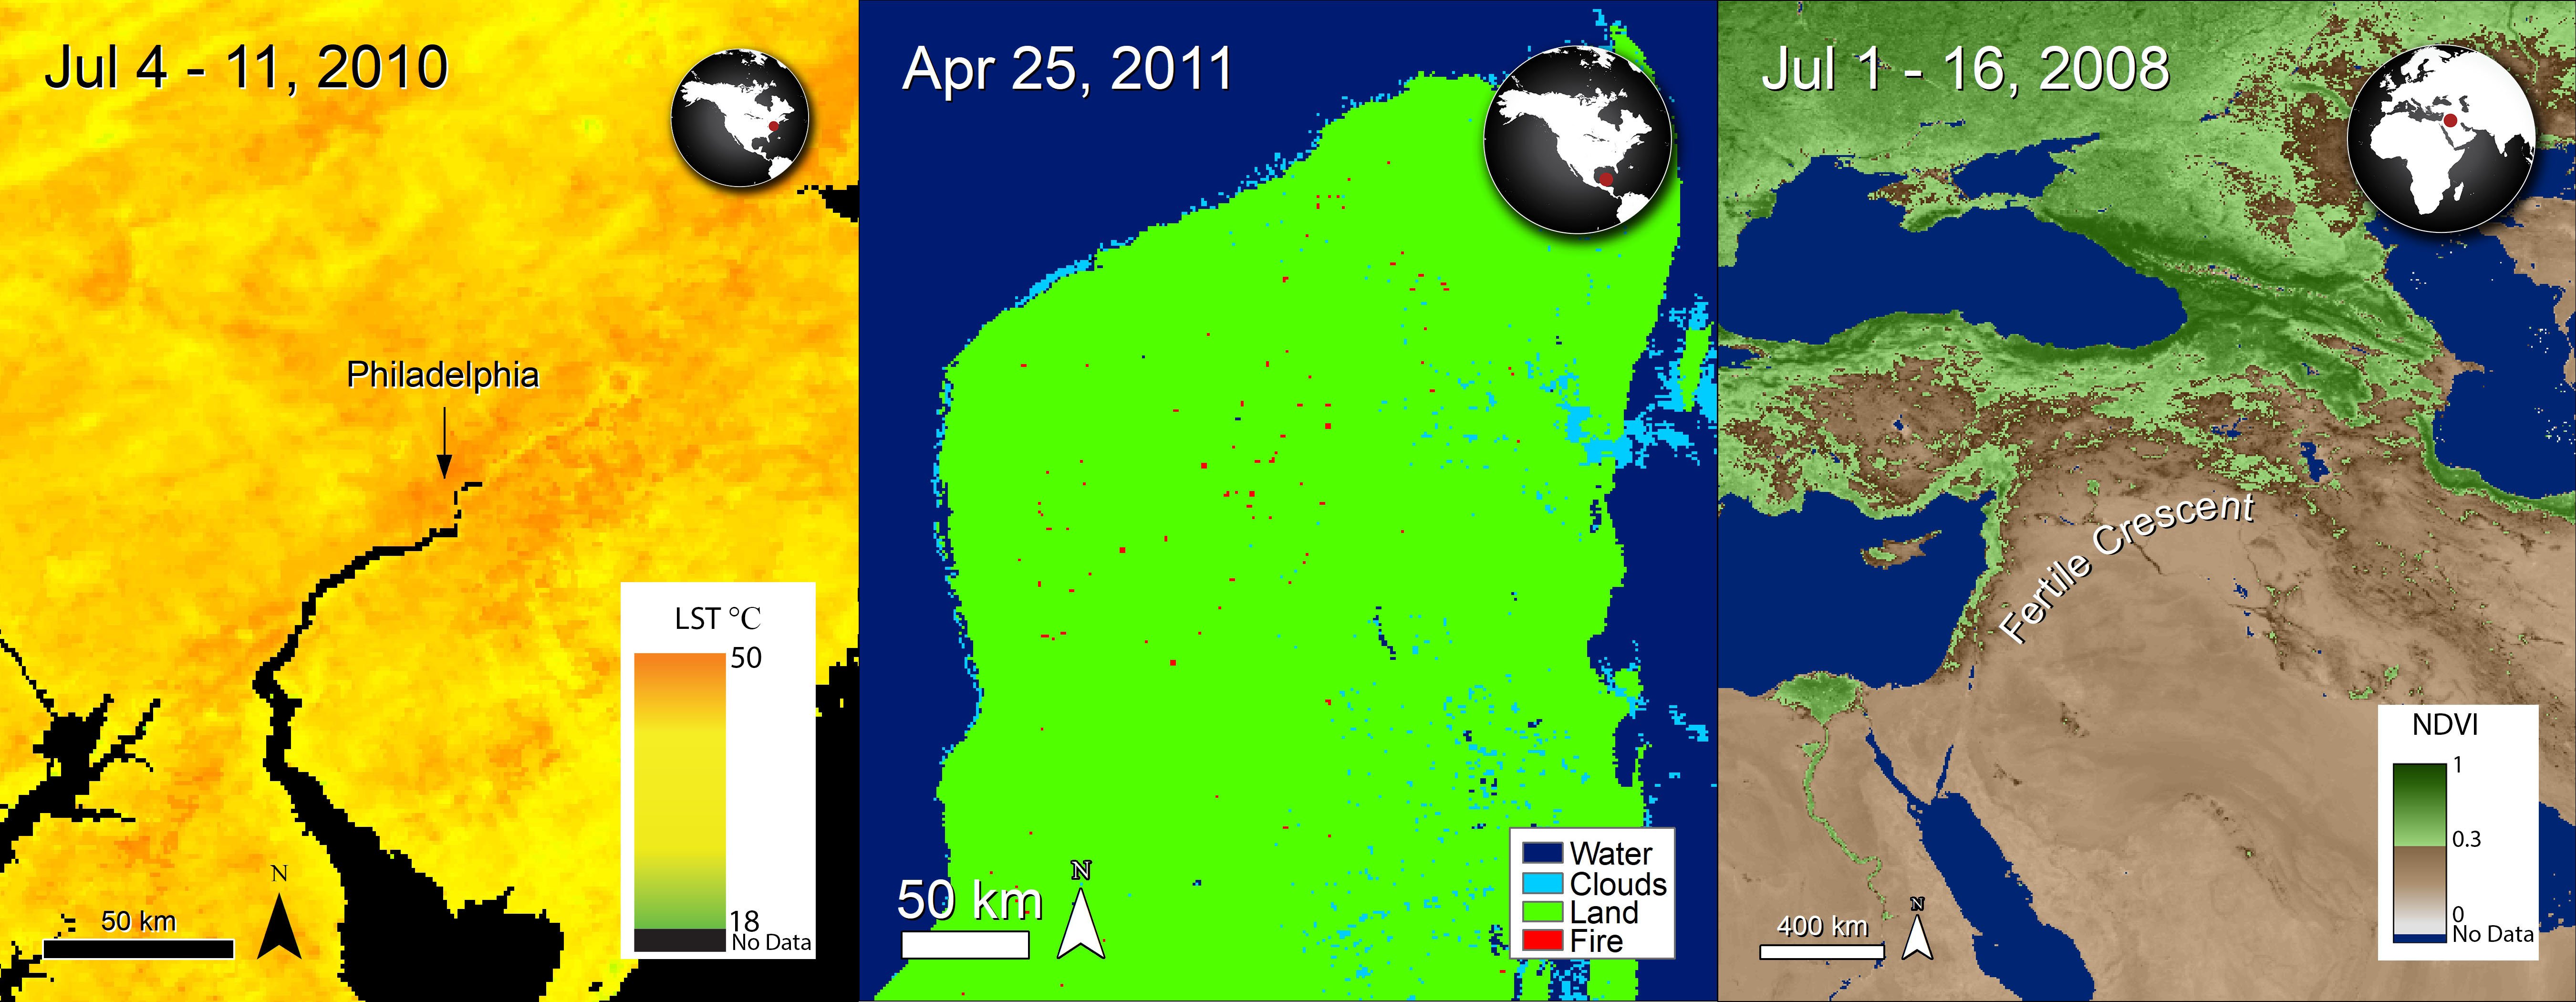
Left image: An Aqua MODIS land surface temperature image over Philadelphia, PA, during the heat wave of 2010.
Granule ID:
MYD11A2.A2010185.h12v04.006.2016041072020
MYD11A2.A2010185.h12v05.006.2016041072017
Center image: Fires, shown as red, throughout Yucatán, Mexico a few days before the tornado outbreak in the southeastern United States. This image was created using a Terra MODIS thermal anomalies and fire product.
Granule ID:
MOD14.A2011115.1650.006.2015217114429
Right image: An image of Normalized Difference Vegetation Index (NDVI) data over the Fertile Crescent from a Terra MODIS vegetation indices product during the author’s study period.
Granule ID:
MOD13C2.A2008183.006.2015177070134
References:
Beitler, J., Gautier, A., LeFevre, K., Naranjo, L., and Vizcarra, N., 2016, Sensing our planet—NASA Earth science research features 2016: National Aeronautics and Space Administration (NASA) Earth Observing System Data and Information System (EOSDIS) Snow and Ice Distributed Active Archive Center (DAAC) at the National Snow and Ice Data Center (NSIDC), accessed November 1, 2018, at https://www.earthdata.nasa.gov/learn/sensing-our-planet.
Material written by Danielle Golon1
1 Innovate!, Inc., contractor to the U.S. Geological Survey, Earth Resources Observation and Science (EROS) Center, Sioux Falls, South Dakota, USA. Work performed under USGS contract G15PC00012 for LP DAAC2.
2 LP DAAC Work performed under NASA contract NNG14HH33I.