
Sensing Our Planet: NASA Earth Science Research Features 2017 cover
Sensing Our Planet: NASA Earth Science Research Features 2017 cover
(Author's Note 2/28/2022: At the time of publishing these references were available online, some resources may no longer be available.)
Each year, the Sensing Our Planet publication features intriguing research that highlights how scientists are using Earth science data to learn about our planet. Research described in the articles uses data archived and managed by NASA Earth Observing System Data and Information System (EOSDIS) Distributed Active Archive Centers (DAACs). These articles are also a resource for learning about science and about the data, for discovering new and interdisciplinary uses of science datasets, and for locating data and education resources.
Articles and images from Sensing Our Planet: NASA Earth Science Research Features 2017 are available online at the NASA Earthdata website in both pdf and web formats.
A few of the 2017 stories feature data distributed by the Land Processes DAAC (LP DAAC). The data products used are from the Moderate Resolution Imaging Spectroradiometer (MODIS) sensor aboard both the Terra and Aqua satellites.
Drought on the range
Drought is a topic that is always on the back of a rancher’s mind, as a lack of water can impact the rancher’s herd before they are ready to be sold off as consumables. These times of drought can be observed via in situ ground stations near farms. However, these stations only provide information about their specific point location, and drought factors such as soil moisture can change within a little amount of space near each station. Therefore, researchers are turning to satellite data to see if it can help fill in the gap for drought monitoring. To do this, they tested Soil Moisture Active Passive (SMAP) data from the NSIDC DAAC against in situ soil moisture data. First the researchers used MODIS land cover data (MCD12Q1) from the LP DAAC to identify where the most applicable ground stations exist. These are ground stations in areas that contained more than 70 percent of land cover types related to ranching. Once the researchers had these points, they compared SMAP data, along with land surface temperature data (MOD11A2) from the LP DAAC, with the in situ data. Did these data correlate with the in situ data? Read the story to learn more.
To the lighthouse
The Great Lakes provide drinking water to 35 million people and hold 20 percent of the world’s surface fresh water, yet they are still surprisingly understudied. These lakes were once believed to be impervious to climate change due to their large size; however, their levels dropped between 1998 and 2014 to the longest low-level time period over the span of 100 years. Thus, researchers want to learn more about the water cycles of these lakes, particularly how evaporation impacts the lakes, and are using remote sensing data to study them. This study focused on Lake Huron. The authors used geolocation data, cloud optical data, and air and dew point temperature data from the LAADS DAAC, combined with Land Surface Temperature and Emissivity data (MOD11_L2) from the LP DAAC, to estimate evaporation for the entire lake. Do you think the lake experiences more evaporation during the winter or the summer? Read the article to find out!
A spread of green
Siberia was once a cold large mass of sub-Arctic taiga and the Arctic tundra biomes that were home to small scattered populations. However, the discovery of oil and minerals in the 1900s brought large populations to the area in search of jobs. Researchers found this as an opportune time to use MODIS Normalized Difference Vegetation Index (NDVI) (MOD13Q1) data from the LP DAAC to study how cities and urban heat islands impact taiga and tundra, and the permafrost, or permanently frozen ground, found in these biomes. Read the article to learn how urban development and climate change are impacting this area.
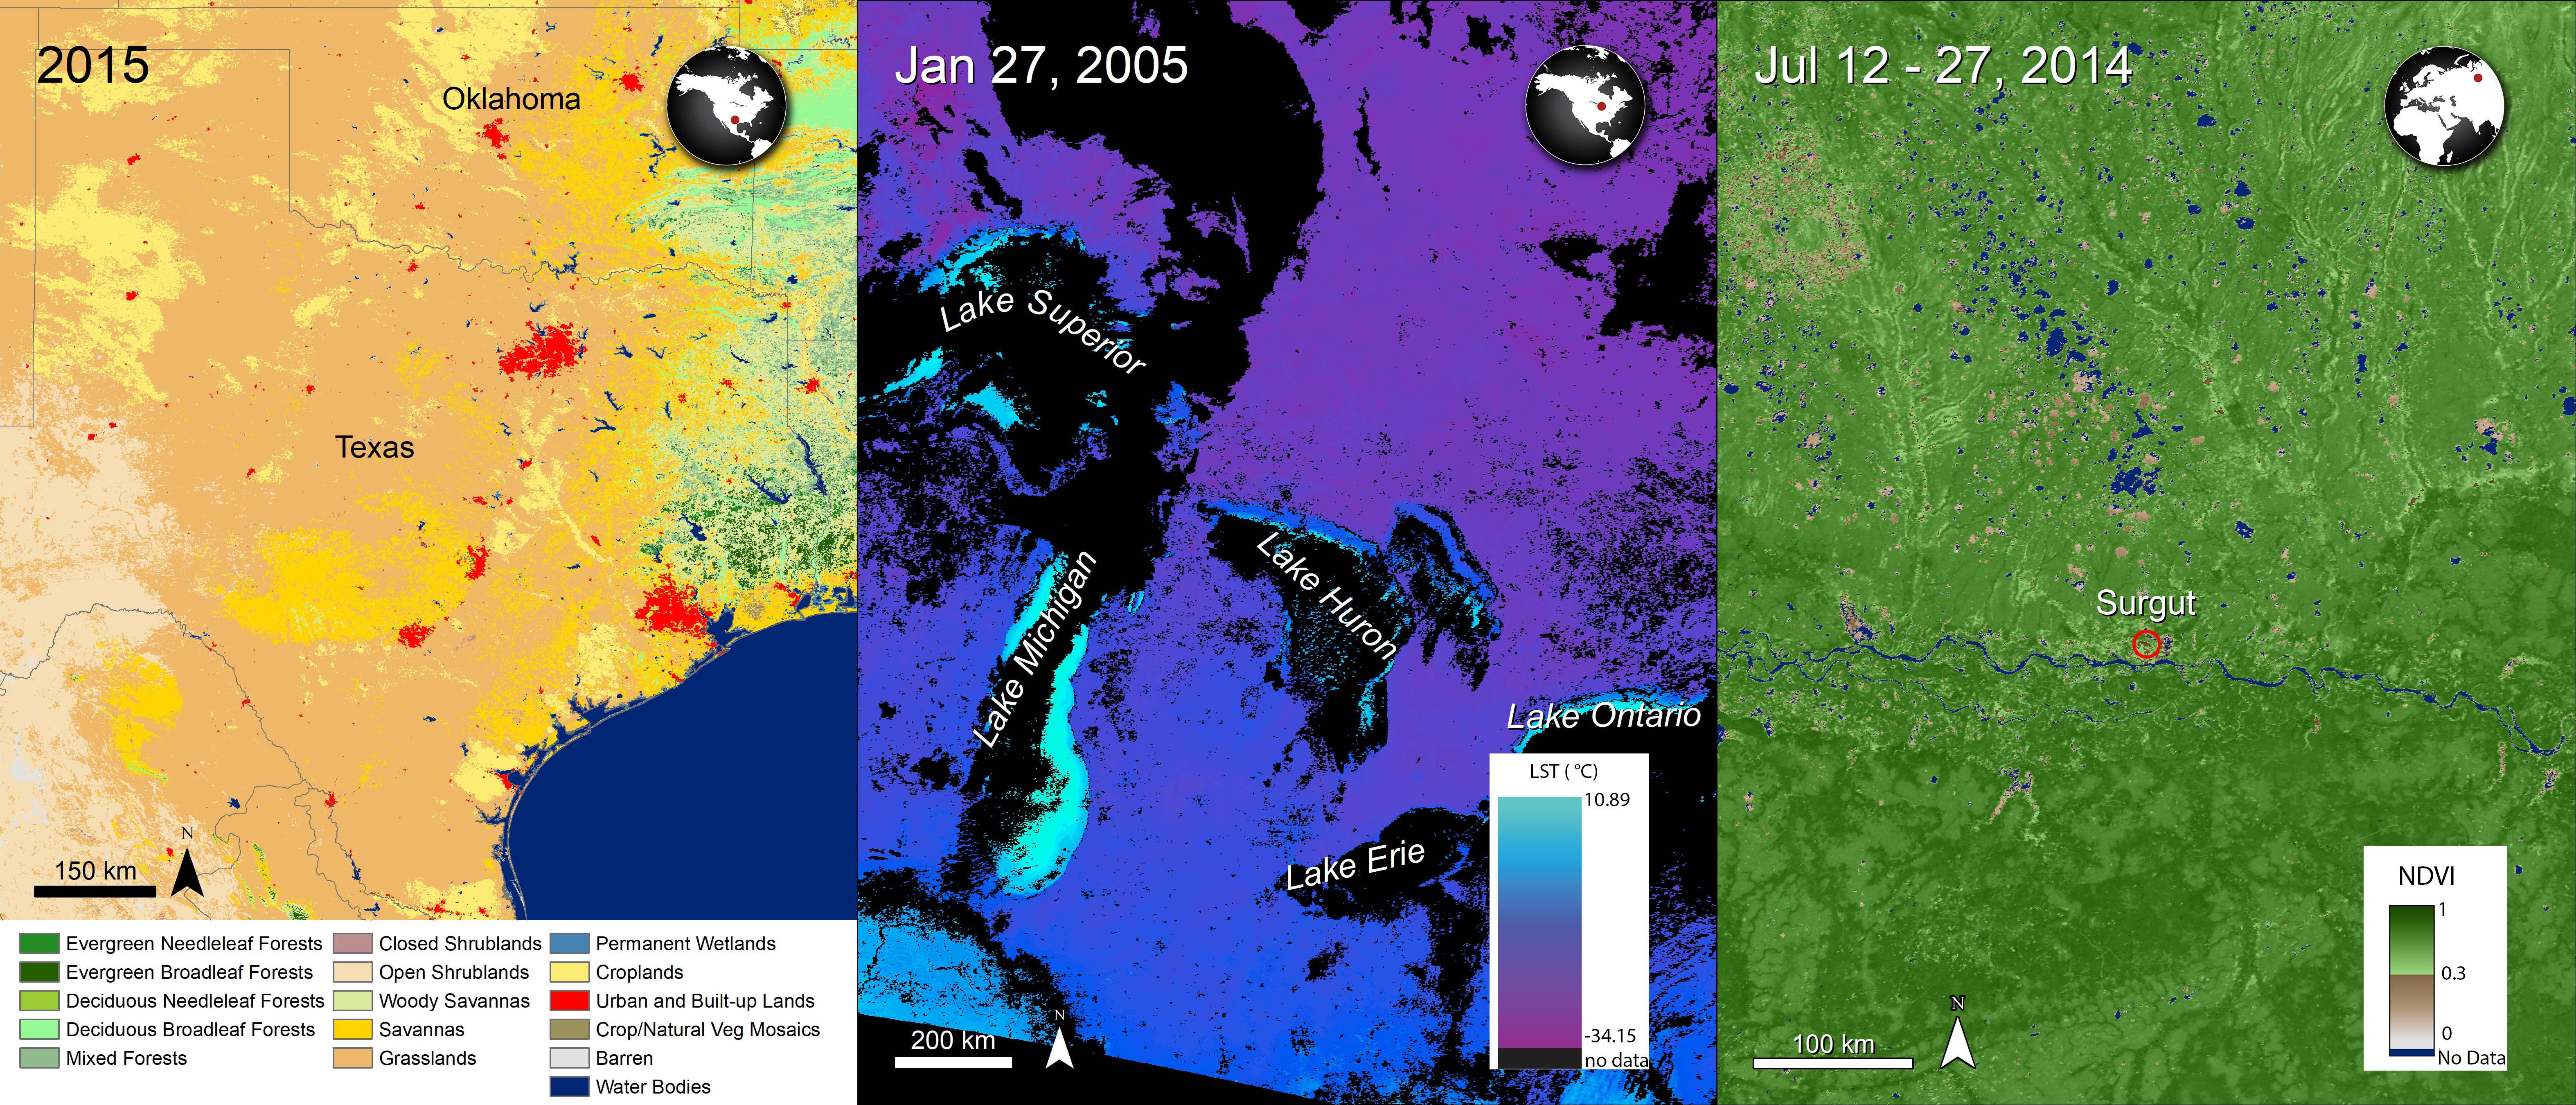
Left image: A combined MODIS land cover image over the US states of Texas and Oklahoma.
Granule ID:
MCD12Q1.A2015001.h08v05.006.2018055062742
MCD12Q1.A2015001.h08v06.006.2018055062749
MCD12Q1.A2015001.h09v05.006.2018055062825
MCD12Q1.A2015001.h09v06.006.2018055062829
MCD12Q1.A2015001.h10v05.006.2018055062904
Center image: A MODIS land surface temperature image over the Great Lakes, including Lake Huron, the lake studied in this article, during the winter of 2005. Notice how areas near the lake and lake shores are warmer than the land around the lake in the winter.
Granule ID:
MOD11_L2.A2005027.1635.006.2015241182321
Right image: An image of Normalized Difference Vegetation Index (NDVI) data over the oil boom town of Surgut, Russia, from a Terra MODIS vegetation indices product during the authors’ study period.
Granule ID:
MOD13Q1.A2014193.h21v02.006.2015289010428
References:
Beitler, J., Gautier, A., LeFevre, K., Naranjo, L., and Vizcarra, N., 2017, Sensing our planet—NASA Earth science research features 2017: National Aeronautics and Space Administration (NASA) Earth Observing System Data and Information System (EOSDIS) Snow and Ice Distributed Active Archive Center (DAAC) at the National Snow and Ice Data Center (NSIDC), accessed November 28, 2018, at https://earthdata.nasa.gov/learn/sensing-our-planet.
Material written by Danielle Golon1
1 Innovate!, Inc., contractor to the U.S. Geological Survey, Earth Resources Observation and Science (EROS) Center, Sioux Falls, South Dakota, USA. Work performed under USGS contract G15PC00012 for LP DAAC2.
2 LP DAAC Work performed under NASA contract NNG14HH33I.