Data products distributed by the Land Processes Distributed Active Archive Center (LP DAAC) are used in many different Earth Science applications. LP DAAC data products play an important role in modeling, detecting changes to the landscape, and assessing ecosystem variables, to name a few. Three of those applications, published between January and March 2021, are highlighted below. A more comprehensive list is available on the LP DAAC Publications web page.
Rishmawi, K., Huang, C., and Zhan, X., 2021, Monitoring key forest structure attributes across the conterminous United States by integrating GEDI LiDAR measurements and VIIRS data: Remote Sensing, v. 13, no. 3.
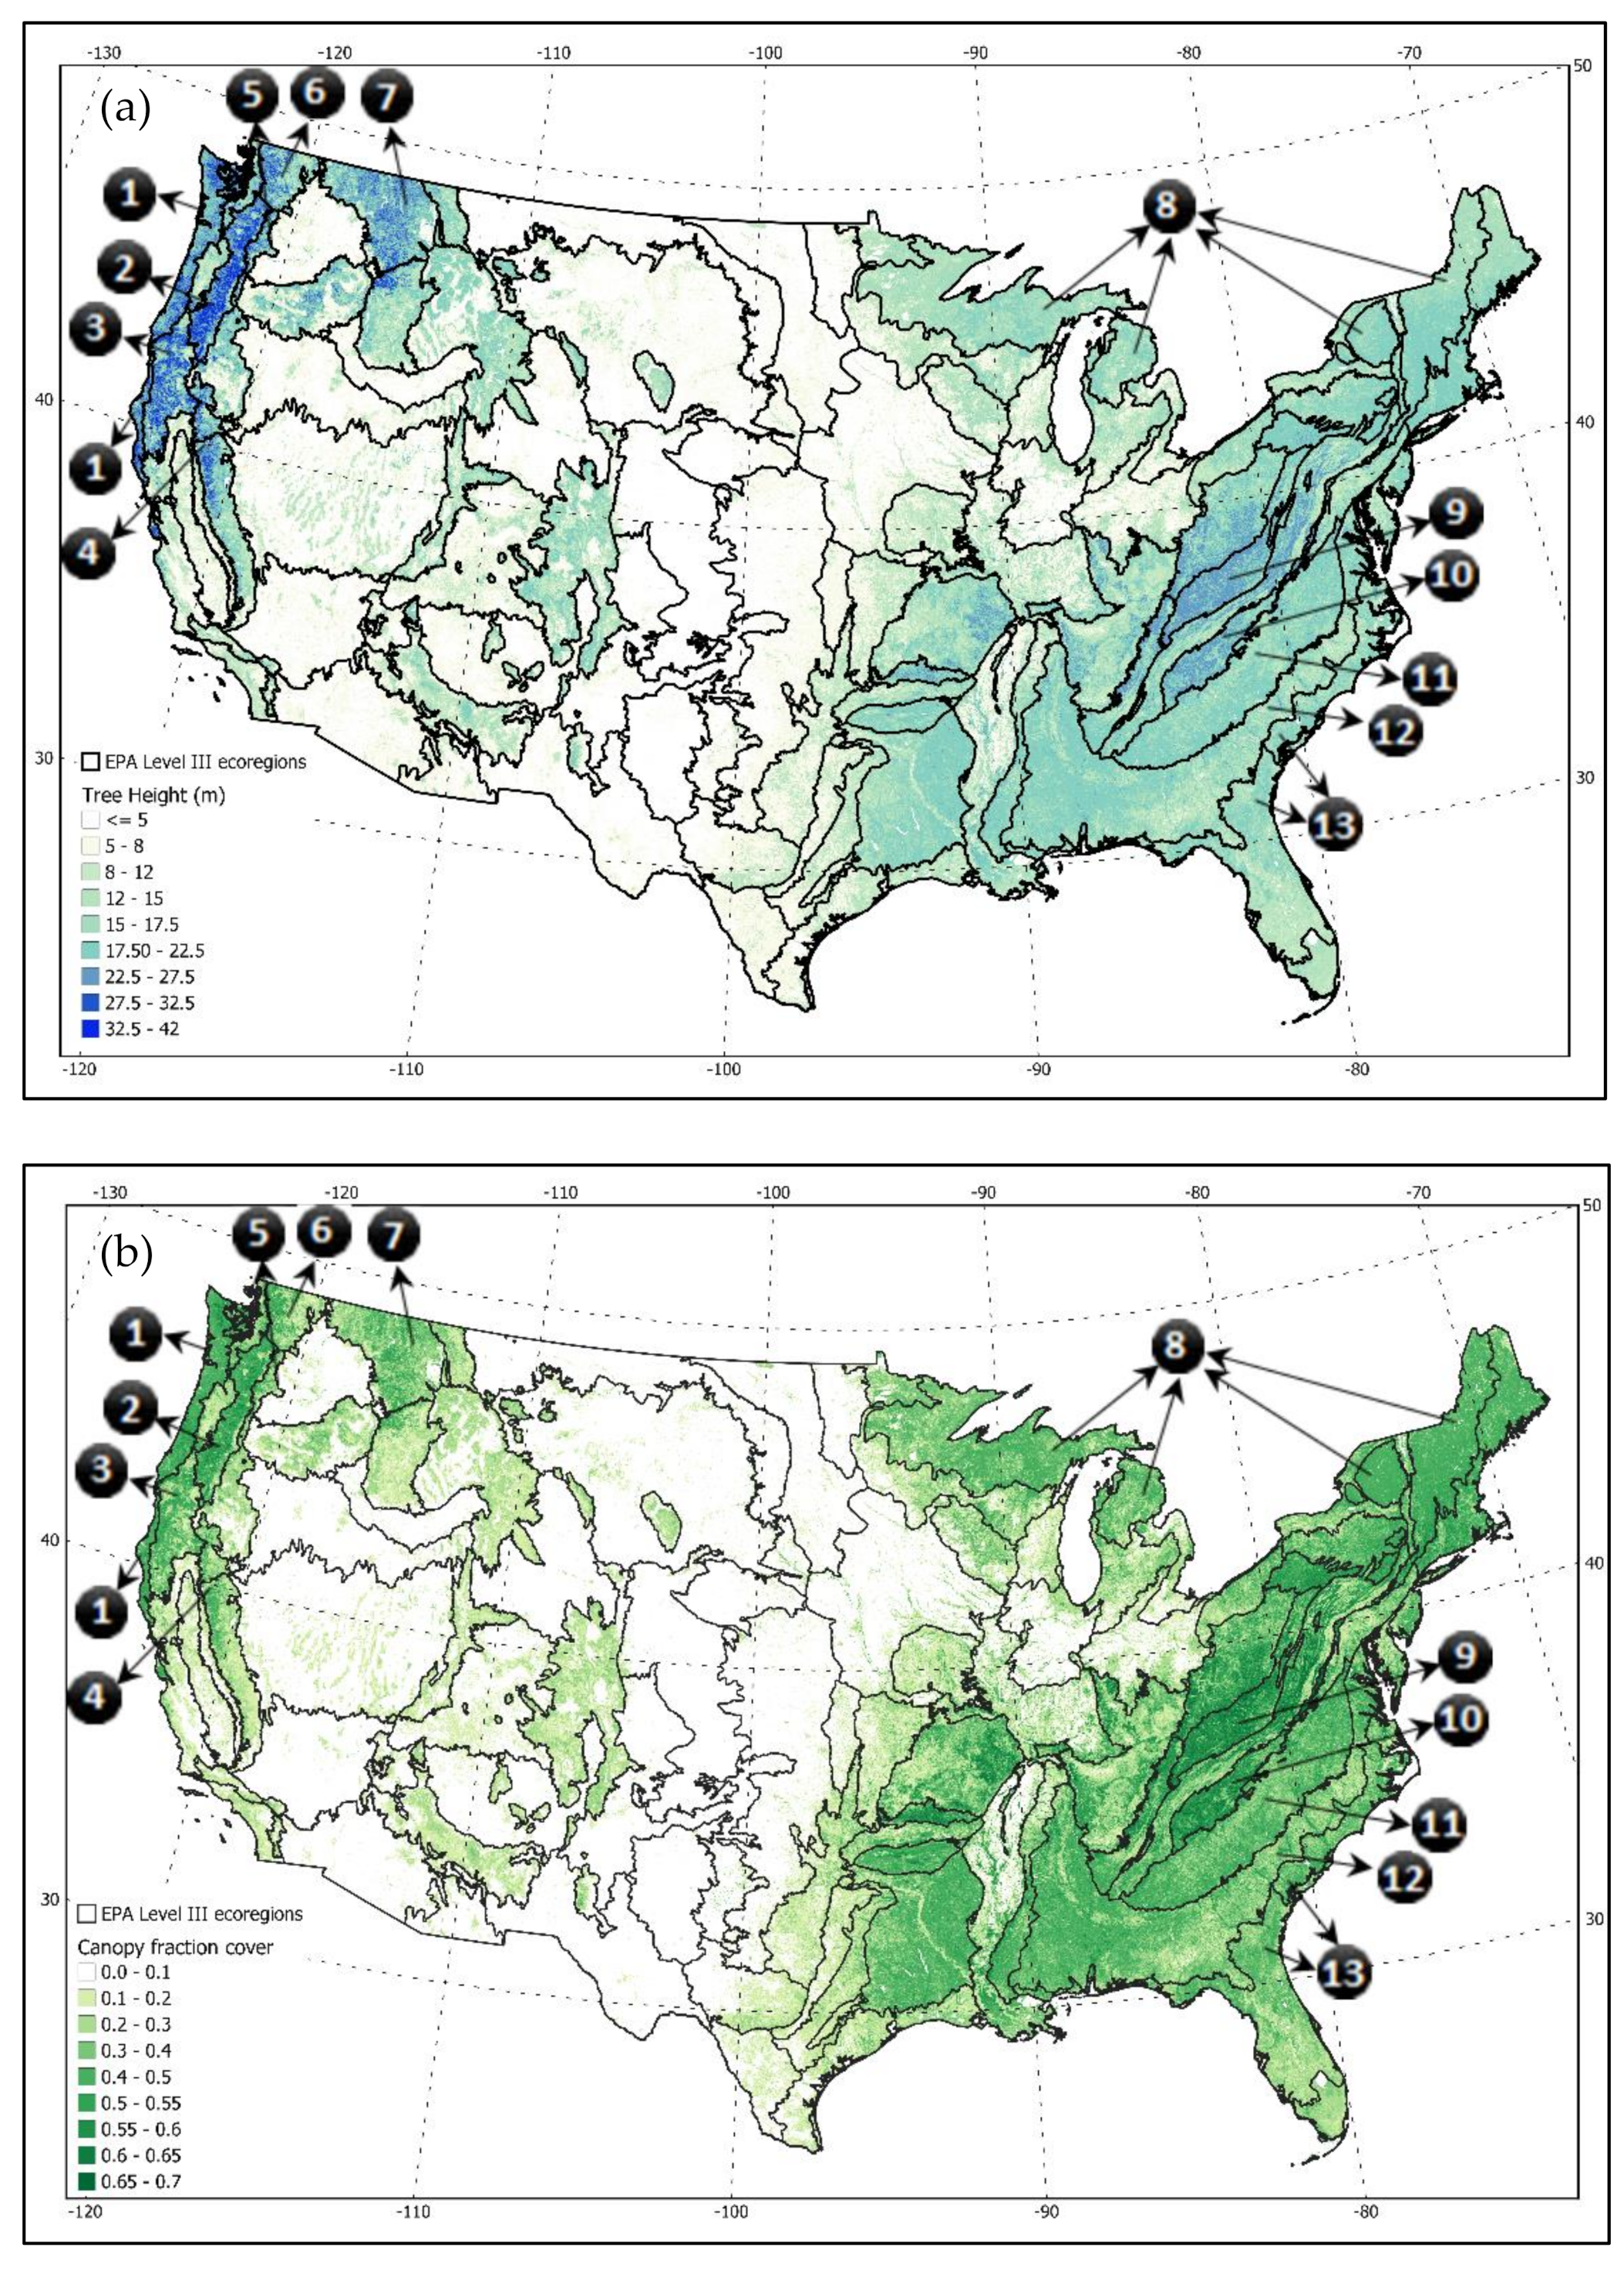
Two maps for the conterminous US for the year 2019 created by Rishmawi and others (2021). The top map shows canopy height and the bottom map shows canopy fraction cover.
Key:
1) Marine West Coast Forests
2) The Cascades
3) Klamath Mountains
4) Sierra Nevada
5) Eastern Cascades
6) North Cascades
7) Northern Rockies
8) Northern Hardwood Forests
9) Central Appalachians
10) Blue Ridge Mountains
11) Piedmont Plateau
12) Southern Plains
13) Coastal Plains
Image provided by the authors, Rishmawi and others (2021).
Satellite-based remote sensing observations have been successfully used to monitor land changes around the globe. However, there is still a lack of data to map and monitor the 3-dimensional (3D) structure of the Earth’s forests on a global scale. The Global Ecosystem Dynamics Investigation (GEDI), installed on the International Space Station (ISS) in 2018, was specifically designed to produce the first high resolution laser ranging observations of the 3D structure of the Earth optimized for measuring the Earth’s forests and topography.
Here, Rishmawi and others (2021) look into the potential of extrapolating GEDI-derived forest structure attributes into annual (2019) 1 kilometer (km) maps of the conterminous United States (CONUS) for tree height (TH), canopy fraction cover (CFC), plant area index (PAI), and foliage height diversity (FHD) using GEDI Level 2B Canopy Cover and Vertical Profile Metrics data (GEDI02_B), Joint Polar Satellite System-1 (JPSS-1) National Oceanic and Atmospheric Administration – 20 (NOAA-20) Visible Infrared Imaging Radiometer Suite (VIIRS) Surface Reflectance data, and Suomi National Polar-Orbiting Partnership (Suomi NPP) VIIRS Land Surface Phenology (VNP22Q2) data.
First, the authors process nine VIIRS Moderate (M) bands to create consistent land surface phenology inputs to model a 3D canopy structure. The authors then extract canopy height (rh100), canopy cover, PAI, and FHD from the GEDI L2B product and filter to select the highest quality observations. The GEDI data were then mapped and aggregated into the VIIRS 1km sinusoidal grid system. The pairs of GEDI and VIIRS metrics were then split into calibration and validation datasets. The calibration data were used to train four random forest regression models to predict Canopy Height (CH), CFC, PAI, and FHD and ultimately to create wall-to-wall maps of those metrics over CONUS, minus water bodies. The VIIRS-modeled CH map found the tallest tree heights in the Klamath Mountains, the Cascades, and the Marine West Coast Forests, and a high CFC percentage in the Blue Ridge and Central Appalachians (see map). The authors found their method does provide a valid representation of the ability to produce 3D canopy structure maps across CONUS and can aid in future modeling of global forest biomass stocks. However, the authors note a robust accuracy assessment of the data still needs to be completed. In the future, the authors believe a study should be conducted to assess the potential of using the VIIRS 350-meter data as well.
(Author’s note: Rishmawi and others (2021) used JPSS-1 (NOAA-20) Surface Reflectance data in their study. JPSS-1 (NOAA-20) Surface Reflectance data and additional data products will be available from the LP DAAC in the future. In addition, the authors used GEDI Level 2B Version 1 data, the LP DAAC recently released GEDI Level 2B Version 2 data, which can be found here: https://doi.org/10.5067/GEDI/GEDI02_B.002.)
Kotchi, S.O., Bouchard, C., Brazeau, S., and Ogden, N., 2021, Earth observation-informed risk maps of the Lyme disease vector Ixodes scapularis in central and eastern Canada: Remote Sensing, v. 13, no. 3, at https://doi.org/10.3390/rs13030524.
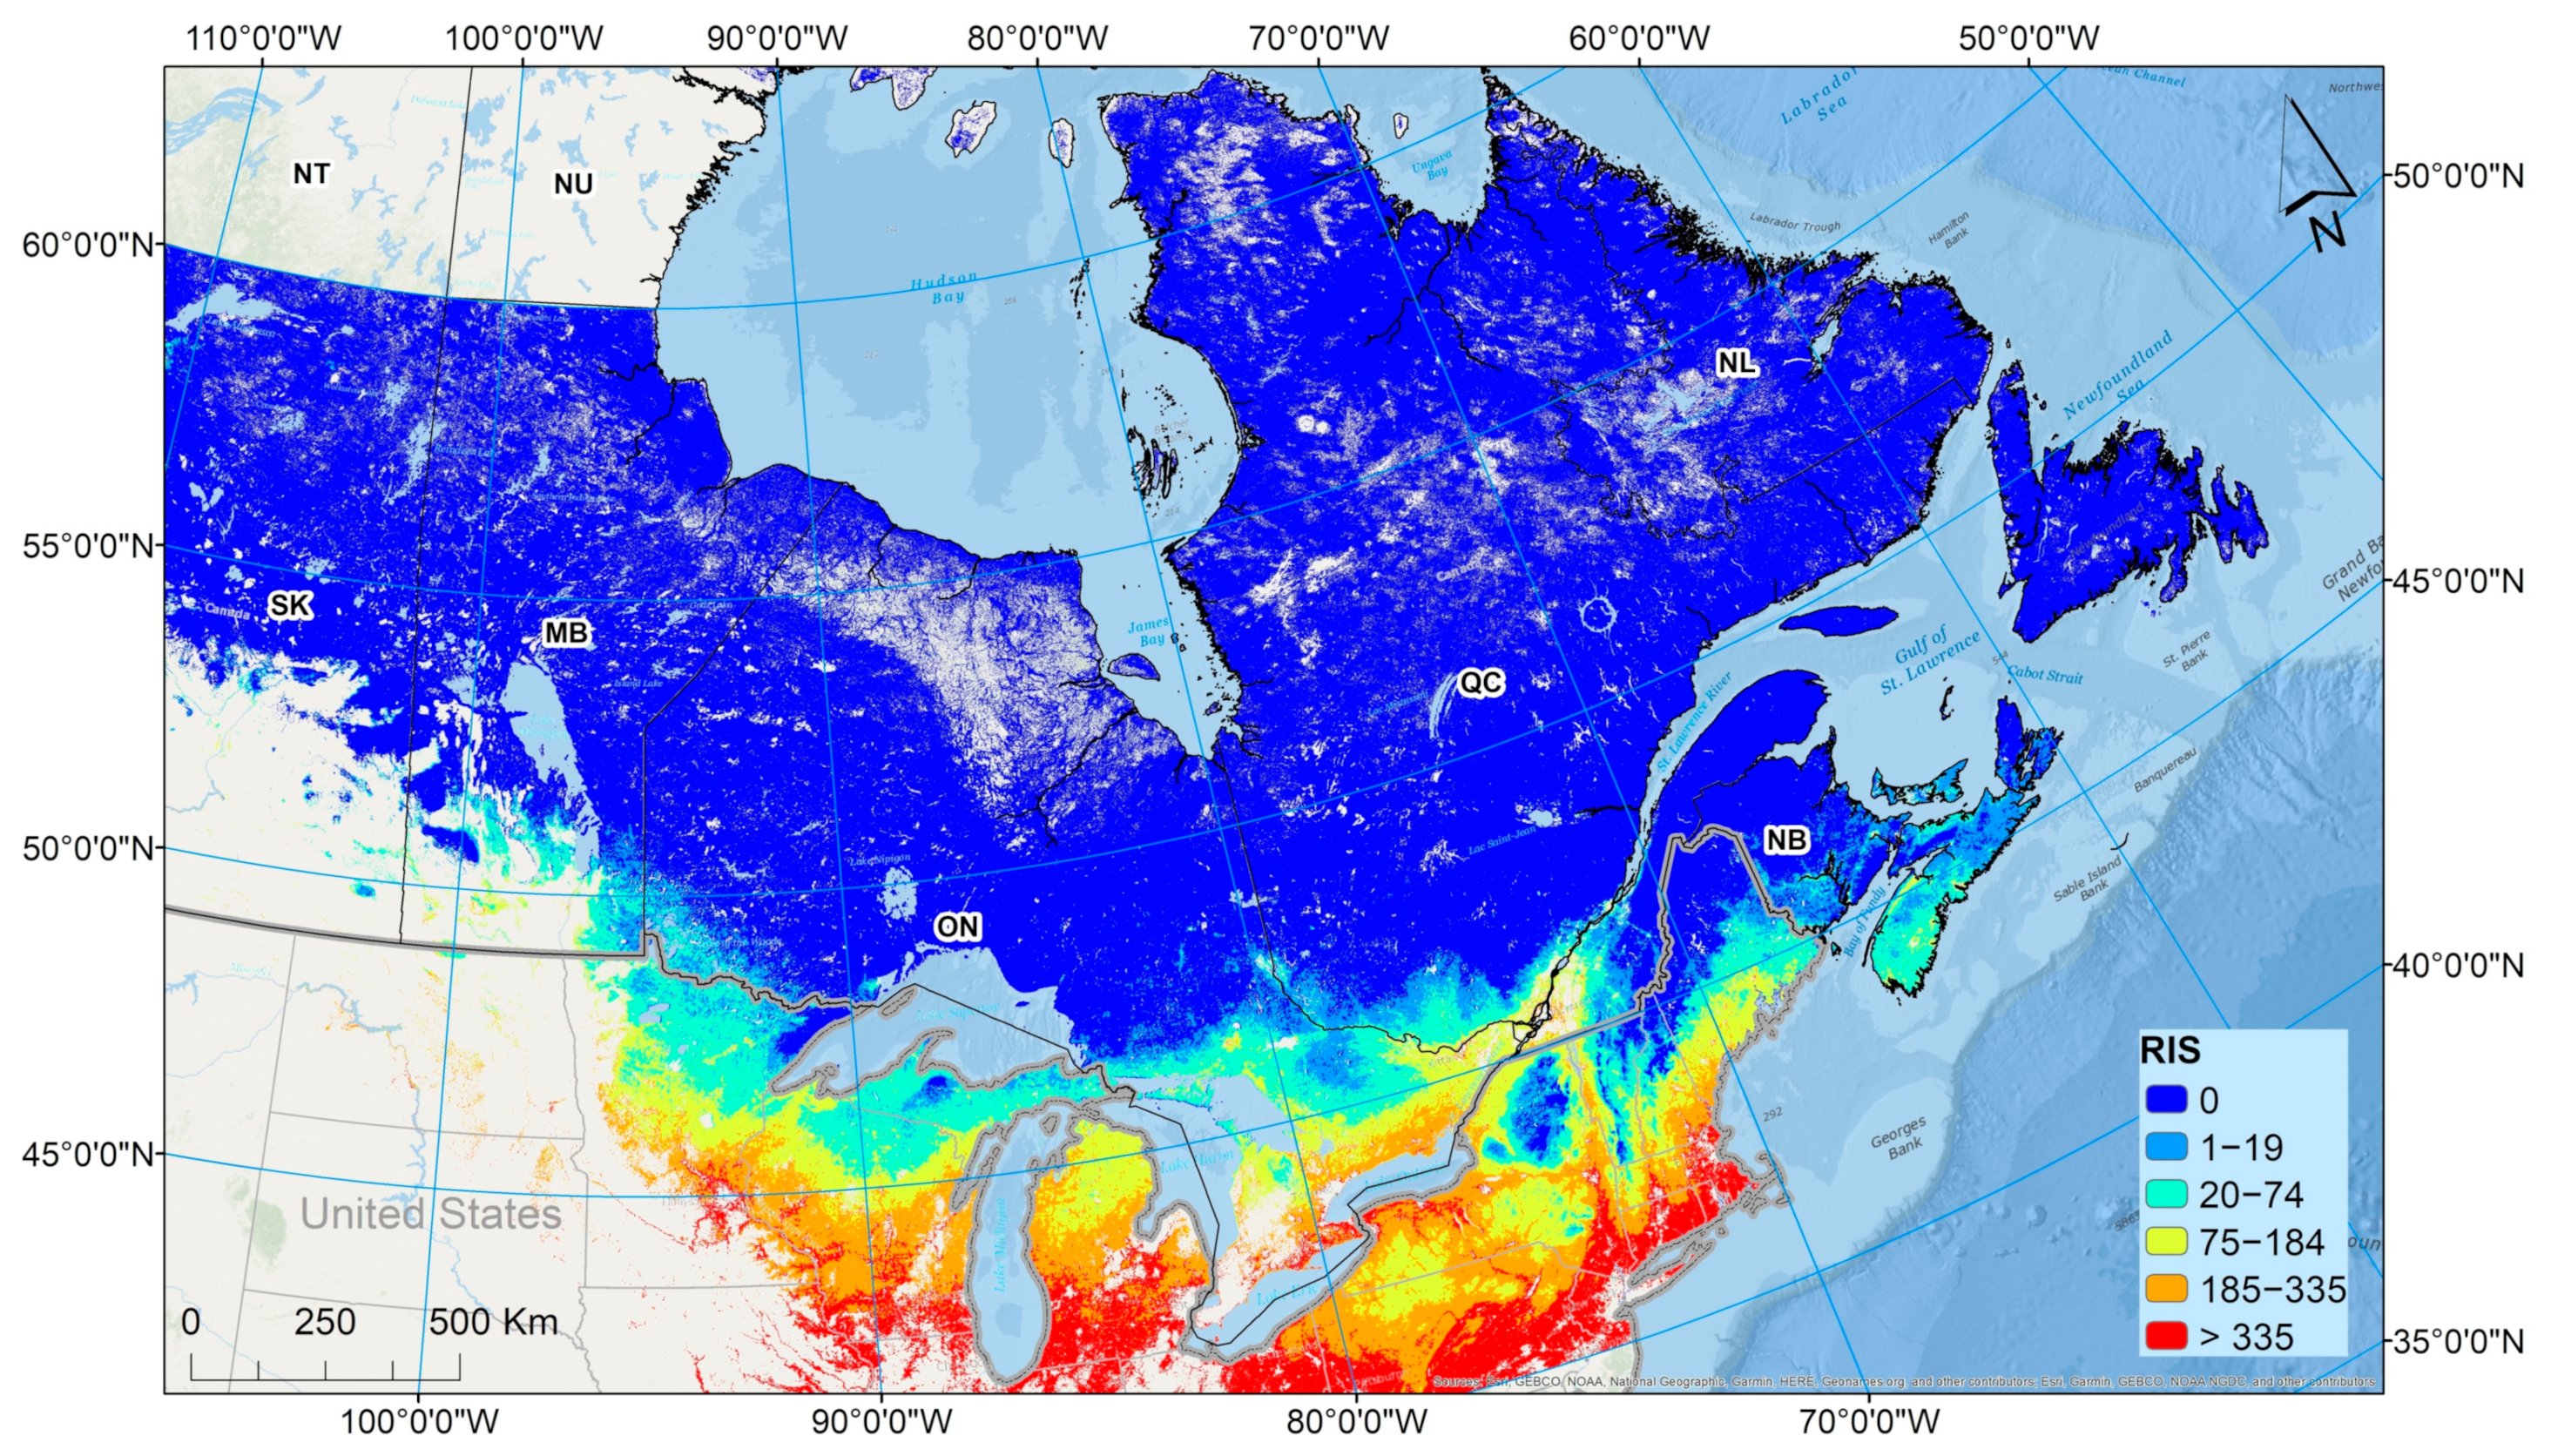
A map created by Kotchi and others (2021) of the average risk of Ixodes scapularis in Central and Eastern Canada from 2000 to 2015.
Image provided by the authors, Kotchi and others (2021).
A map created by Kotchi and others (2021) of the average risk of Ixodes scapularis in Central and Eastern Canada from 2000 to 2015.
Image provided by the authors, Kotchi and others (2021).
Regions in northern latitudes are experiencing not only higher average temperatures but are also experiencing warmer temperatures for more days during a year. These factors can impact the geographic extent of suitable habitats for species. In some cases, this can have dramatic implications for human health. Disease vectors – species capable of carrying and transmitting diseases, like mosquitoes and ticks – are often beneficiaries of this type of climate change scenario, expanding their suitable habitat range into places that were once too cold for them to thrive. With this habitat expansion comes the expansion of the infectious diseases these vectors can transport and pass on to humans. Kotchi and others (2021) use remote sensing data to observe and map how environmental habitat suitability has changed from 2000 to 2015 for deer ticks (Ixodes scapularis), a known vector for Lyme disease. The study area included the central and eastern Canadian provinces of Manitoba, Ontario, Quebec, New Brunswick, and Nova Scotia.
The authors chose to use Earth observation remote sensing data because they provide a large consistent coverage over the Earth on a regular basis, with spatially, temporally, and spectrally consistent resolutions that can be used to observe historical and current environmental conditions. The authors specifically use Terra Moderate Resolution Imaging Spectroradiometer (MODIS) Land Surface Temperature and Emissivity (MOD11A2) data and Land Cover Type (MCD12Q1) data for their research. Using these data they developed an algorithm to predict tick occurrence by combining cumulative annual surface degree-days above 0°C and forest cover (CSDF), which was adjusted using a tick population model to create a risk of I. scapulari (RIS) map and validated using meteorological data and tick surveillance data. The authors found the presence of the deer tick was significantly associated with CSDF, which increased in most of the study area throughout the study period. On average the RIS was higher in Ontario and Quebec, especially in the southernmost regions, where the most populous areas are also found. The authors believe their risk maps provide helpful information on where surveillance for emerging tick populations should be focused to aid in meeting public health needs.
(Author’s note: Kotchi and others (2021) used Terra MODIS Version 6 data. Since the publication of this paper, the LP DAAC has released a Terra MODIS 8-Day Land Surface Temperature and Emissivity Version 6.1 data product. More information on the Version 6.1 product is available: https://doi.org/10.5067/MODIS/MOD11A2.061.)
Pour, A.B., Sekandari, M., Rahmani, O., Crispini, L., Laufer, A., Park, Y., Hong, J.K., Pradhan, B., Hashim, M., Hossain, M.S., Muslim, A.M., and Mehranzamir, K., 2021, Identification of phyllosilicates in the Antarctic environment using ASTER satellite data— Case study from the Mesa Range, Campbell and Priestley Glaciers, Northern Victoria Land: Remote Sensing, v. 13, no. 1, at https://doi.org/10.3390/rs13010038.
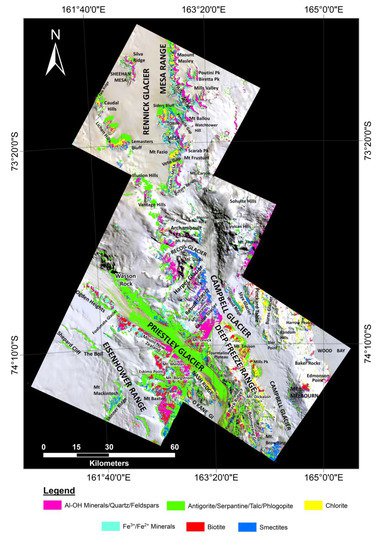
A mosaic phyllosilicates map of the Mesa Range, Campbell and Priestley Glaciers, created by Pour and others (2021) and derived from VNIR+SWIR and TIR bands of ASTER.
Image provided by the authors, Pour and others (2021).
A mosaic phyllosilicates map of the Mesa Range, Campbell and Priestley Glaciers, created by Pour and others (2021) and derived from VNIR+SWIR and TIR bands of ASTER.
Image provided by the authors, Pour and others (2021).
According to Pour and others (2021), phyllosilicates are an important family of altered mineral groups. Spectral discrimination of phyllosilicates can help in analyzing weathering processes and identifying parent lithologies, or physical characteristics, in poorly exposed zones. However, spectral mapping in remote areas like Antarctica can be difficult and dangerous to do. That is why in this study the authors investigate using Terra Advanced Spaceborne Thermal Emission and Reflection Radiometer (ASTER) Level 1T Precision Terrain Corrected (AST_L1T) data to map and discriminate phyllosilicate mineral groups in the northern Victoria Land of Antarctica. The authors use Mixture-Tuned Matched-Filtering (MTMF) and Constrained Energy Minimization (CEM) algorithms to detect different phyllosilicates at a sub-pixel level for four main phyllosilicate groups, including Al-rich, Fe3+-rich, Fe2+-rich, and Mg-rich. The Terra ASTER data was able to spectrally detect, map, and differentiate phyllosilicates in exposed lithologies of the study area.
Material written by Danielle Golon1
1C2G, contractor to the U.S. Geological Survey, Earth Resources Observation and Science (EROS) Center, Sioux Falls, South Dakota, USA. Work performed under USGS contract G0121D0001 for LP DAAC2.
2LP DAAC Work performed under NASA contract NNG14HH33I.