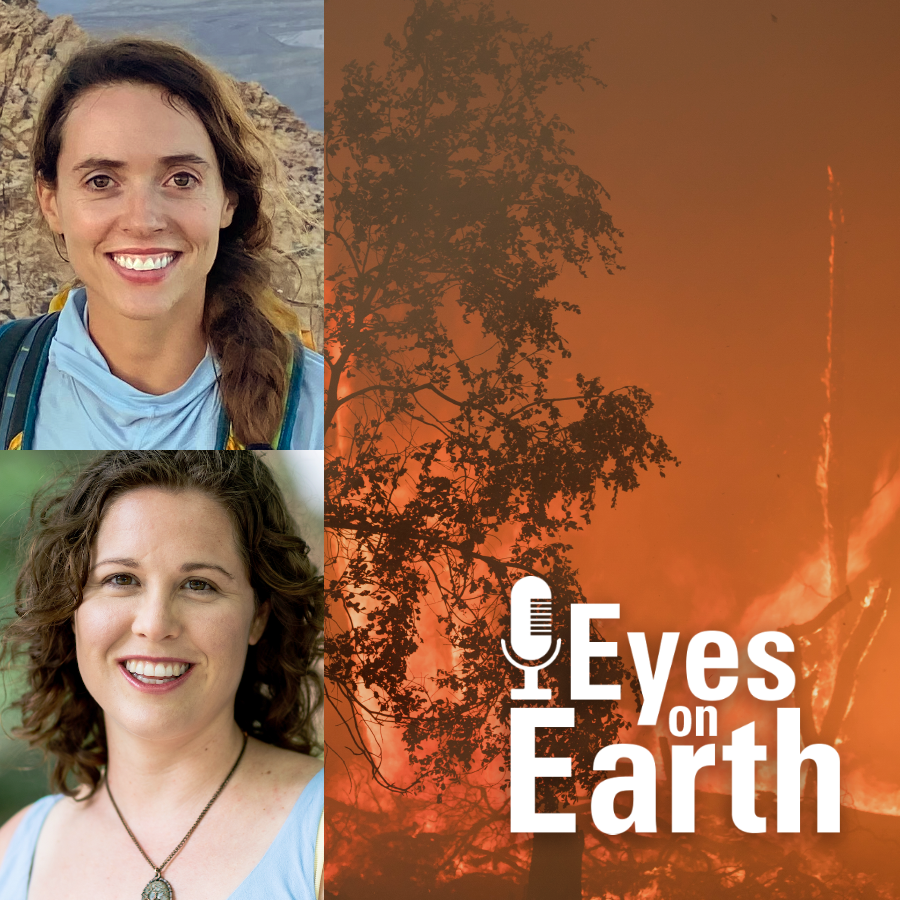
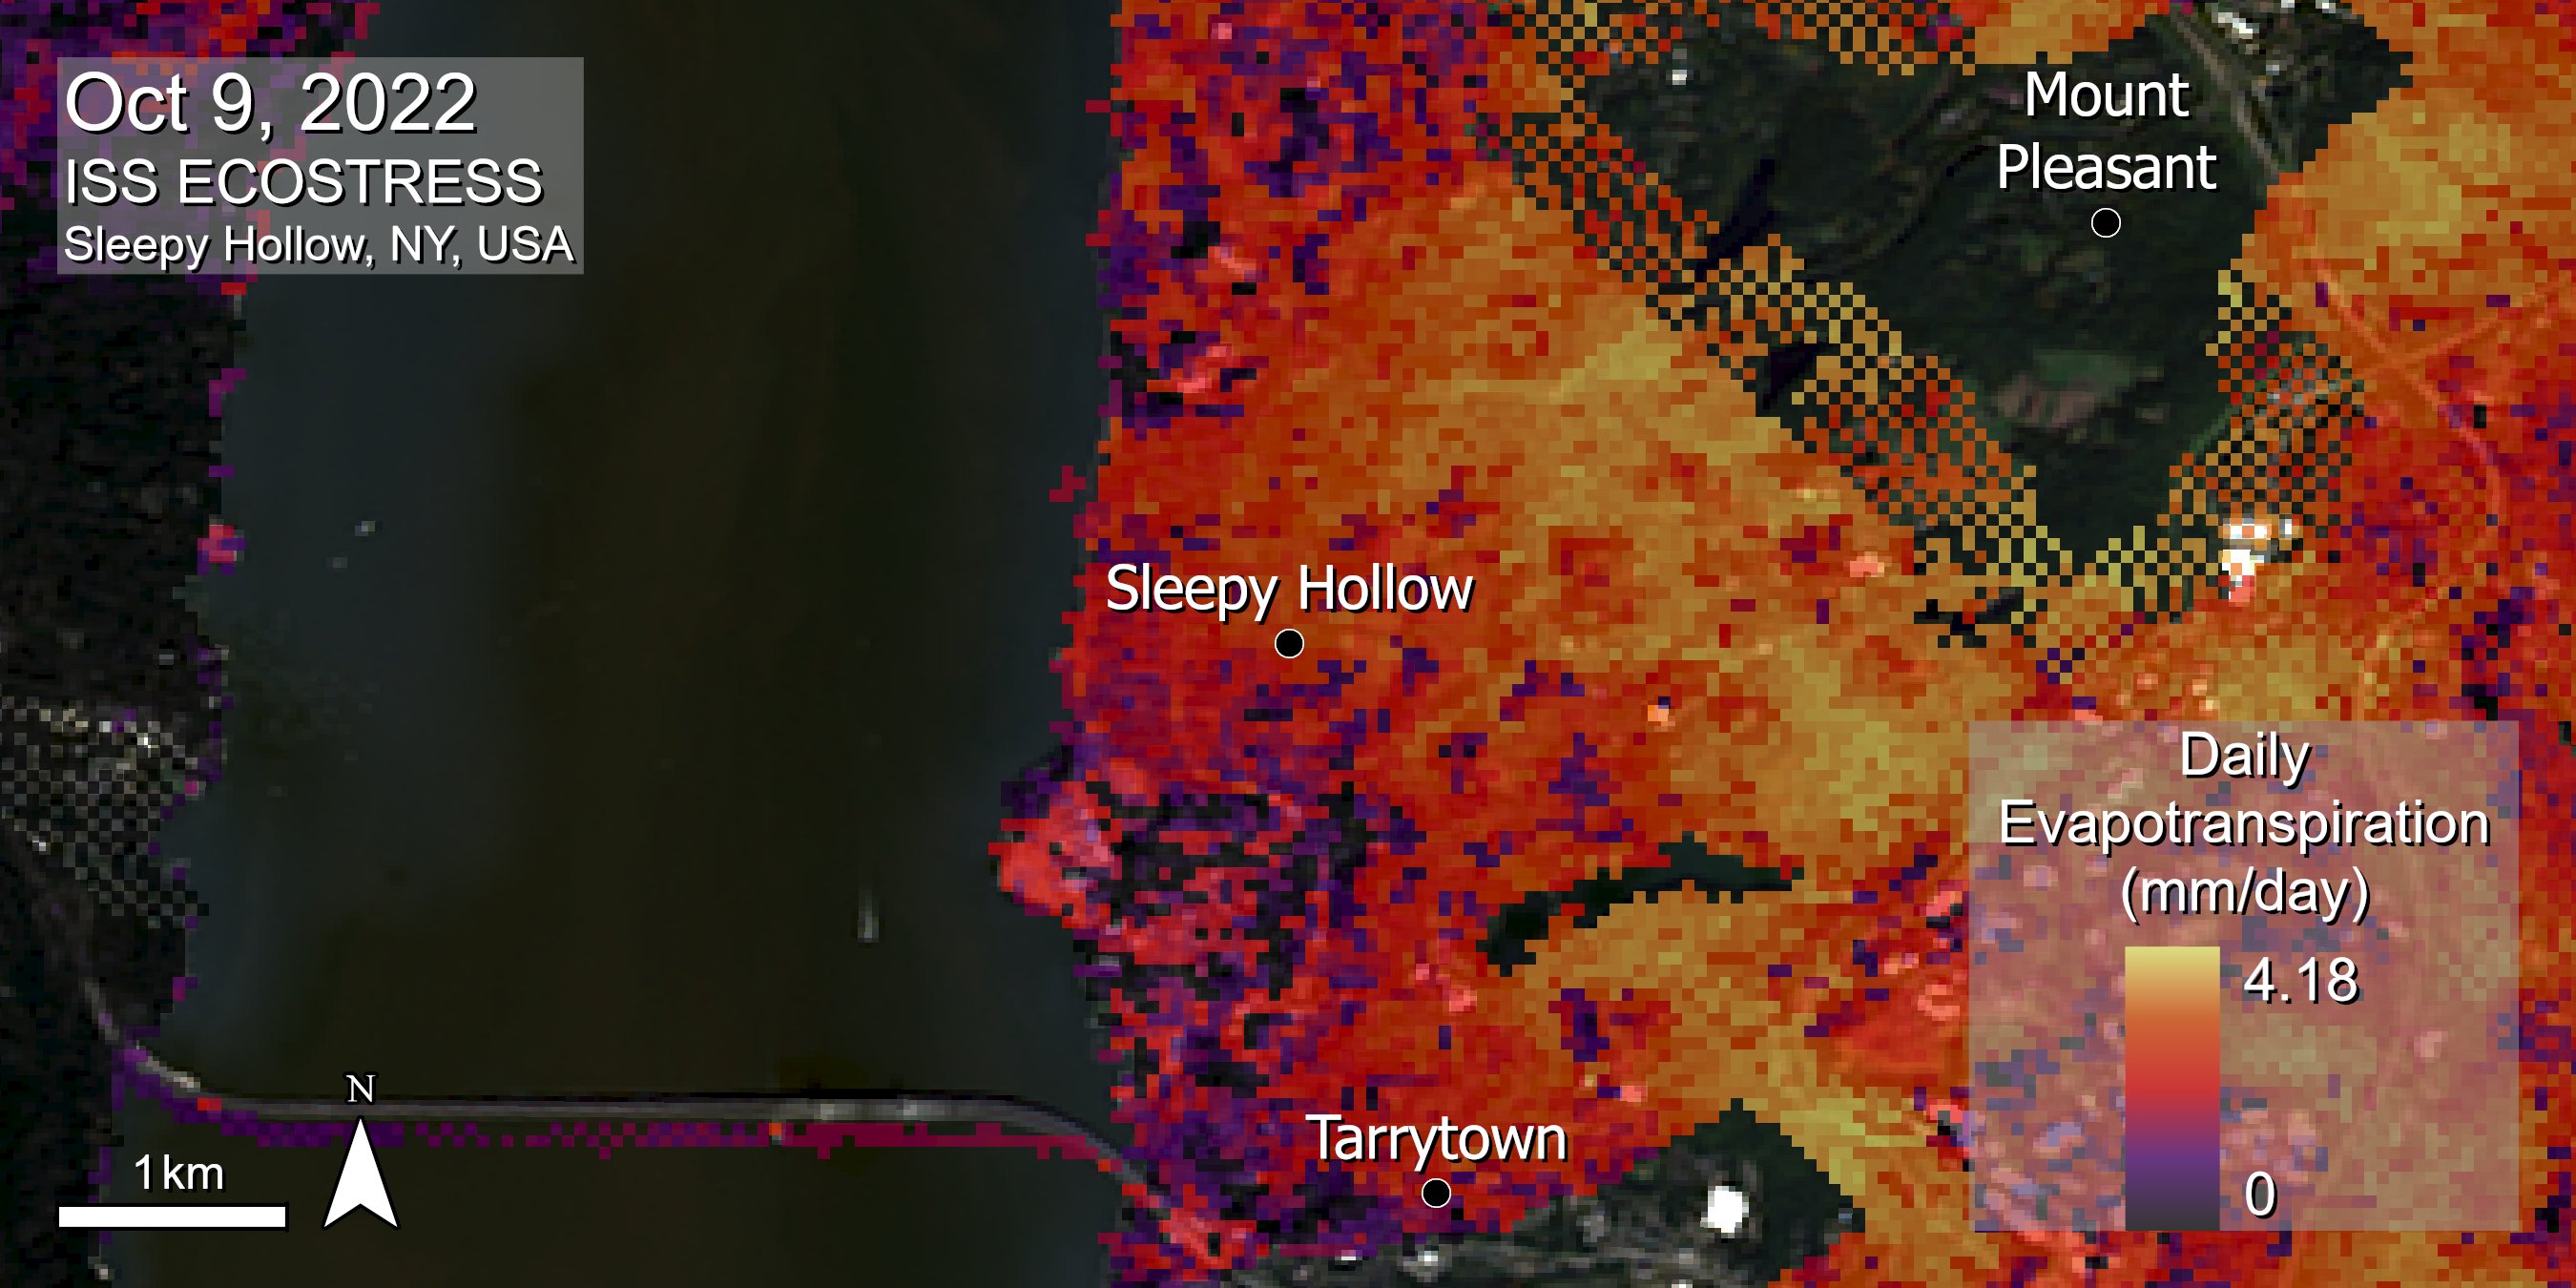
Plug in your headphones and listen to some science! The latest episode of the USGS podcast Eyes on Earth is out and features data from the ECOsystem Spaceborne Thermal Radiometer Experiment on Space Station (ECOSTRESS) Mission distributed by NASA’s Land Processes Distributed Active Archive Center (LP DAAC).
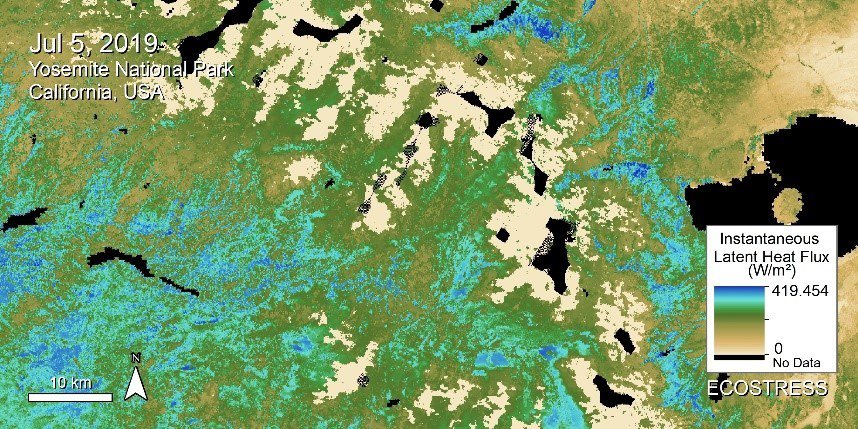
Madeleine Pascolini-Campbell from NASA’s Jet Propulsion Laboratory at the California Institute of Technology, and Natasha Stavros from the Earth Lab Analytics Hub at the University of Colorado Boulder discuss their use of ECOSTRESS data in predicting spatial patterns of burn severity for recent California wildfires.
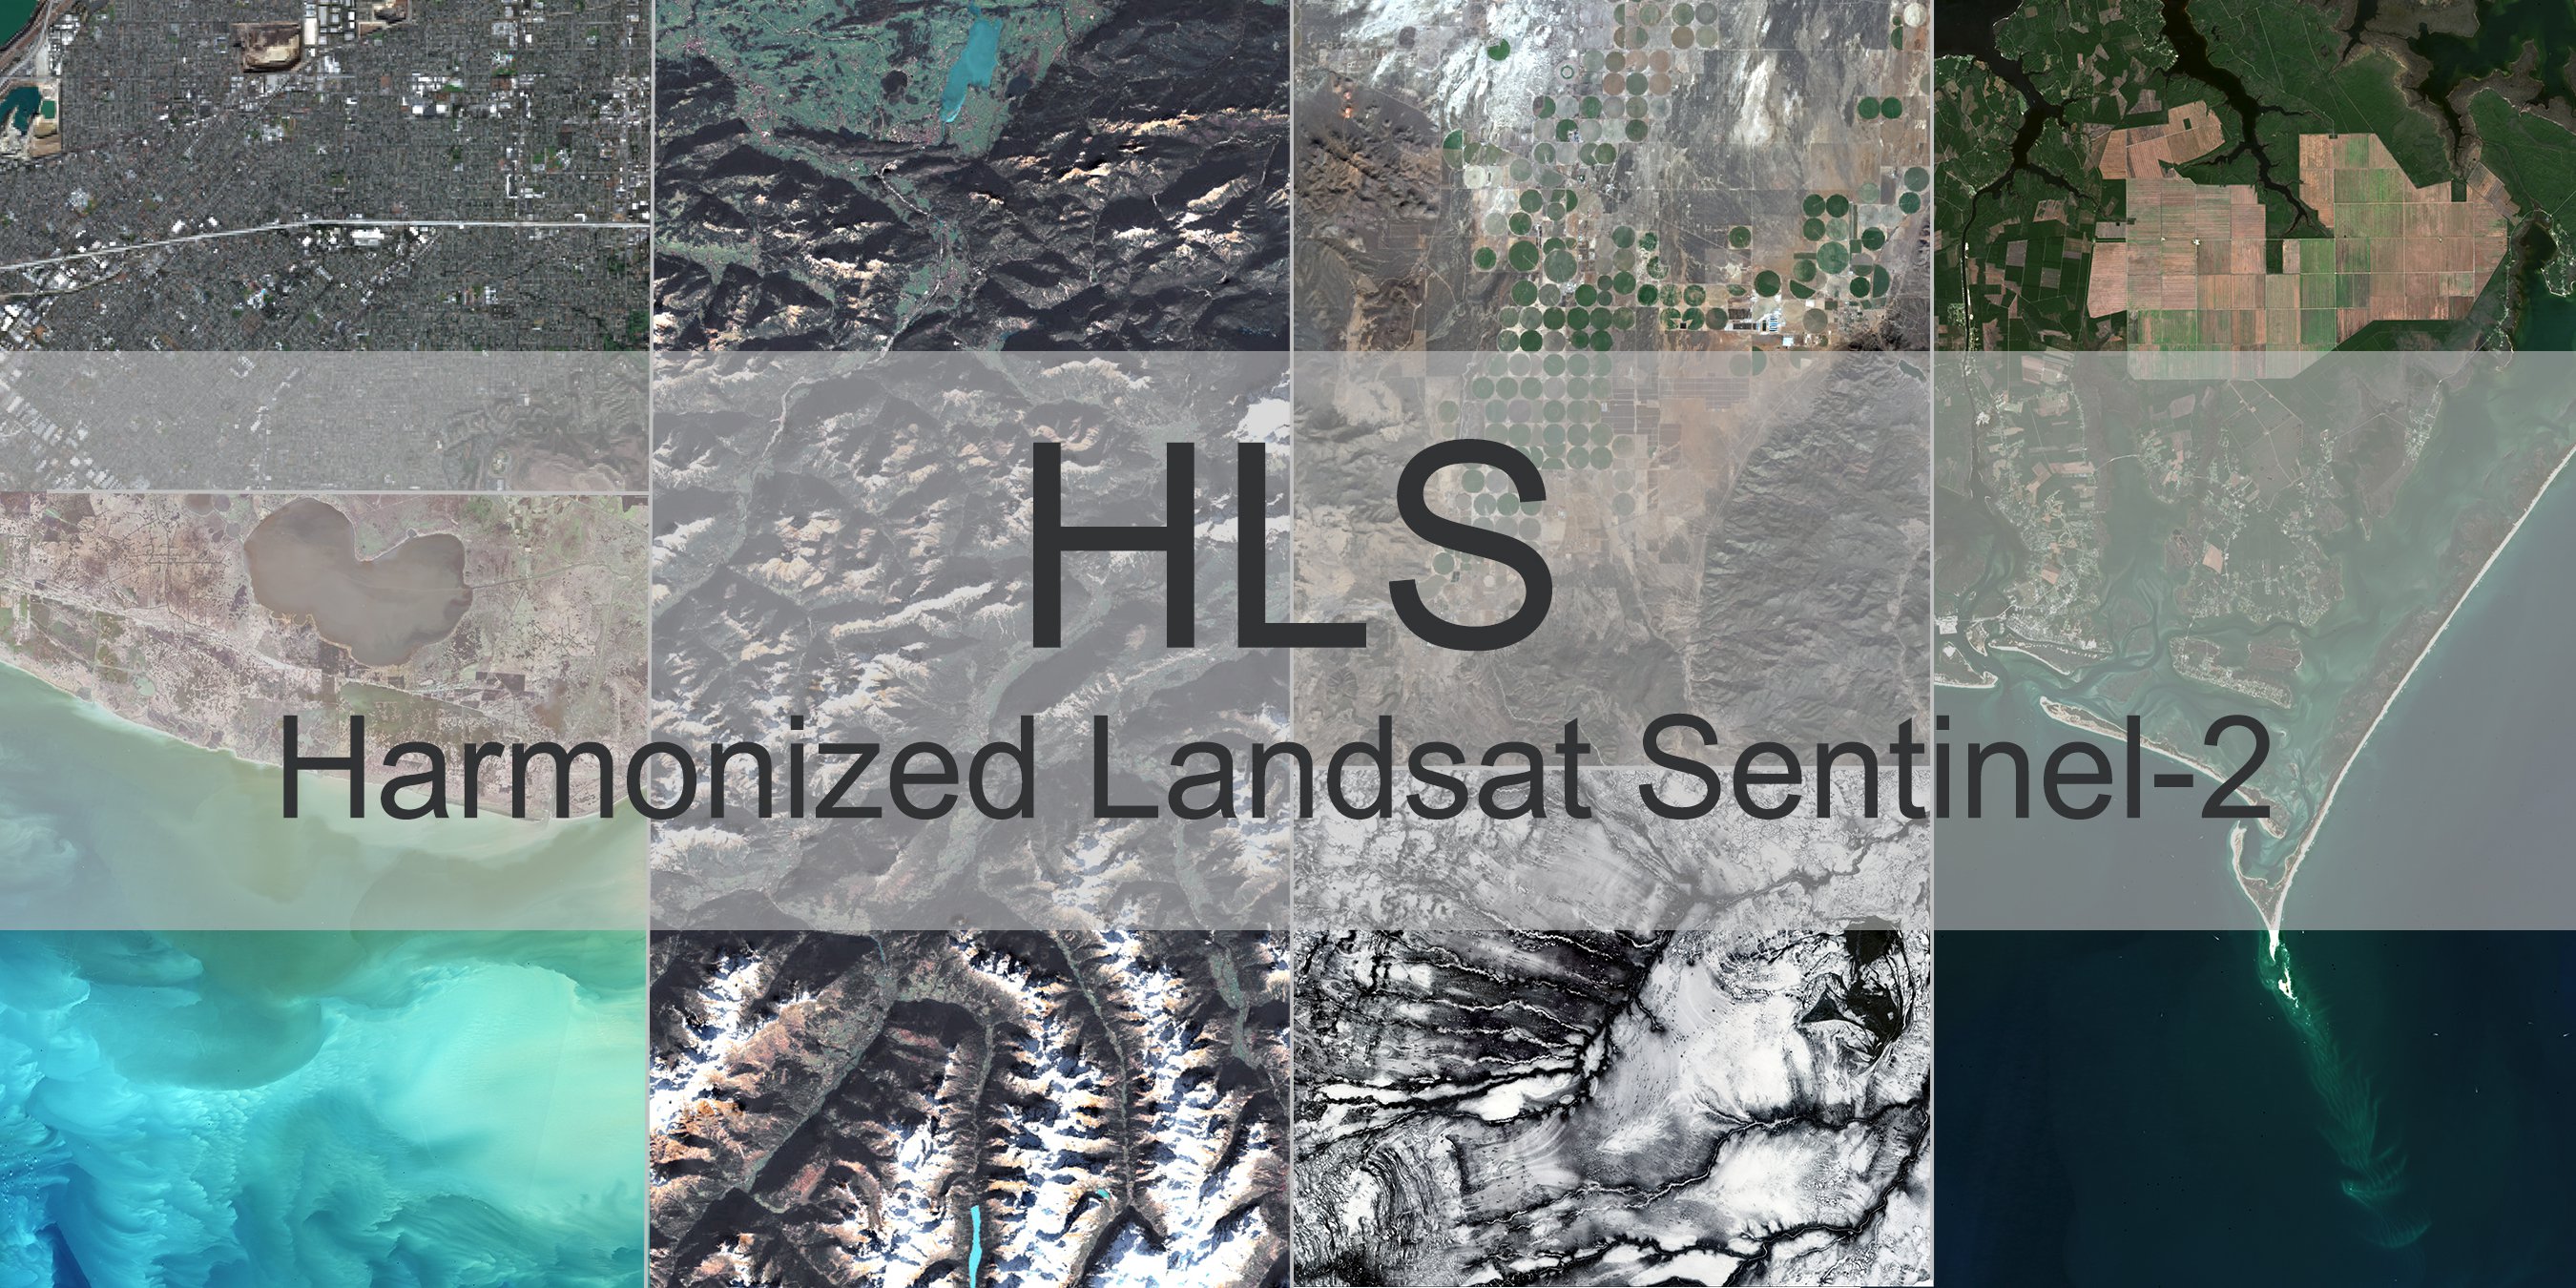
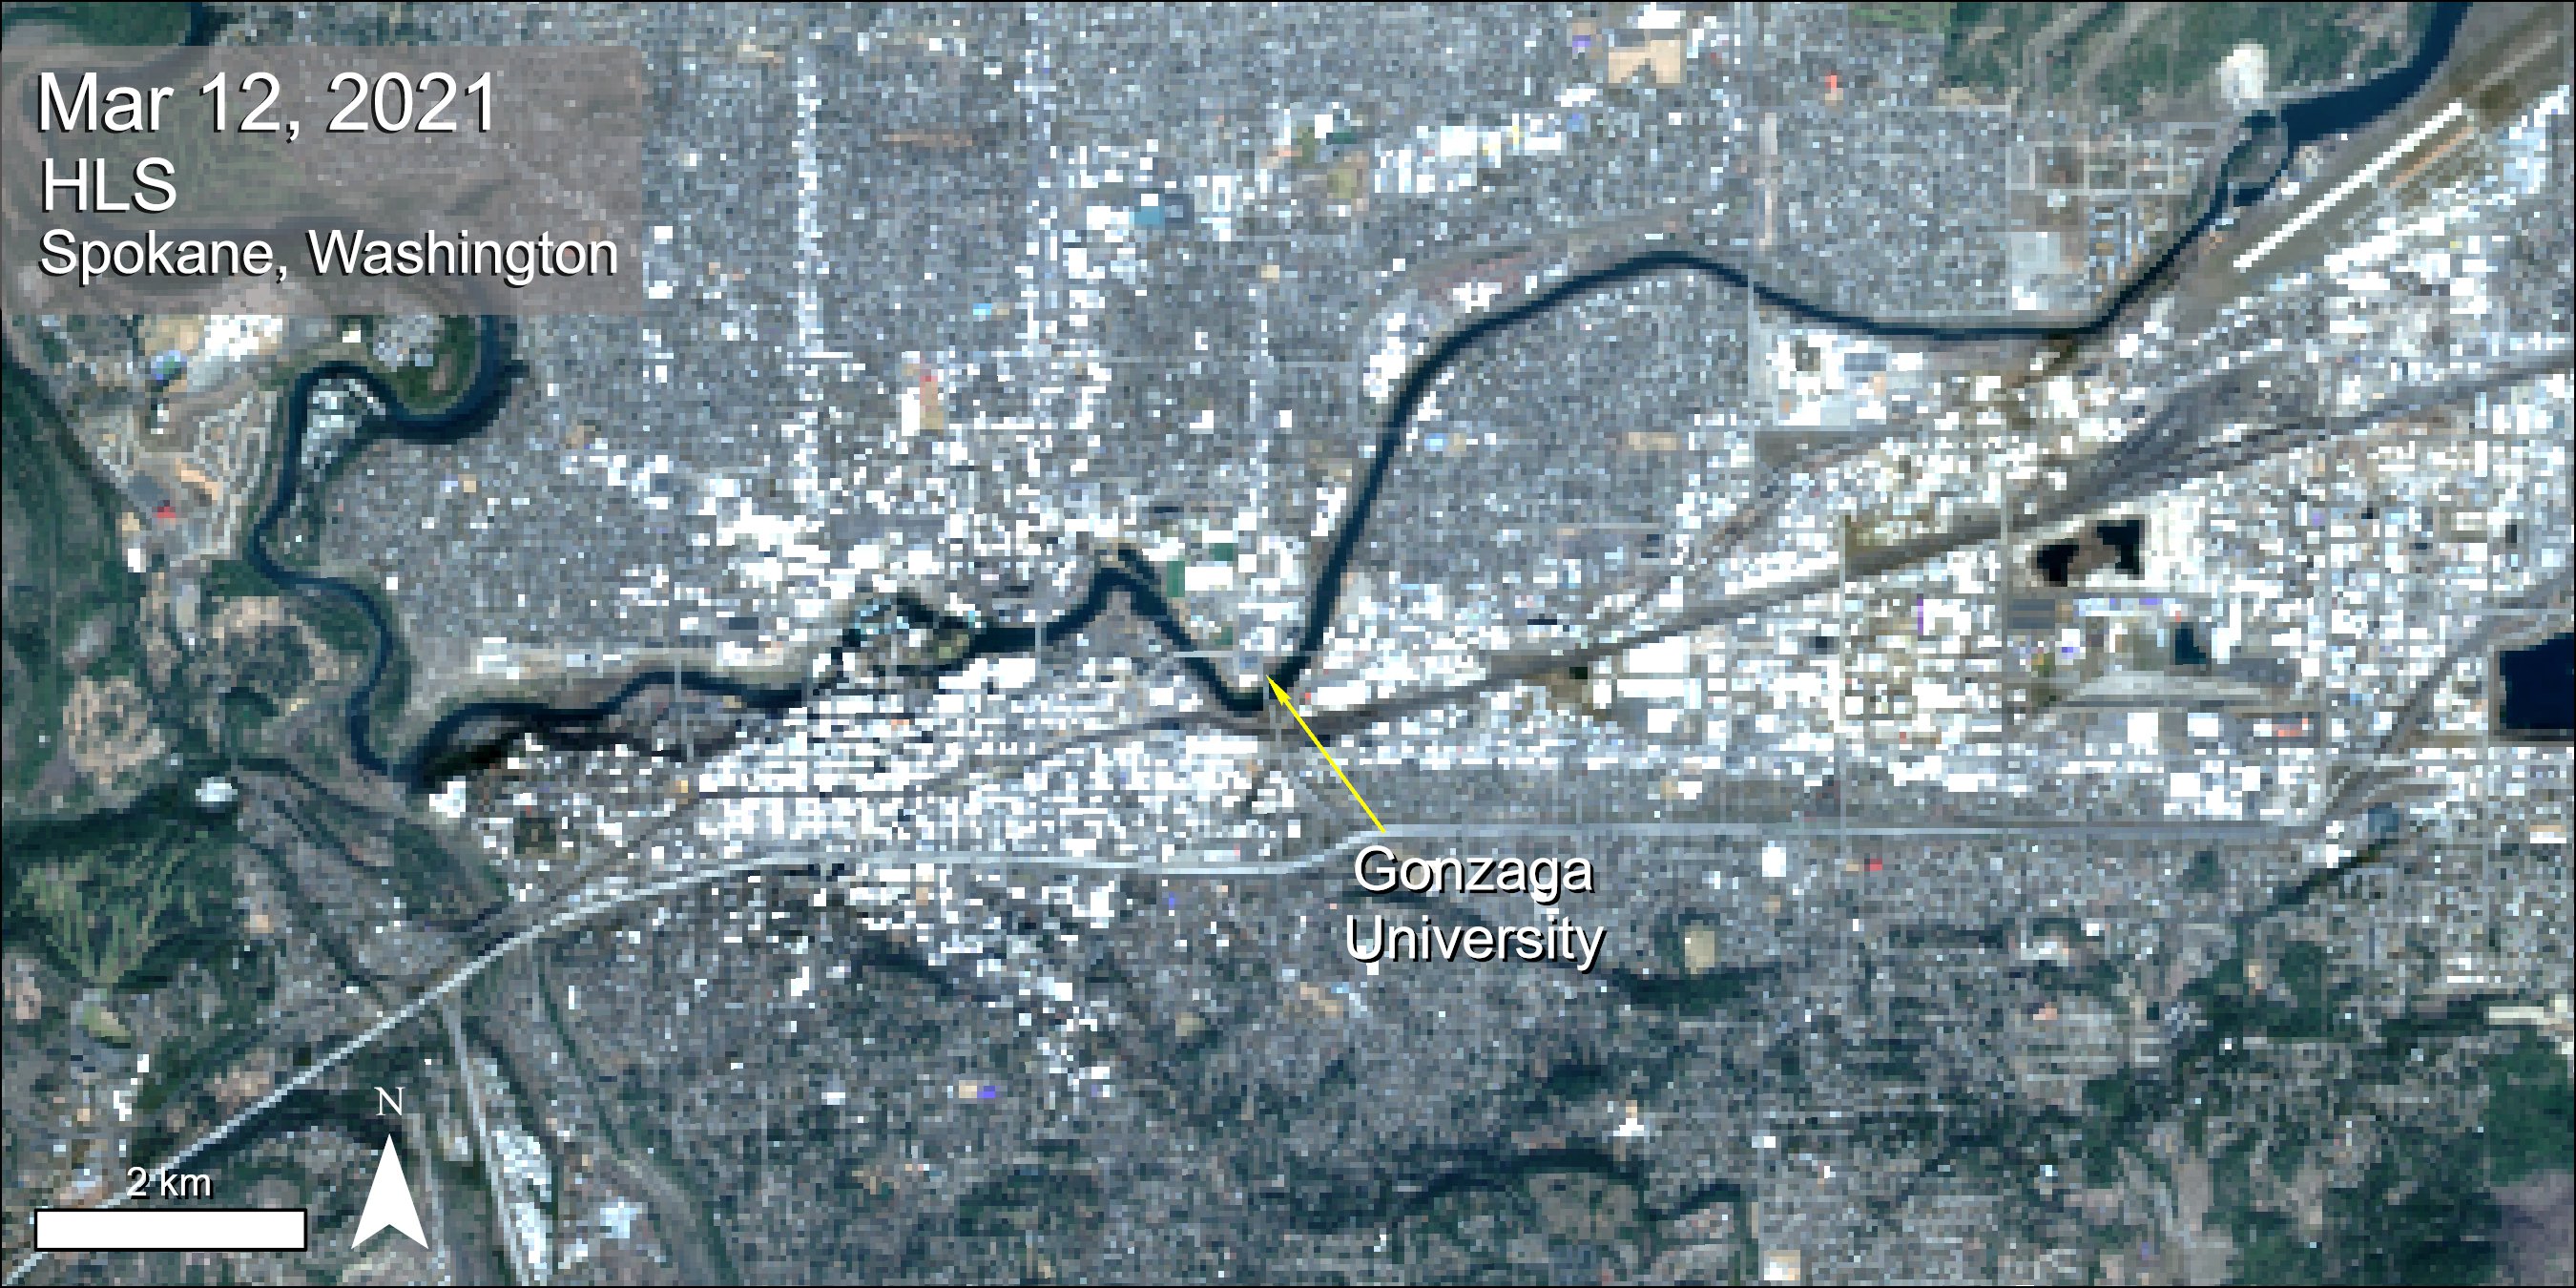
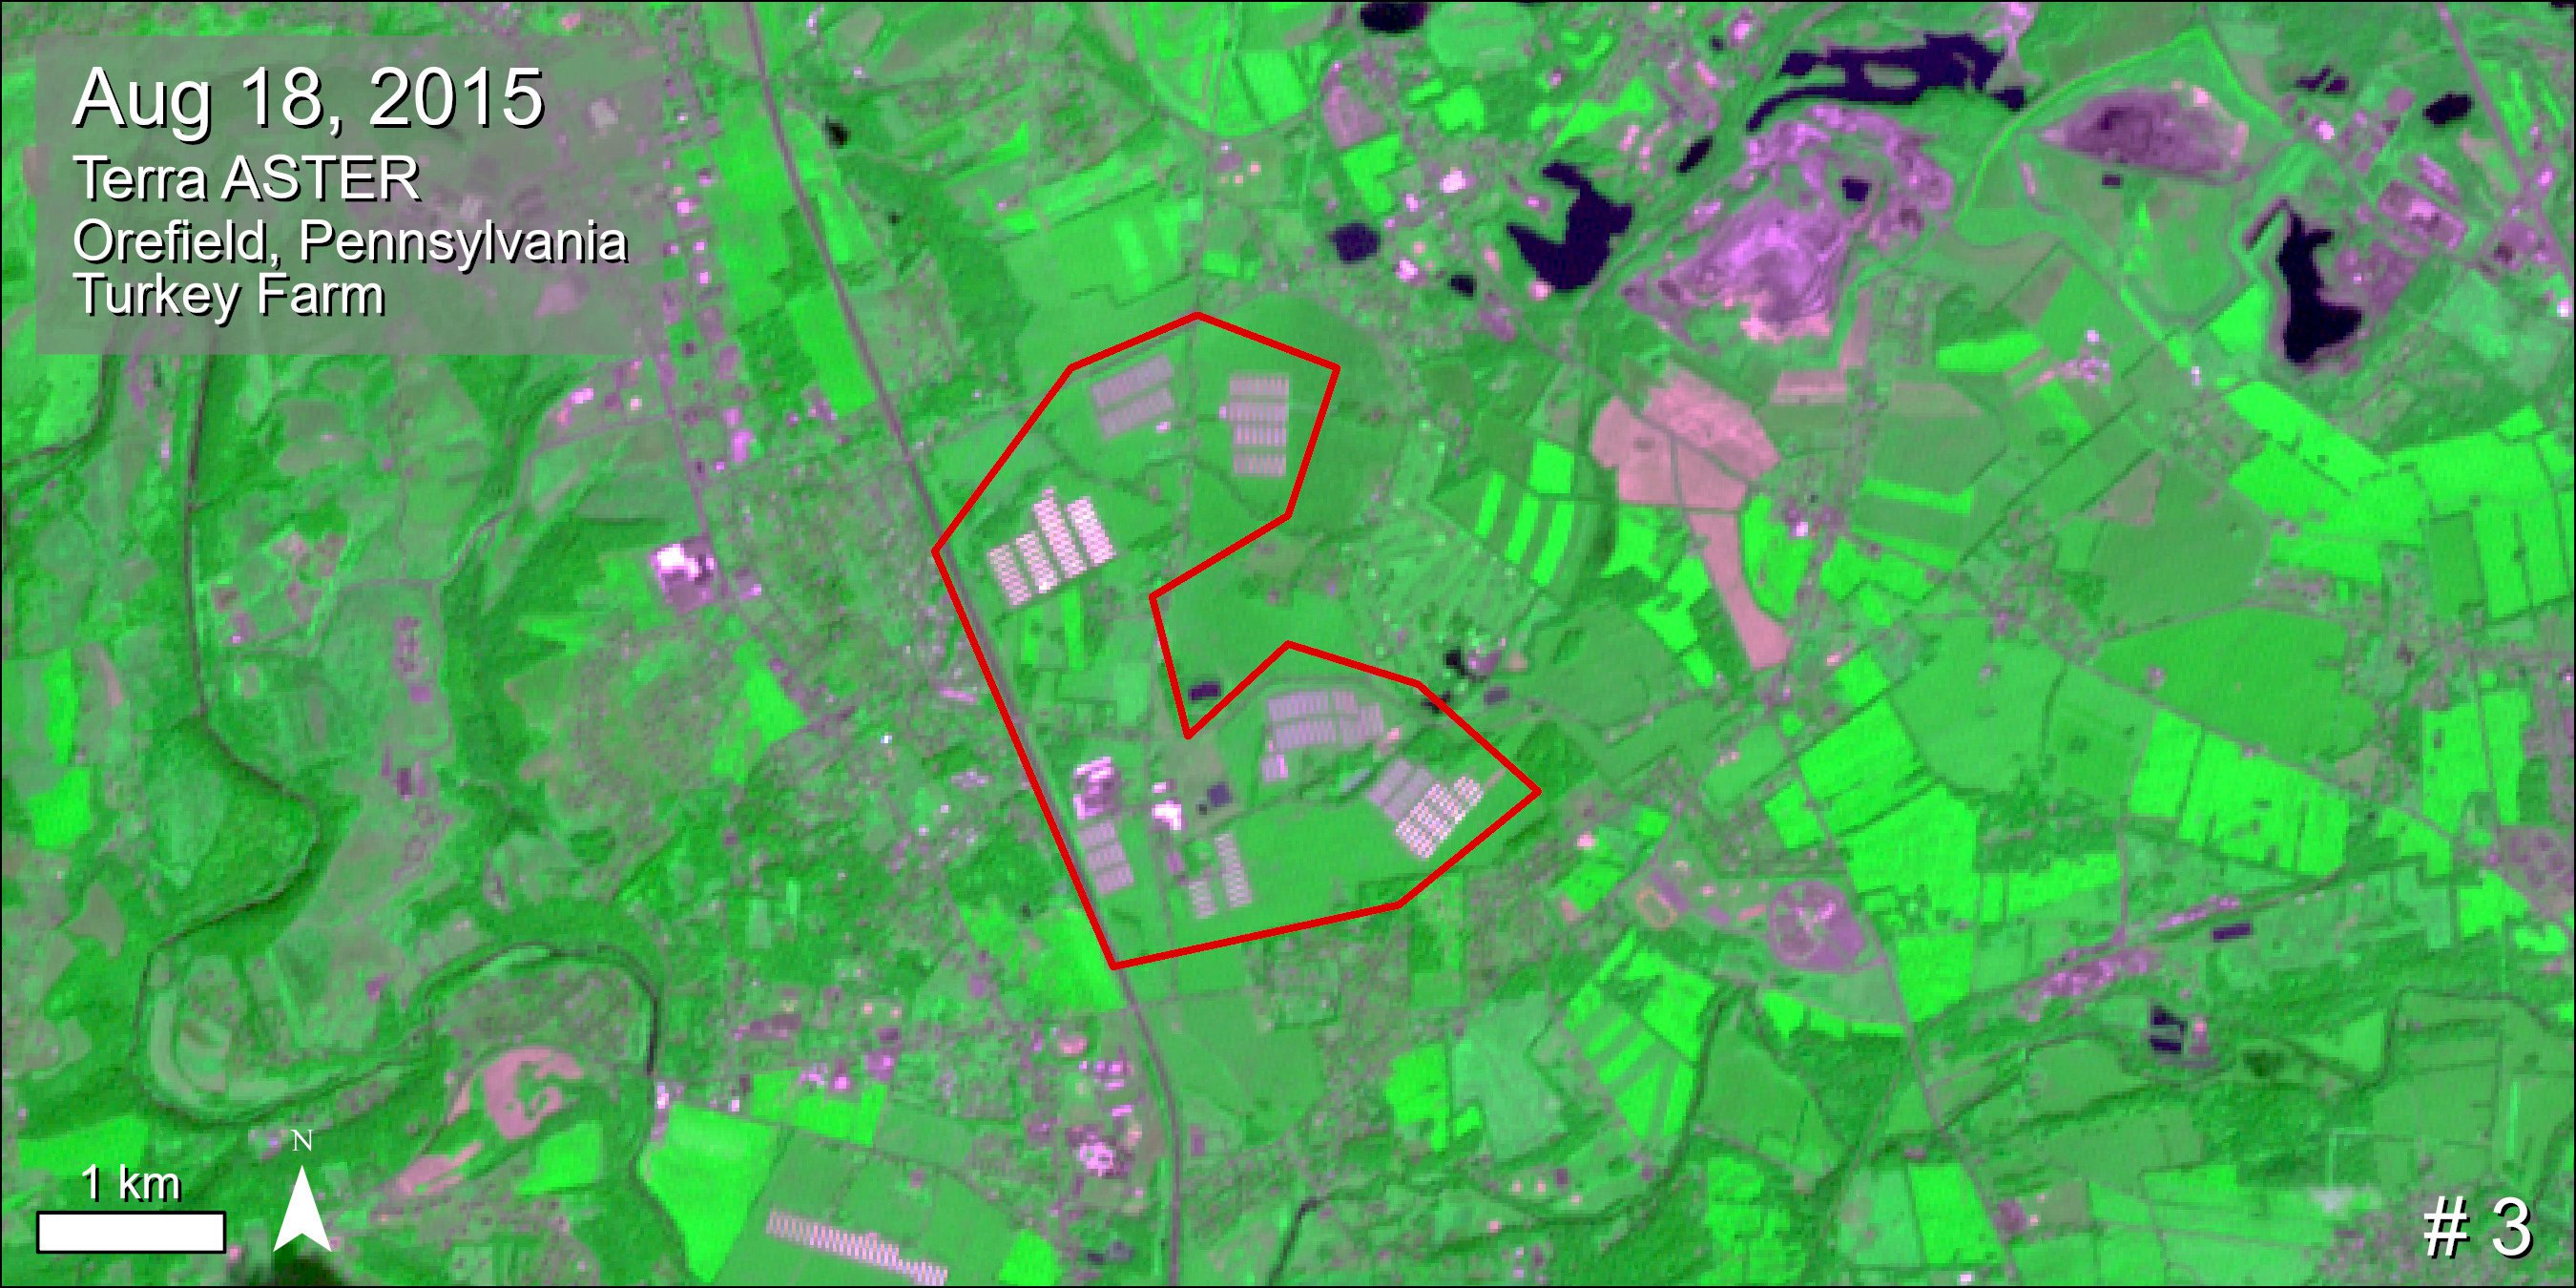
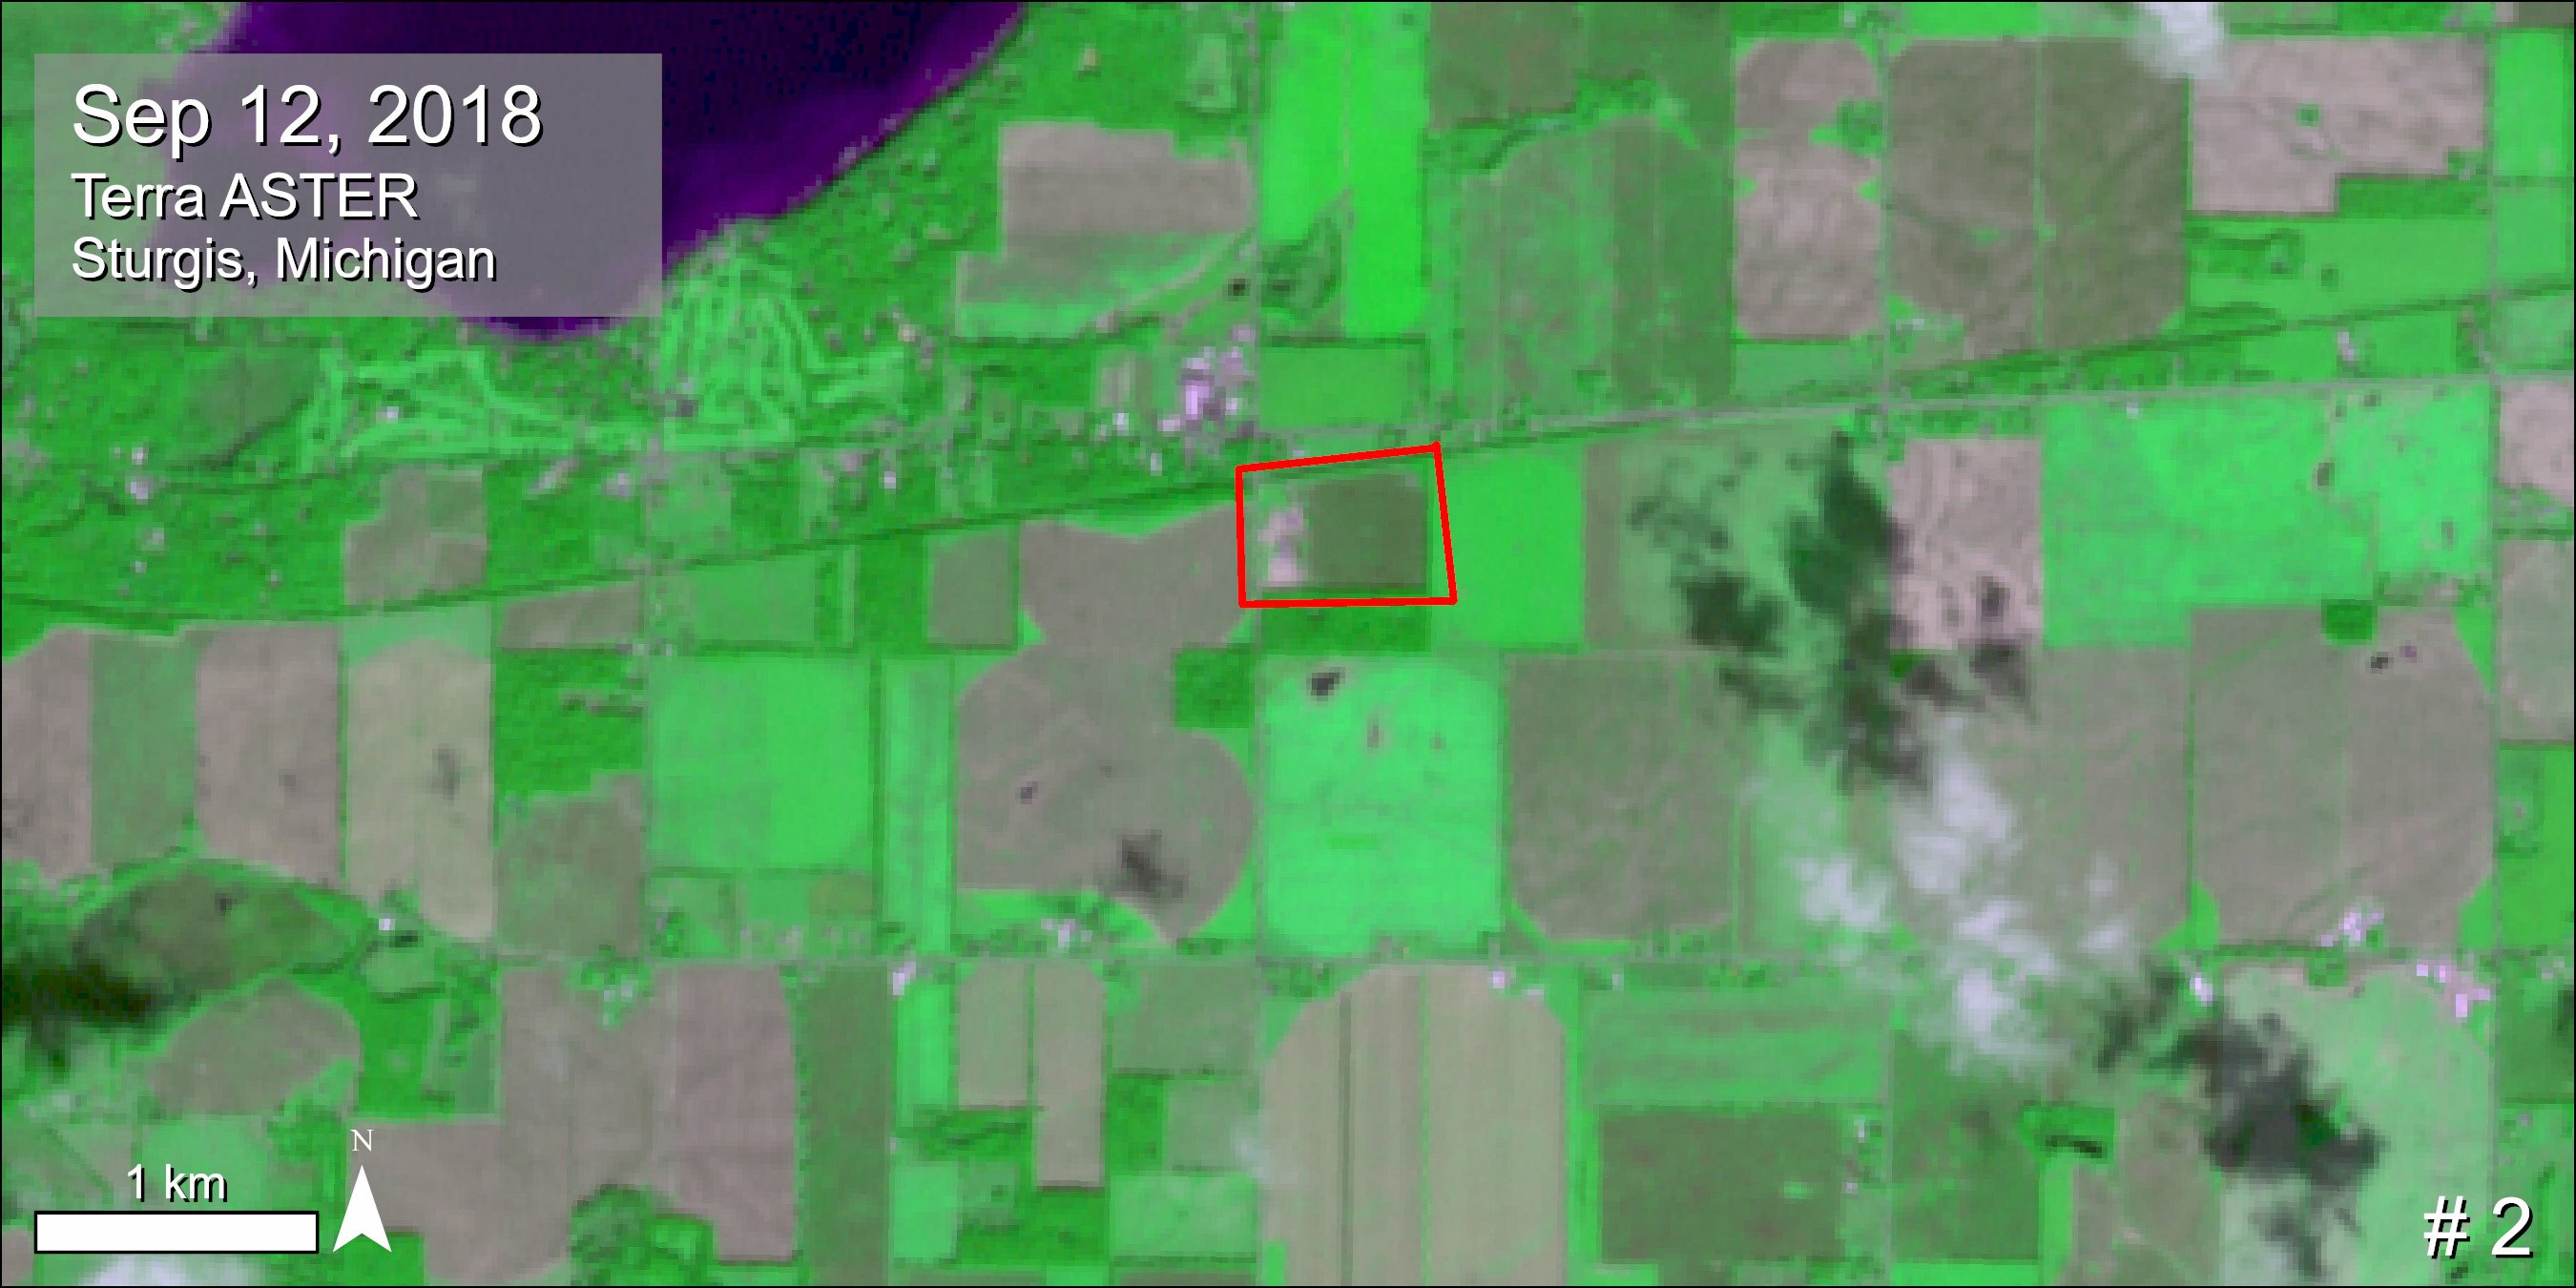
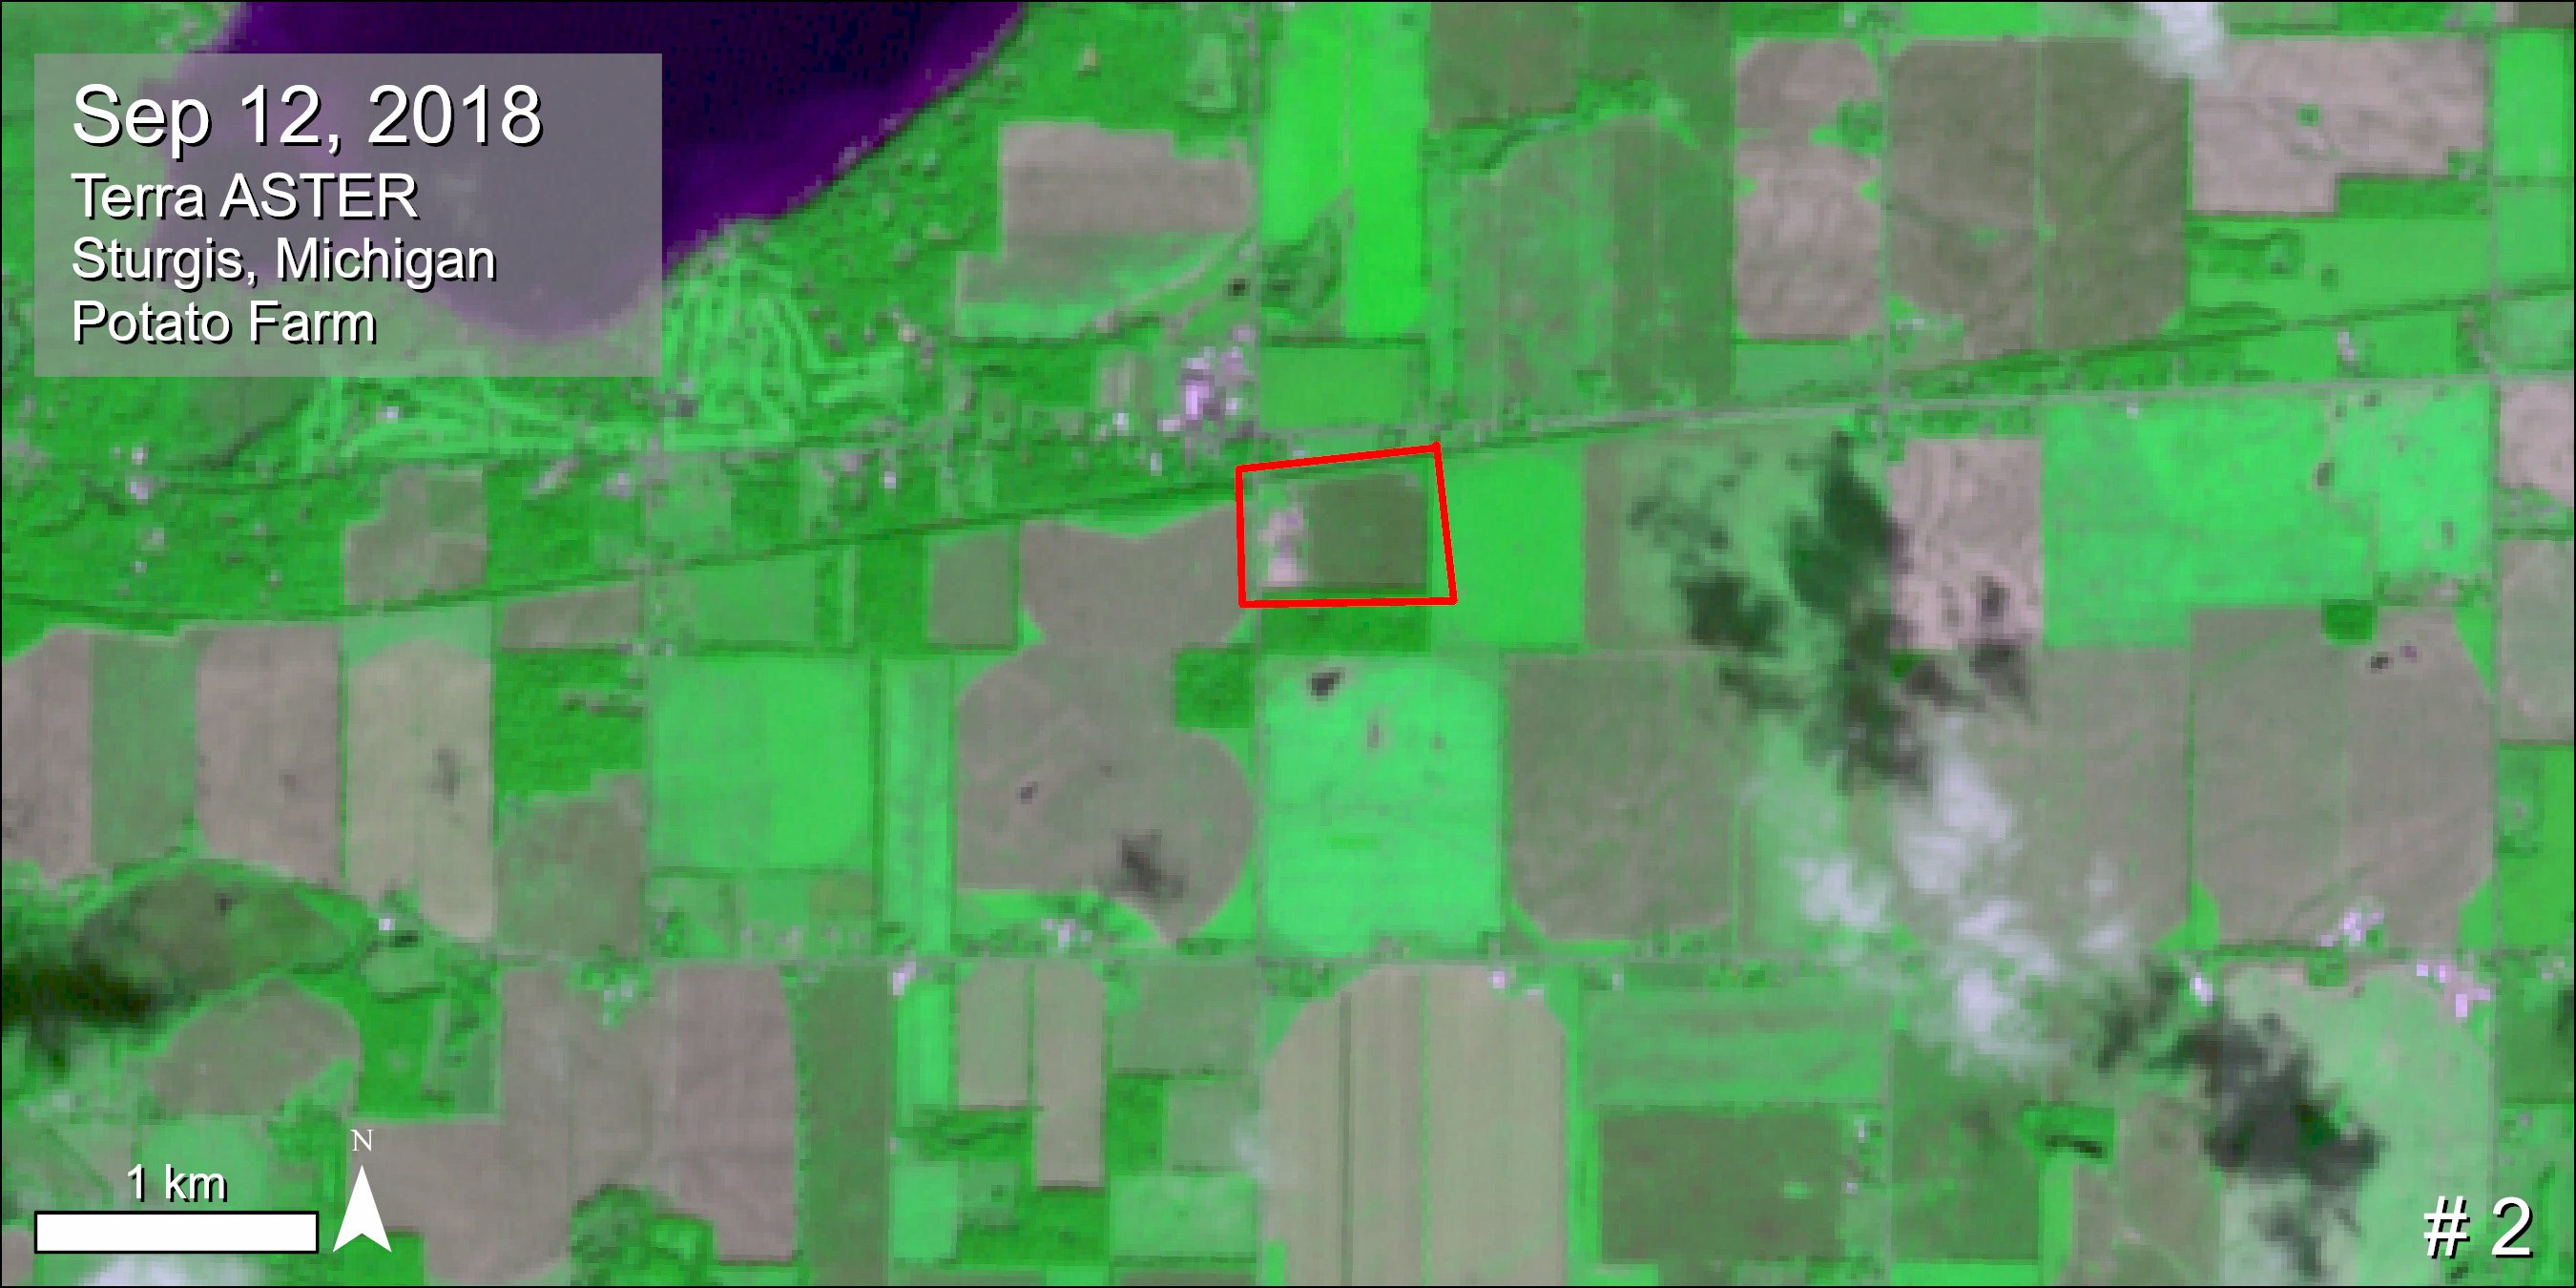
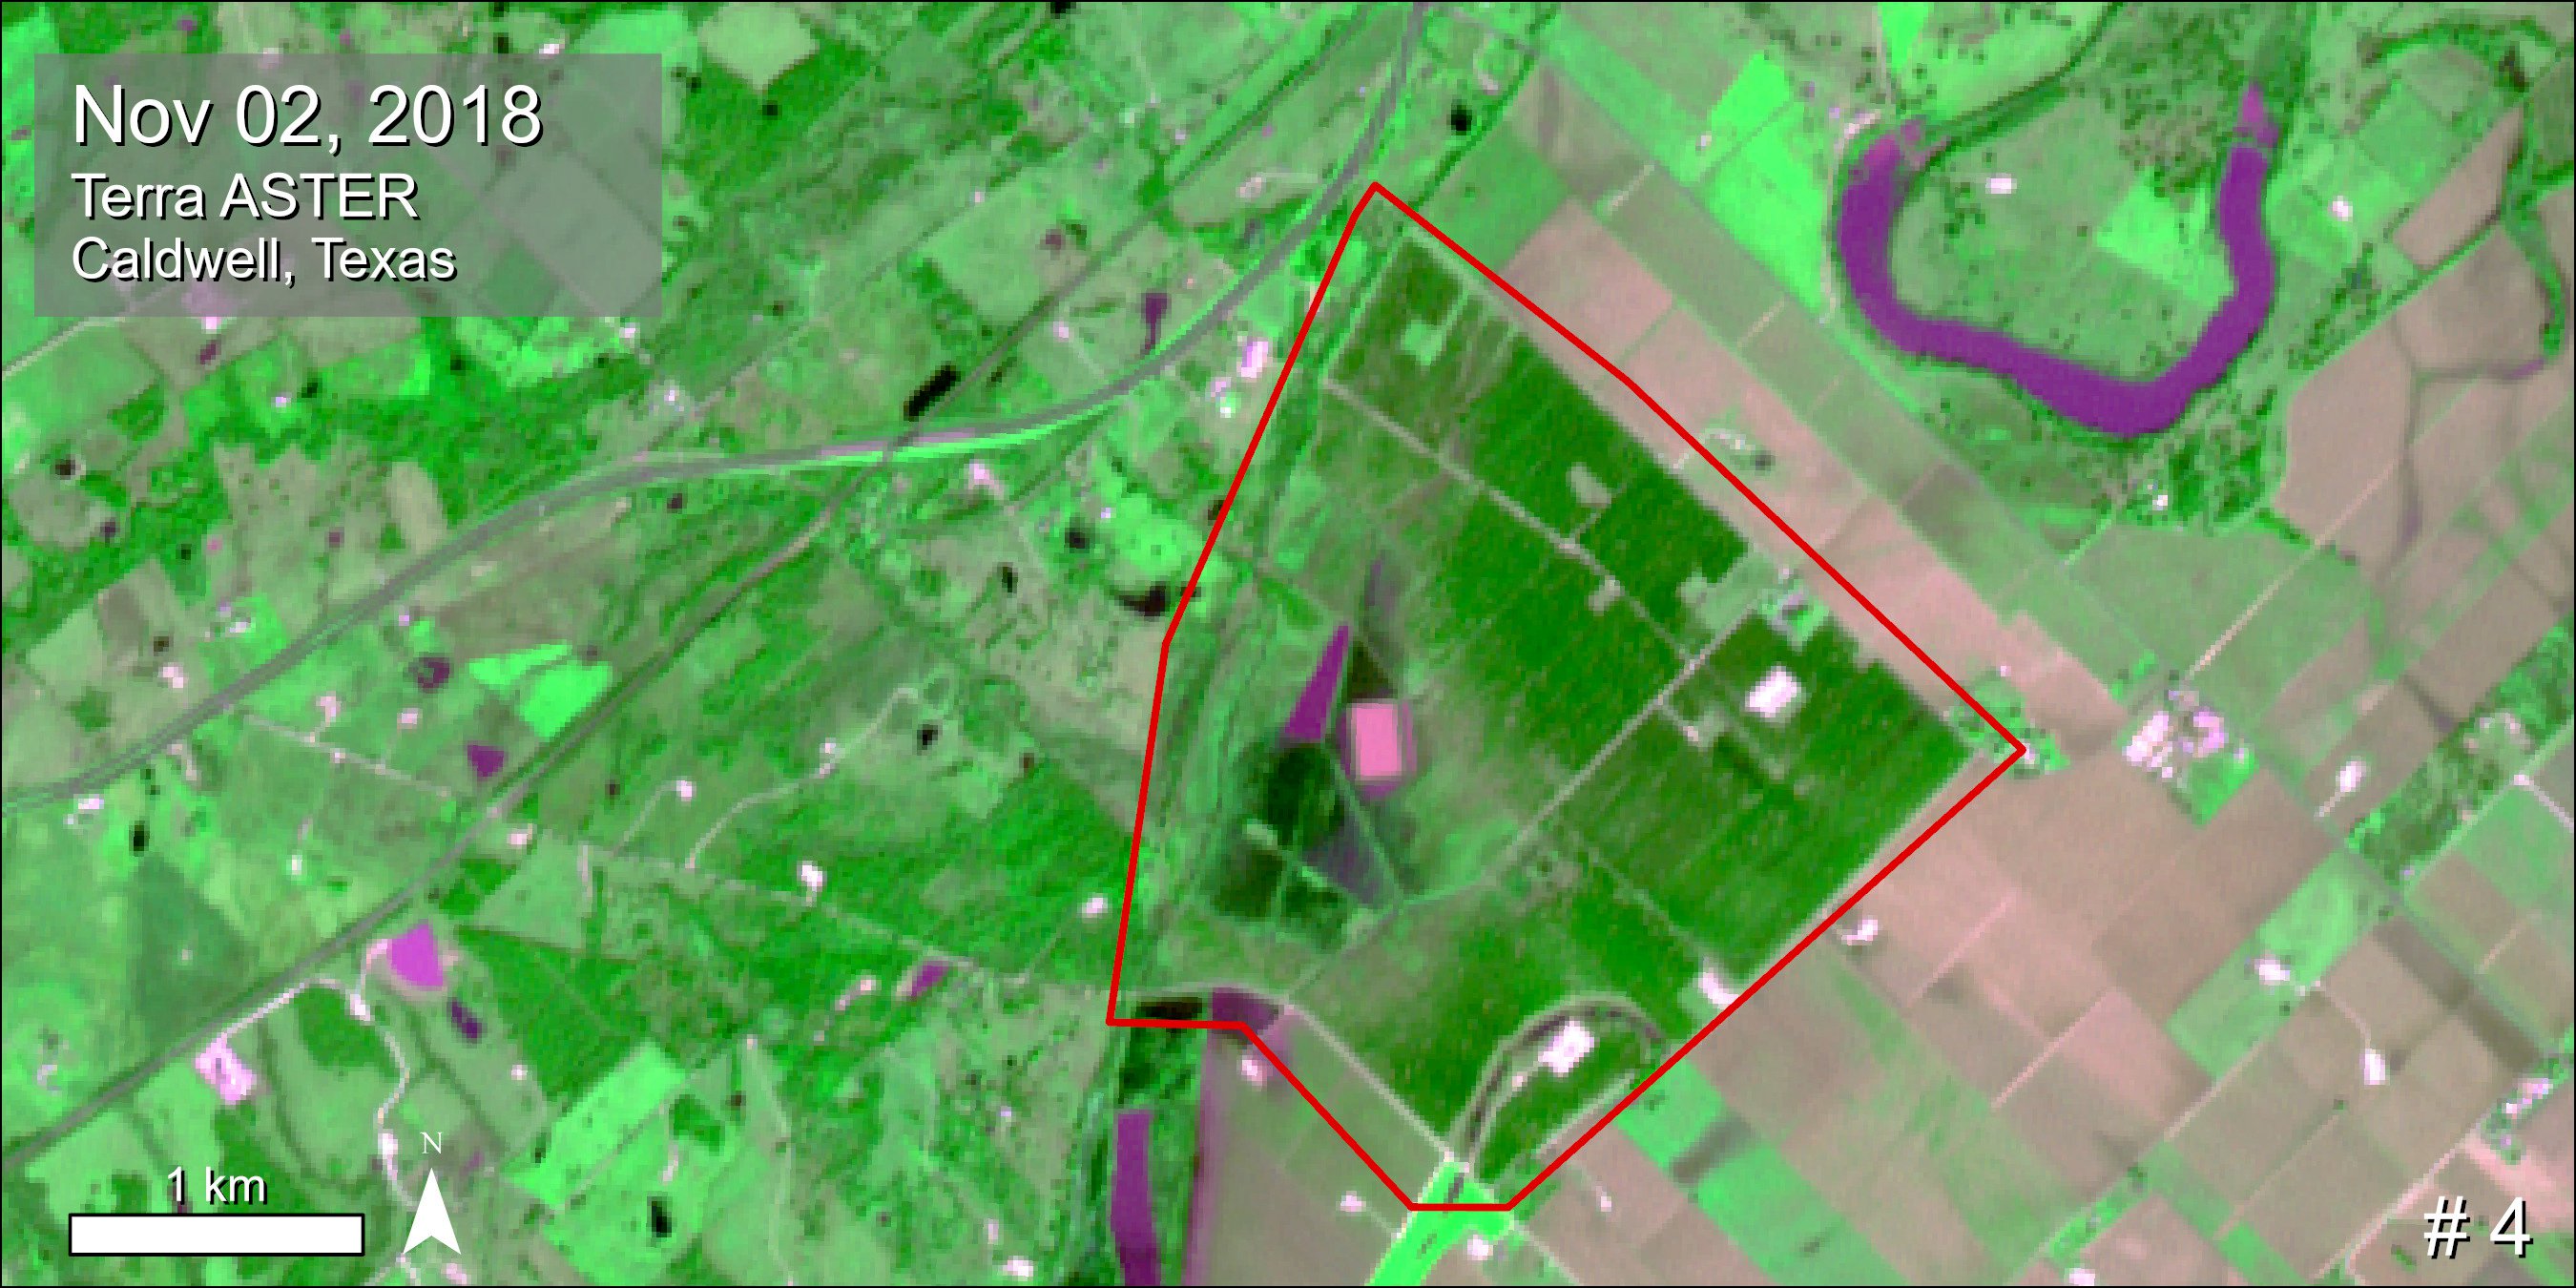
Happy Thanksgiving! Planning on having sweet potatoes at your Thanksgiving table? This video shows a sweet potato farm (center of images) during harvest season using Harmonized #Landsat #Sentinel-2 (HLS) data. Explore HLS data at NASA's #LPDAAC: https://t.co/OrvgiXpsFZ pic.twitter.com/nXtf4NxH3g
— NASAEarthdata (@NASAEarthData) November 25, 2021
Observe seasonal changes in NDVI from late July to October across CONUS with NASA-produced Suomi NPP VIIRS Normalized Difference Vegetation Index (NDVI) data. Visit NASA’s #LPDAAC to learn more about these data. https://t.co/9PJE6j53Mz pic.twitter.com/SxkGj9yE3c
— NASAEarthdata (@NASAEarthData) November 24, 2021
Are you interested in working with Harmonized #Landsat and #Sentinel-2 (#HLS) data using R? Check out NASA #LPDAAC's newly released tutorial to learn how to use @STACspec to query and interact with @cogeotiff HLS data hosted on the cloud using #Rgdal. https://t.co/J2HGLbMRMH pic.twitter.com/LD5lMTVO2D
— NASAEarthdata (@NASAEarthData) September 22, 2021
The NASA/NOAA Suomi NPP VIIRS instrument captures the lifespan of #HurricaneHenri from August 15- 23, 2021. Learn more about the VIIRS data used to create this animated GIF by visiting NASA’s Land Processes DAAC (#LPDAAC) at: https://t.co/8jcMCAo2zh pic.twitter.com/fswCo2DS4r
— NASAEarthdata (@NASAEarthData) August 28, 2021
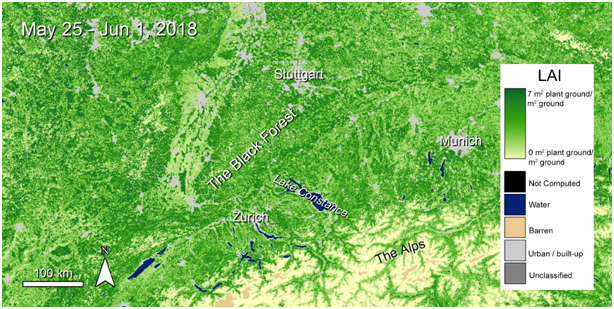
Another benefit of the recently released Harmonized #Landsat and #Sentinel-2 Version 2 data? Observing seasonality changes and monitoring growing seasons for agriculture. Learn more at NASA's #LPDAAC: https://t.co/NzguCiRFUF @NASAEarth @USGSLandsat @NASA_Landsat pic.twitter.com/QC1XExTBVb
— NASAEarthdata (@NASAEarthData) August 27, 2021
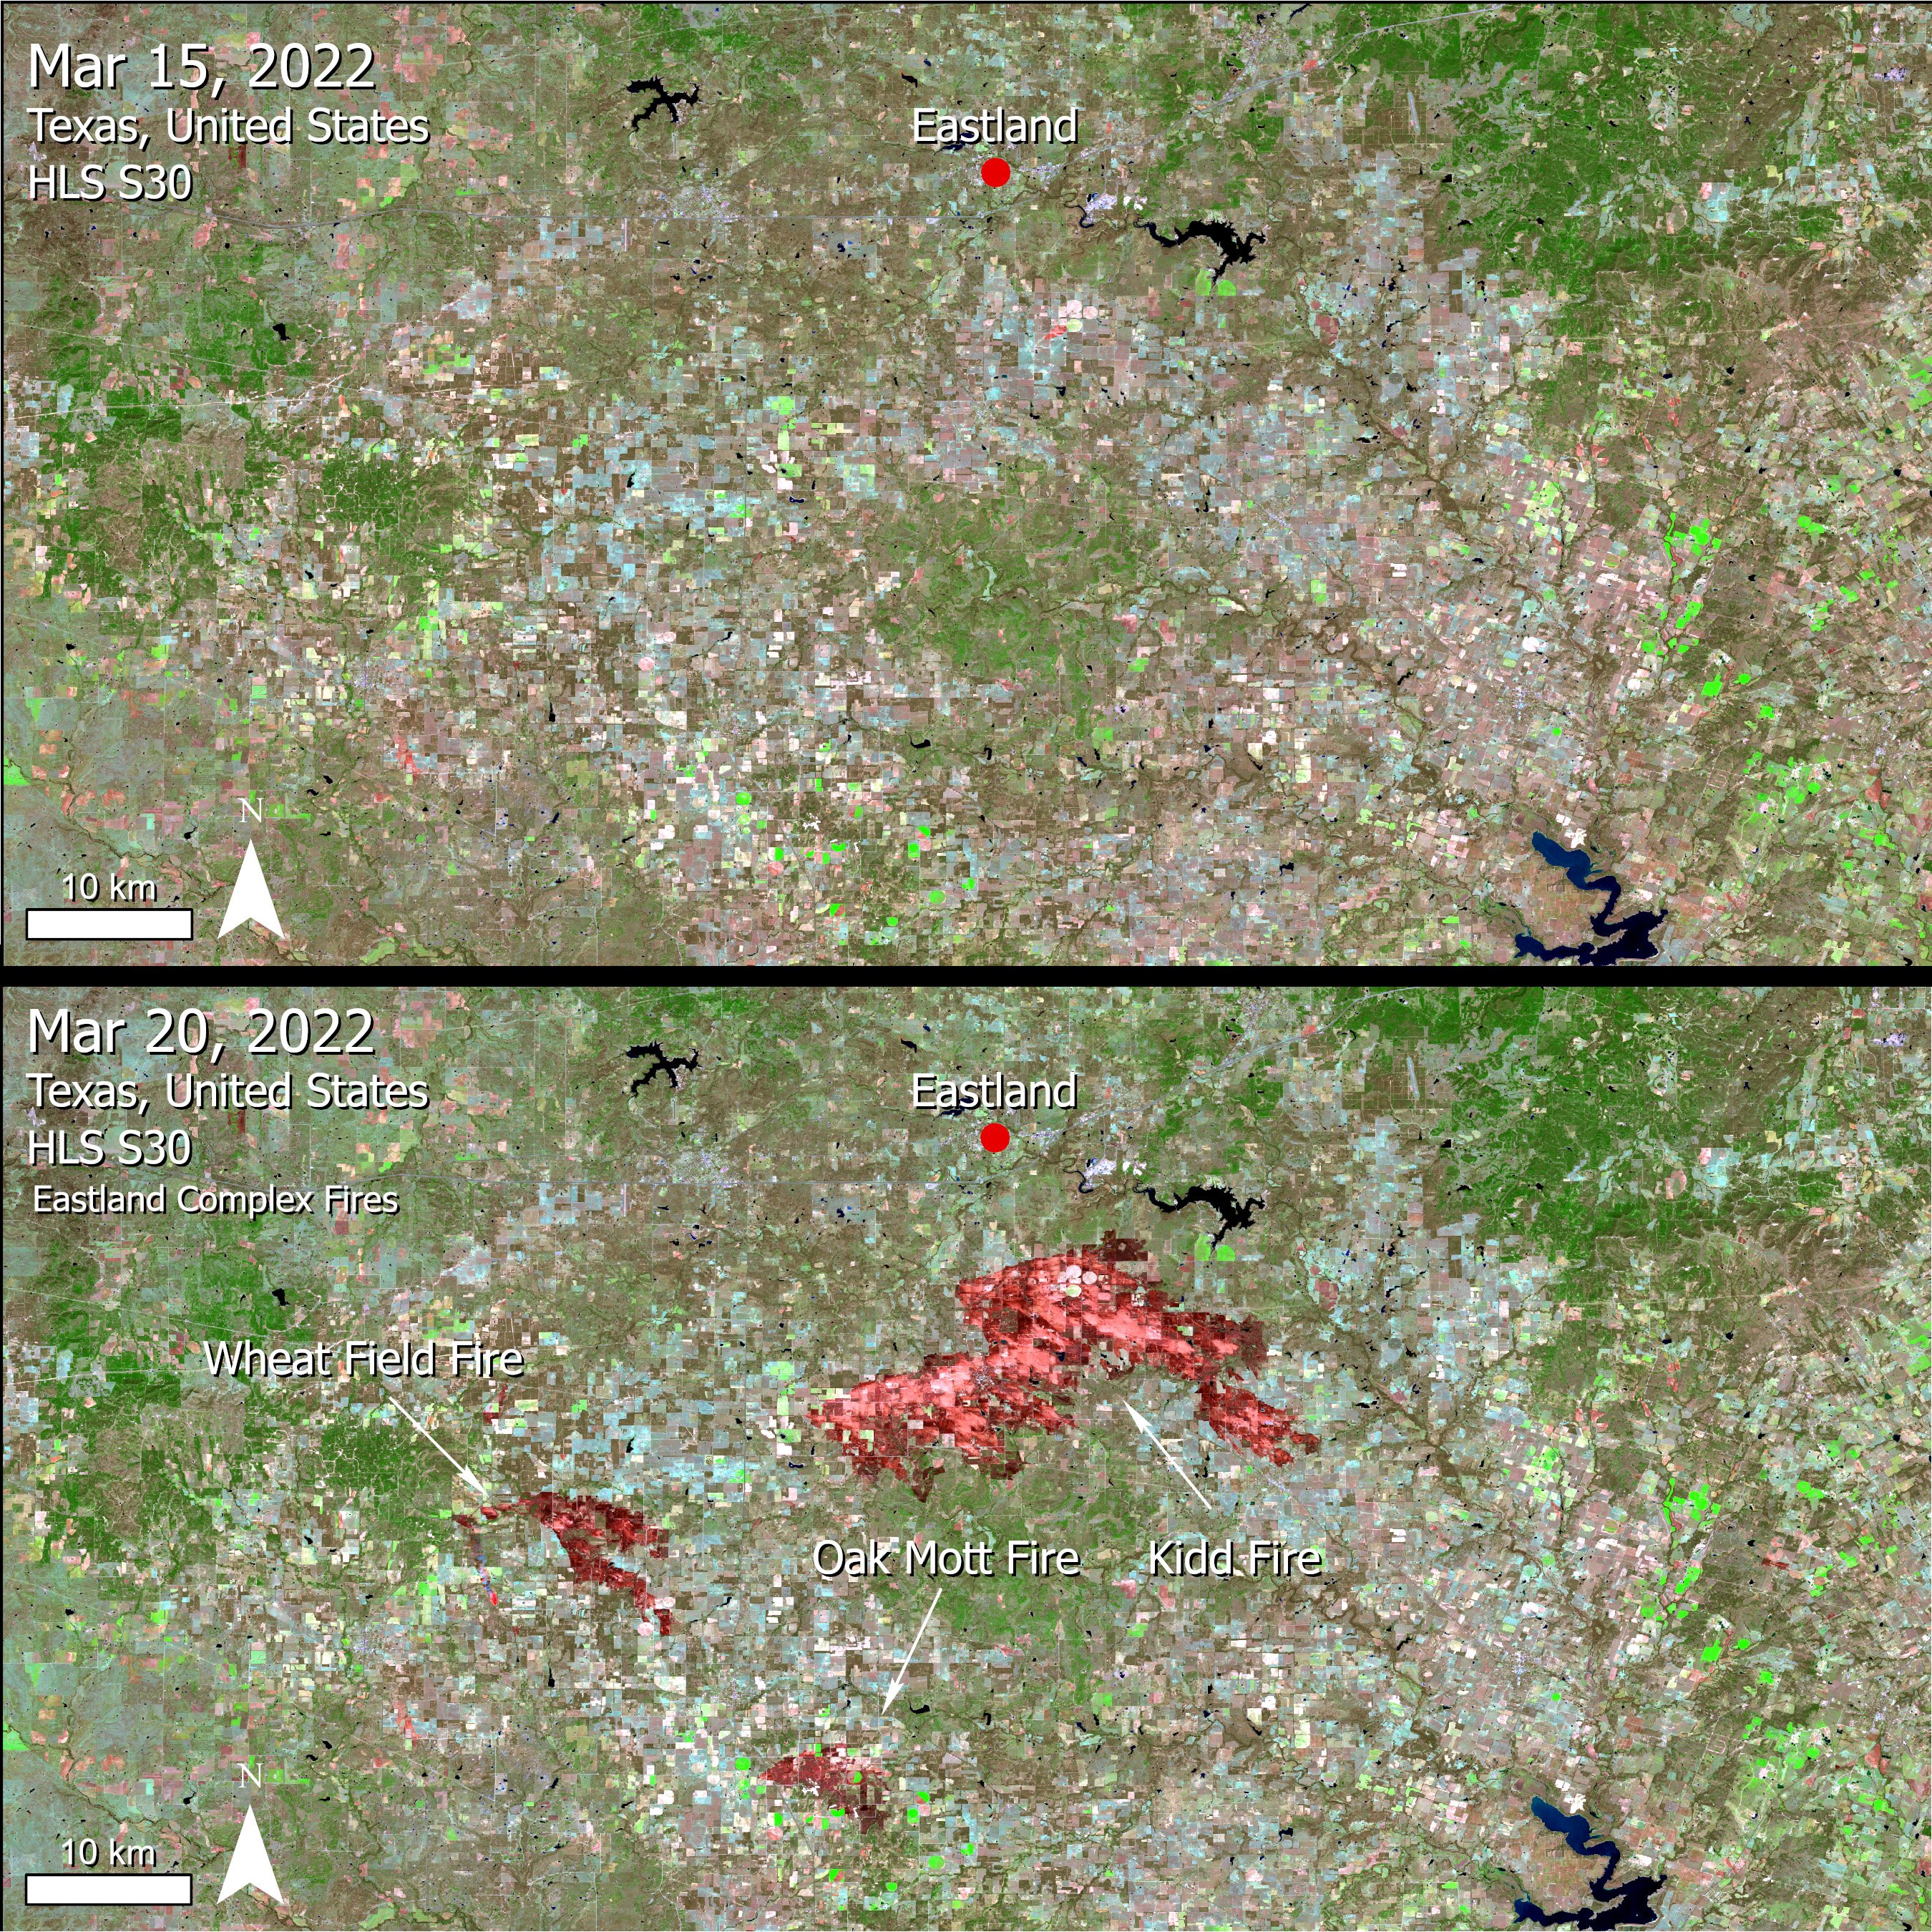
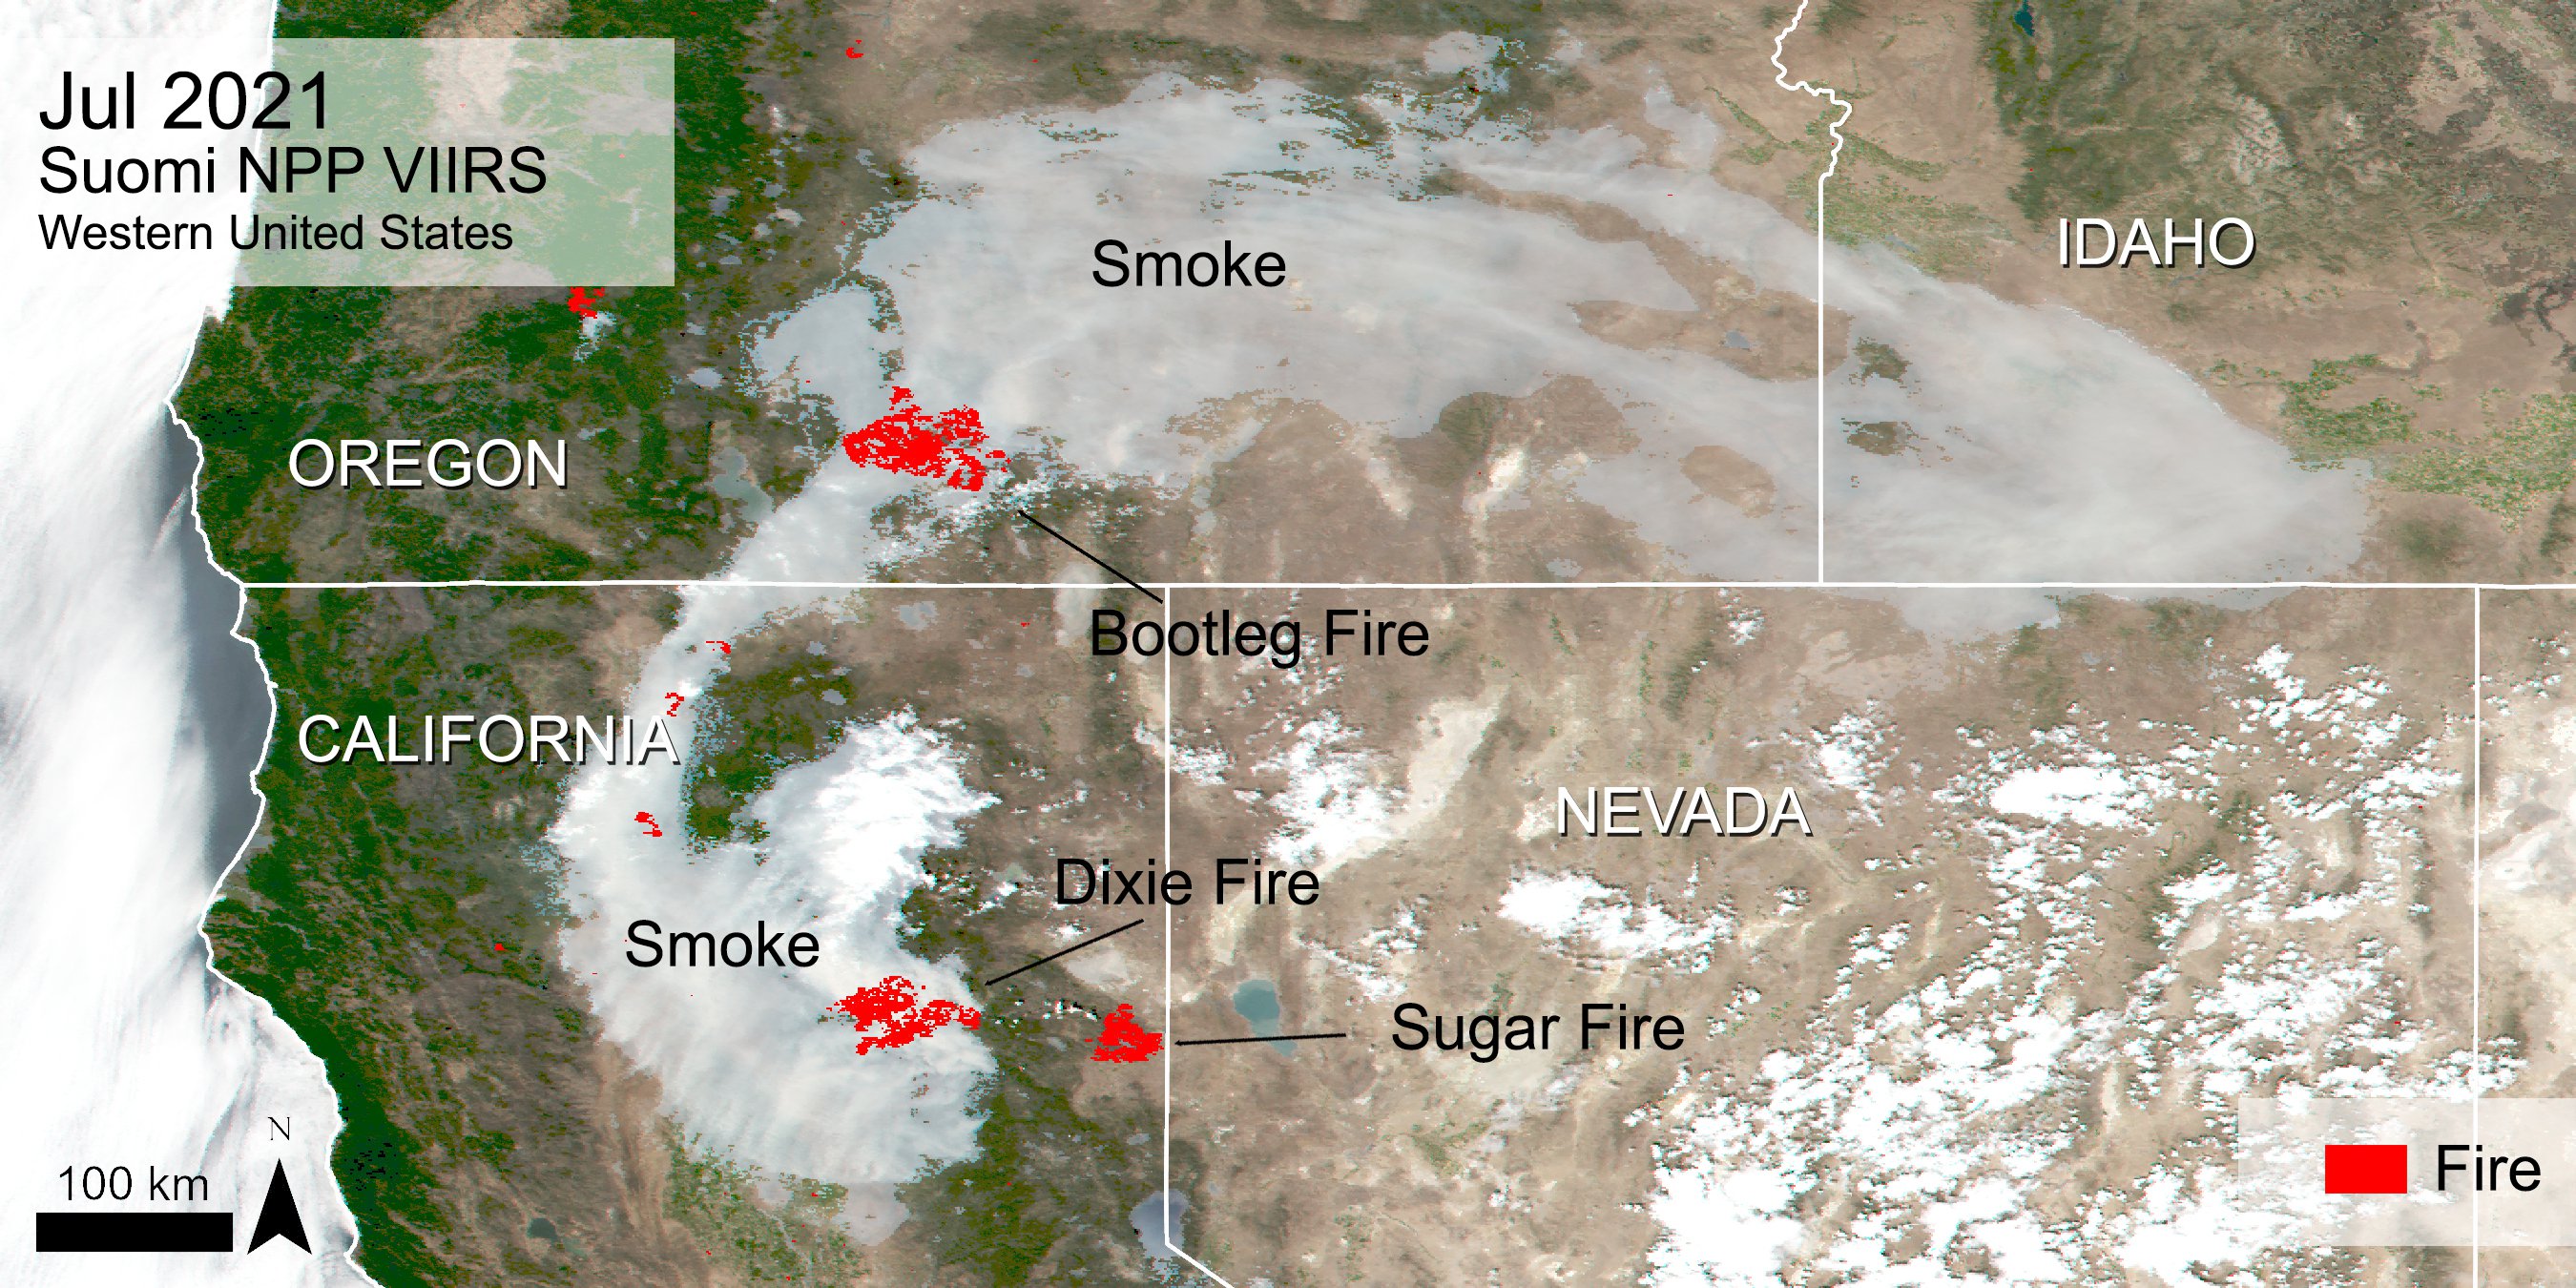
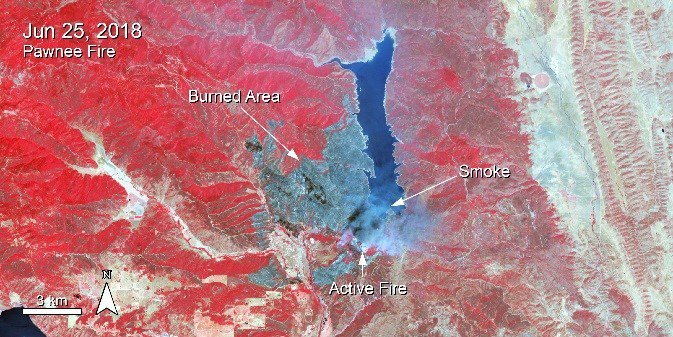
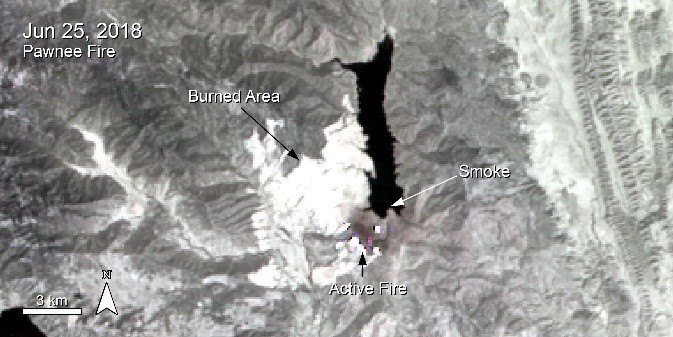
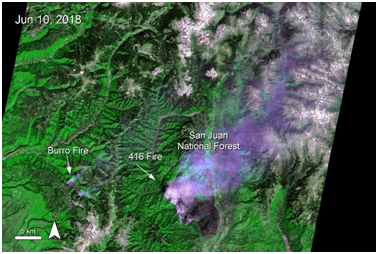
ICYMI: A new version of the Harmonized #Landsat and #Sentinel-2 dataset is available! One of the many benefits of the data includes observing natural disasters like #wildfires. Learn more at NASA #LPDAAC: https://t.co/NzguCiRFUF @NASA_Landsat @esaoperations @USGSLandsat pic.twitter.com/sV56DAqzcI
— NASAEarthdata (@NASAEarthData) August 26, 2021
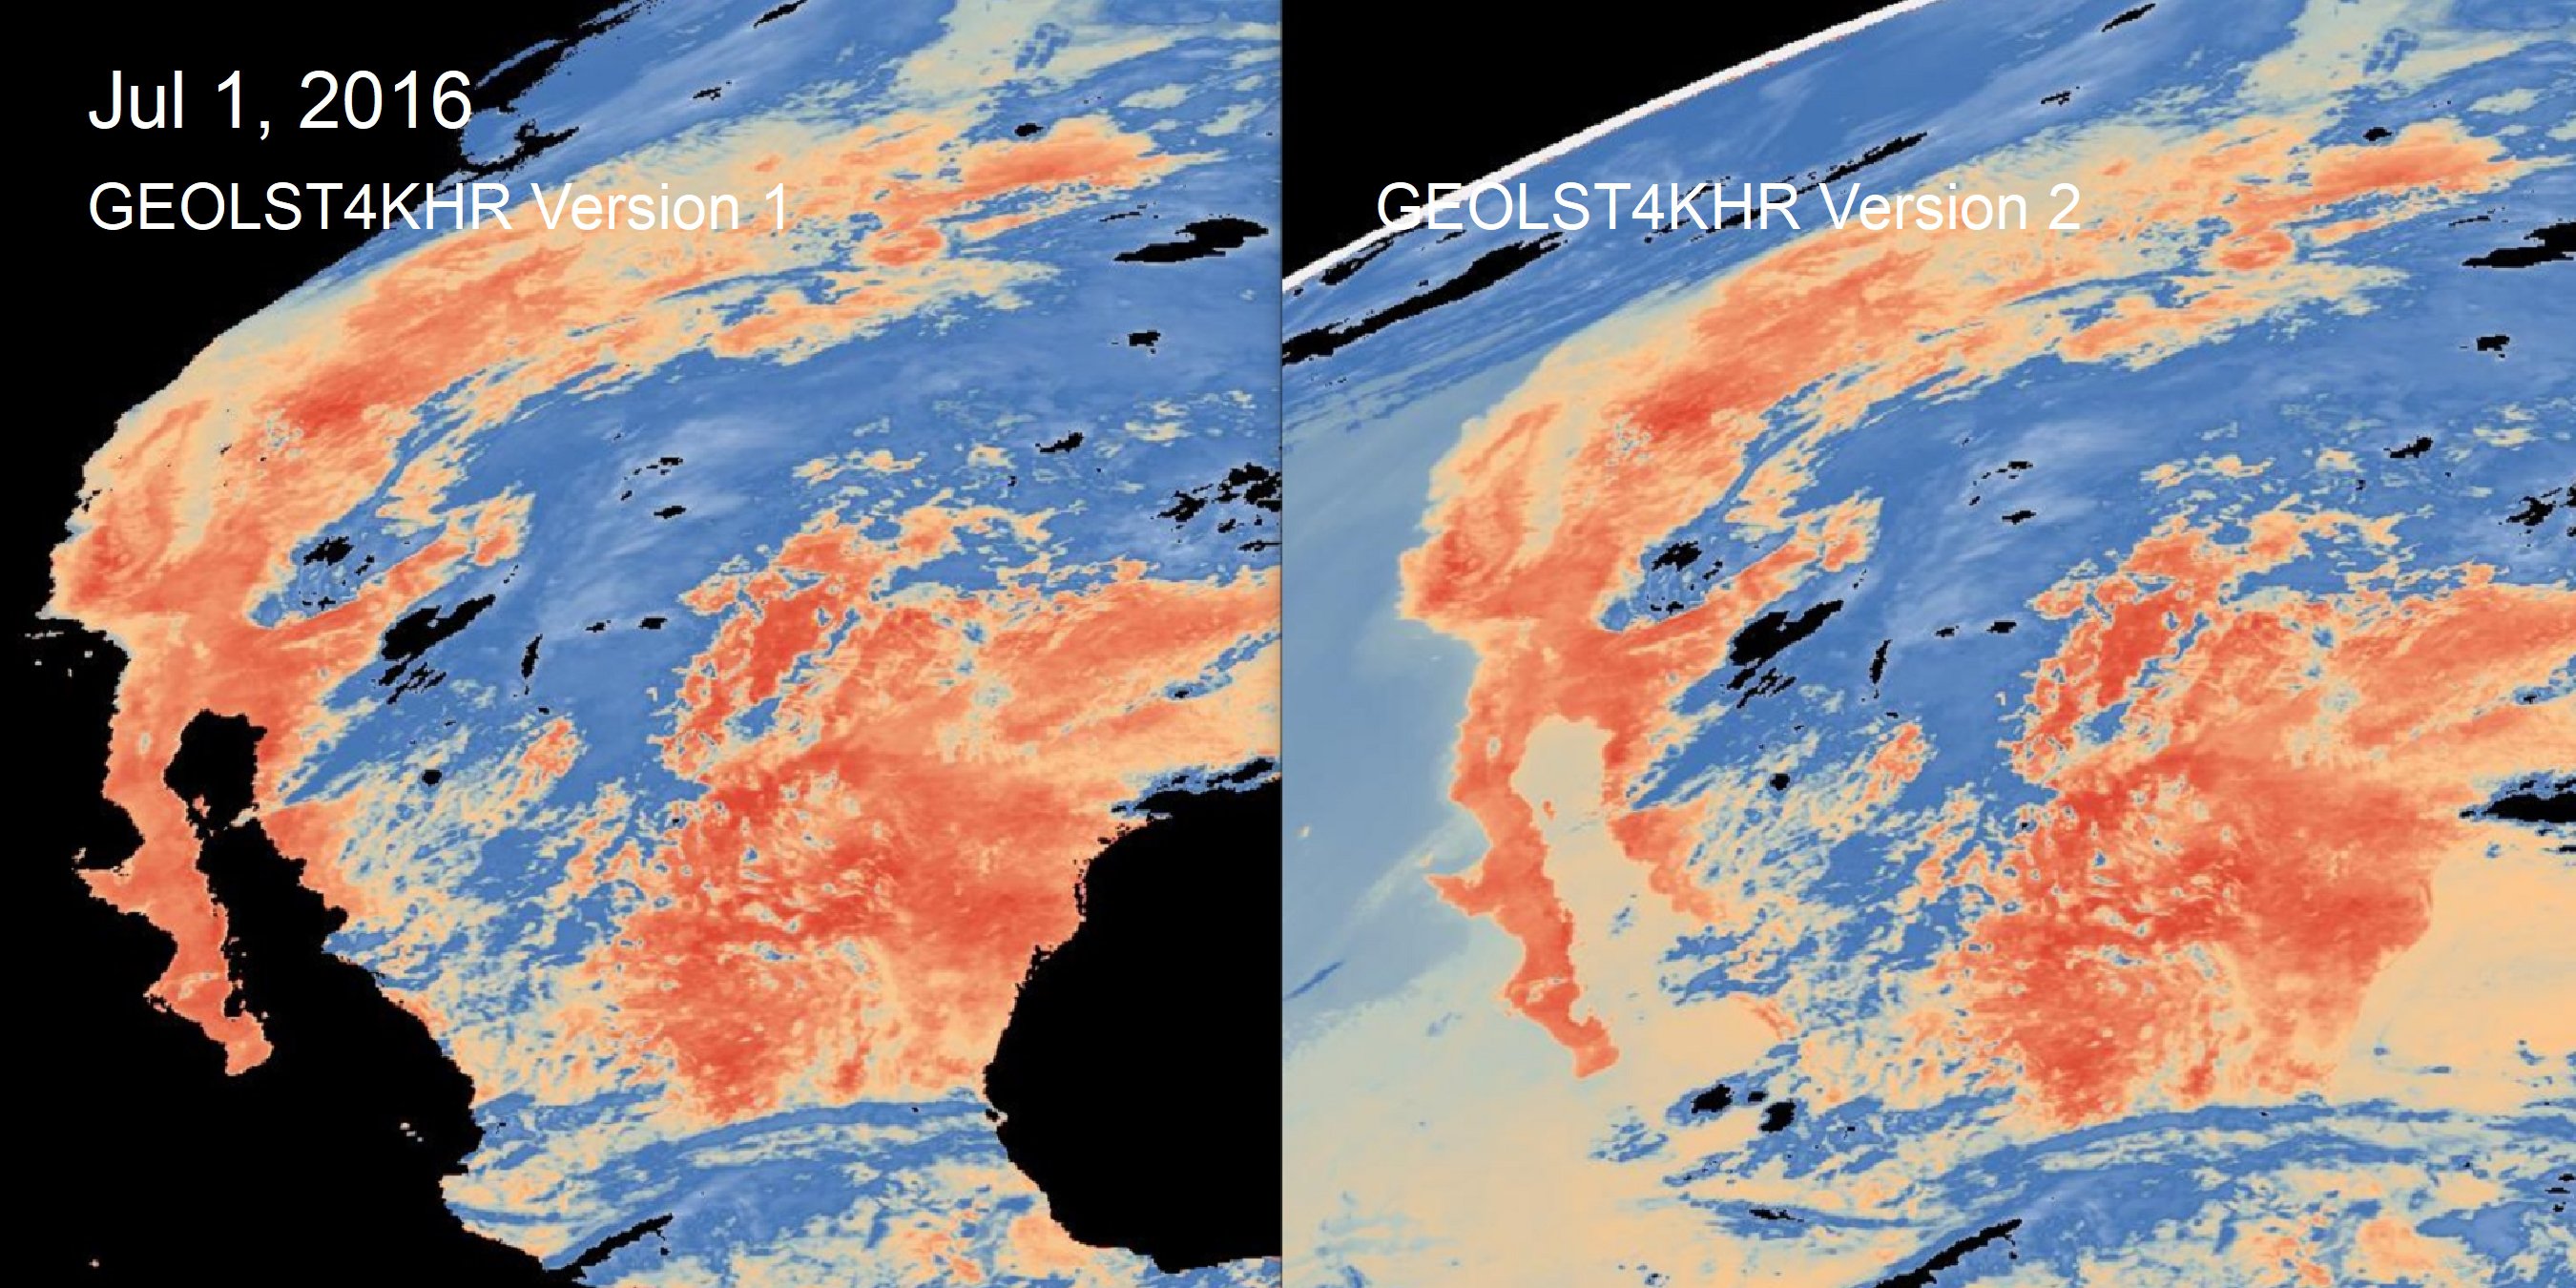
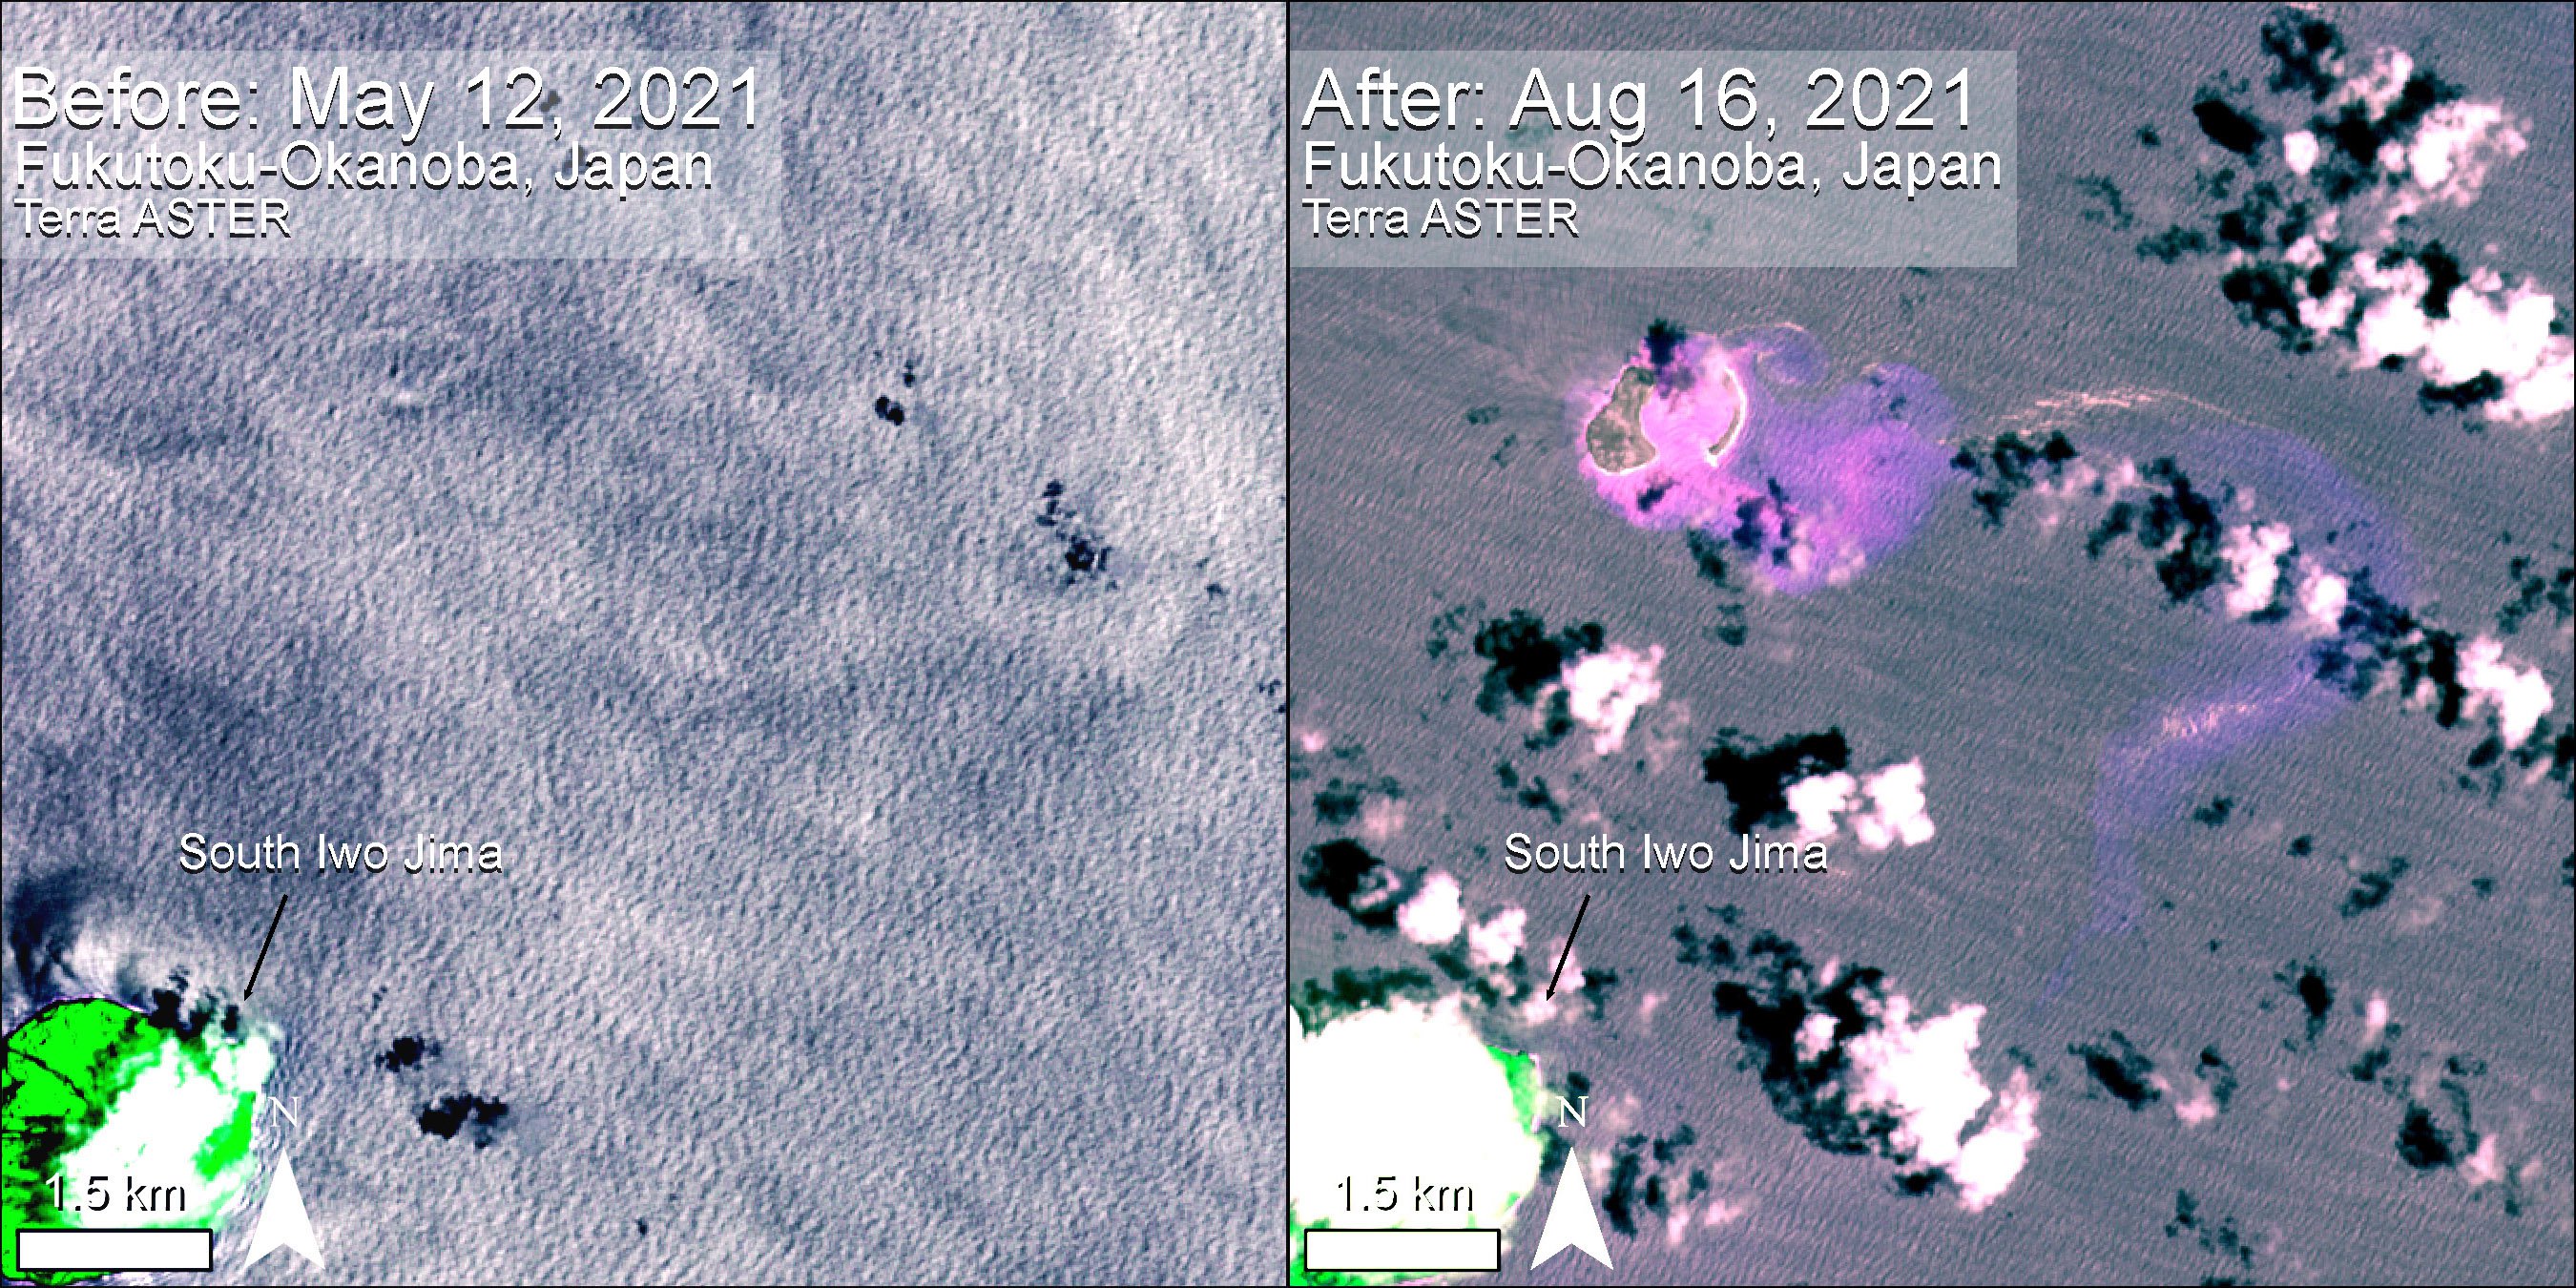
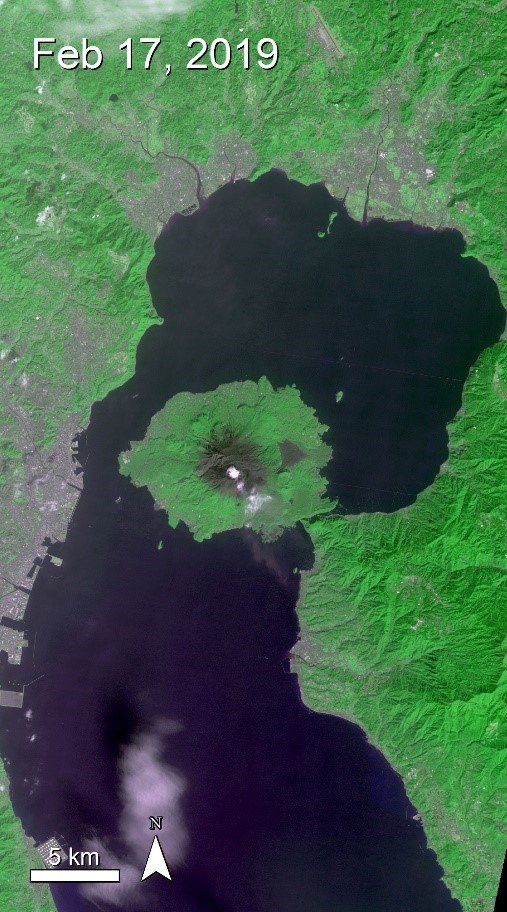
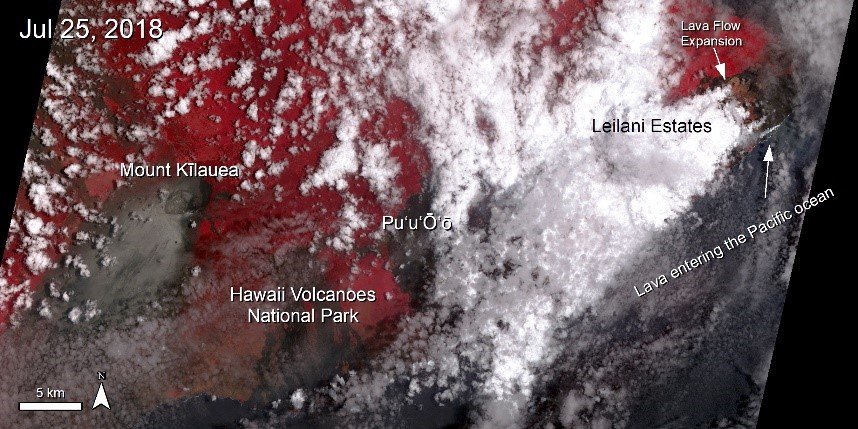
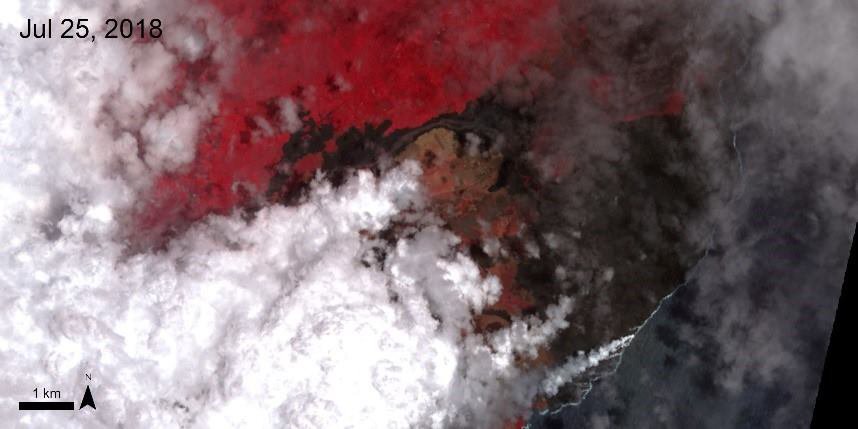
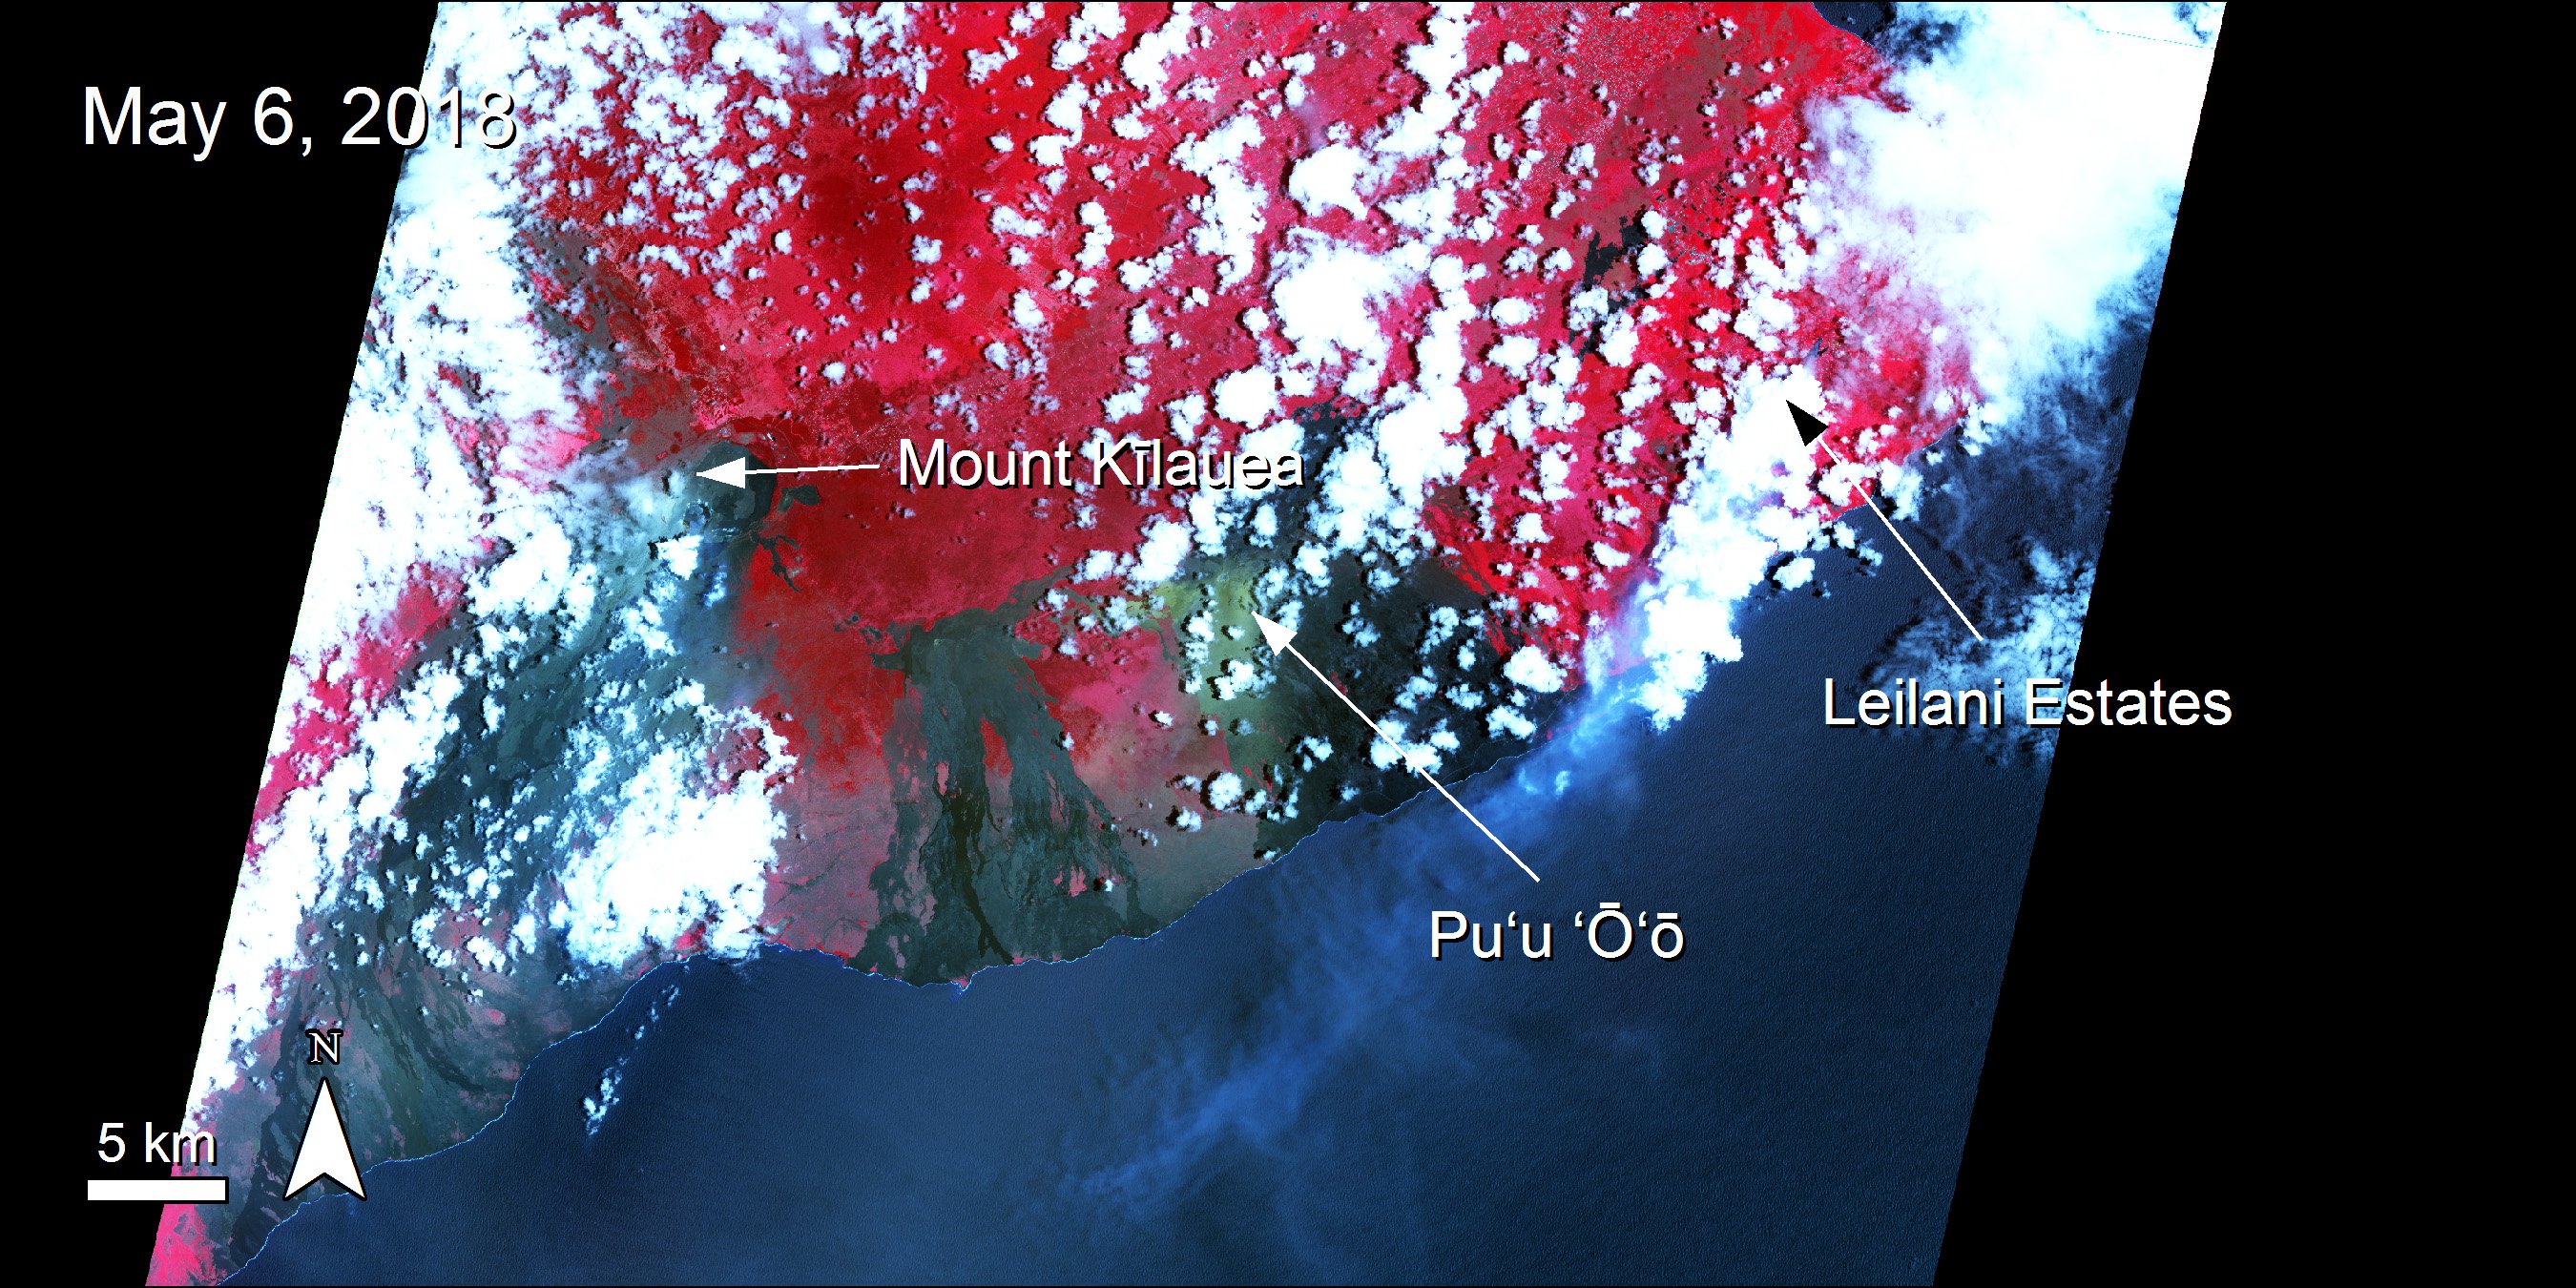
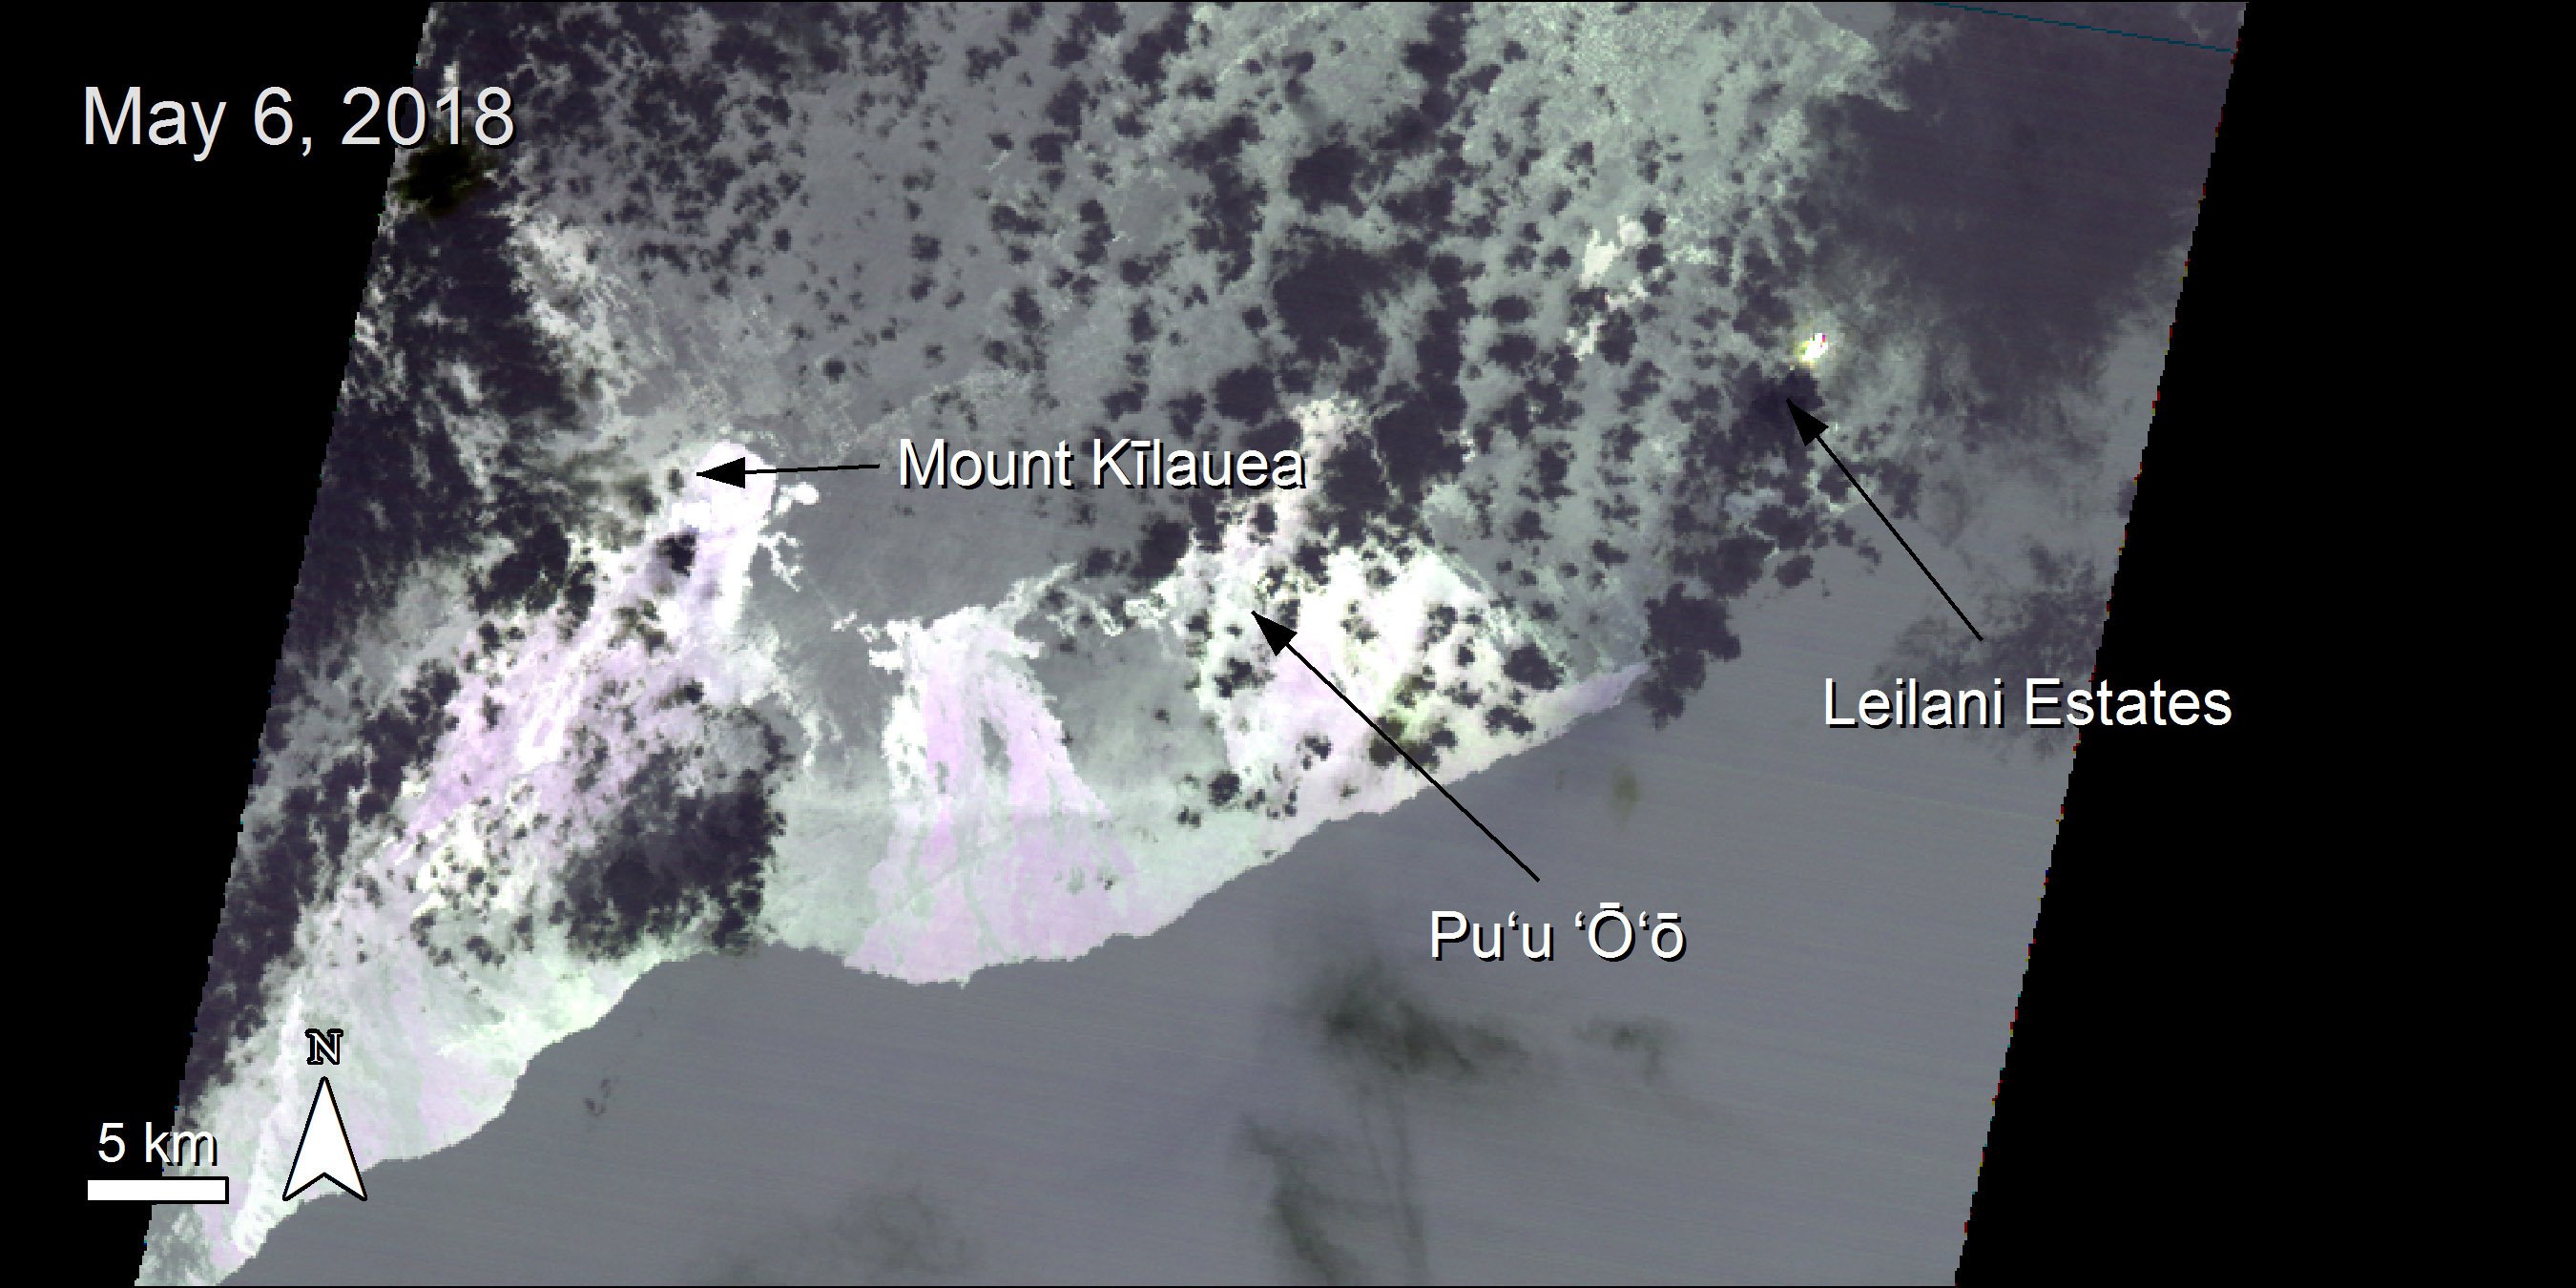
Version 2 of the Harmonized #Landsat and #Sentinel-2 dataset is here! One of the many benefits of the data includes observing volcanoes around the world. Learn more about the data from NASA's #LPDAAC: https://t.co/NzguCiRFUF @USGSLandsat @NASA_Landsat pic.twitter.com/1T9zLBXS34
— NASAEarthdata (@NASAEarthData) August 25, 2021
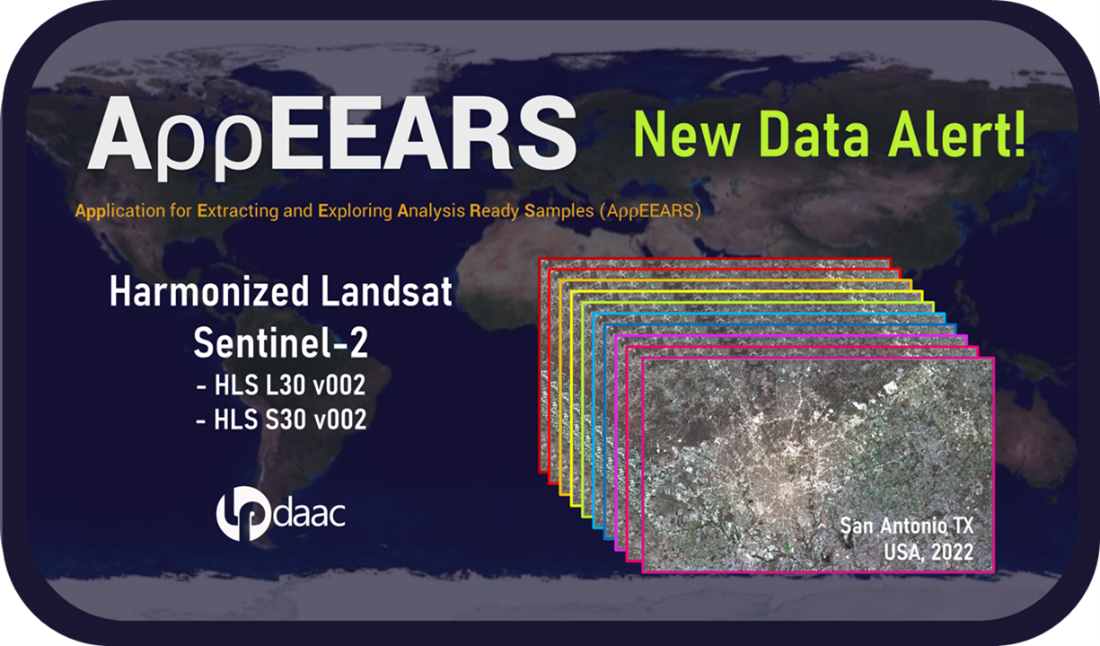
Version 2 of the Harmonized #Landsat and #Sentinel-2 (#HLS) data products are here! For information about dataset improvements and availability, see NASA's Land Processes DAAC (#LPDAAC) at: https://t.co/NzguCiRFUF@NASA_Landsat, @USGSLandsat, @esaoperations pic.twitter.com/LiHilJmMpj
— NASAEarthdata (@NASAEarthData) August 24, 2021
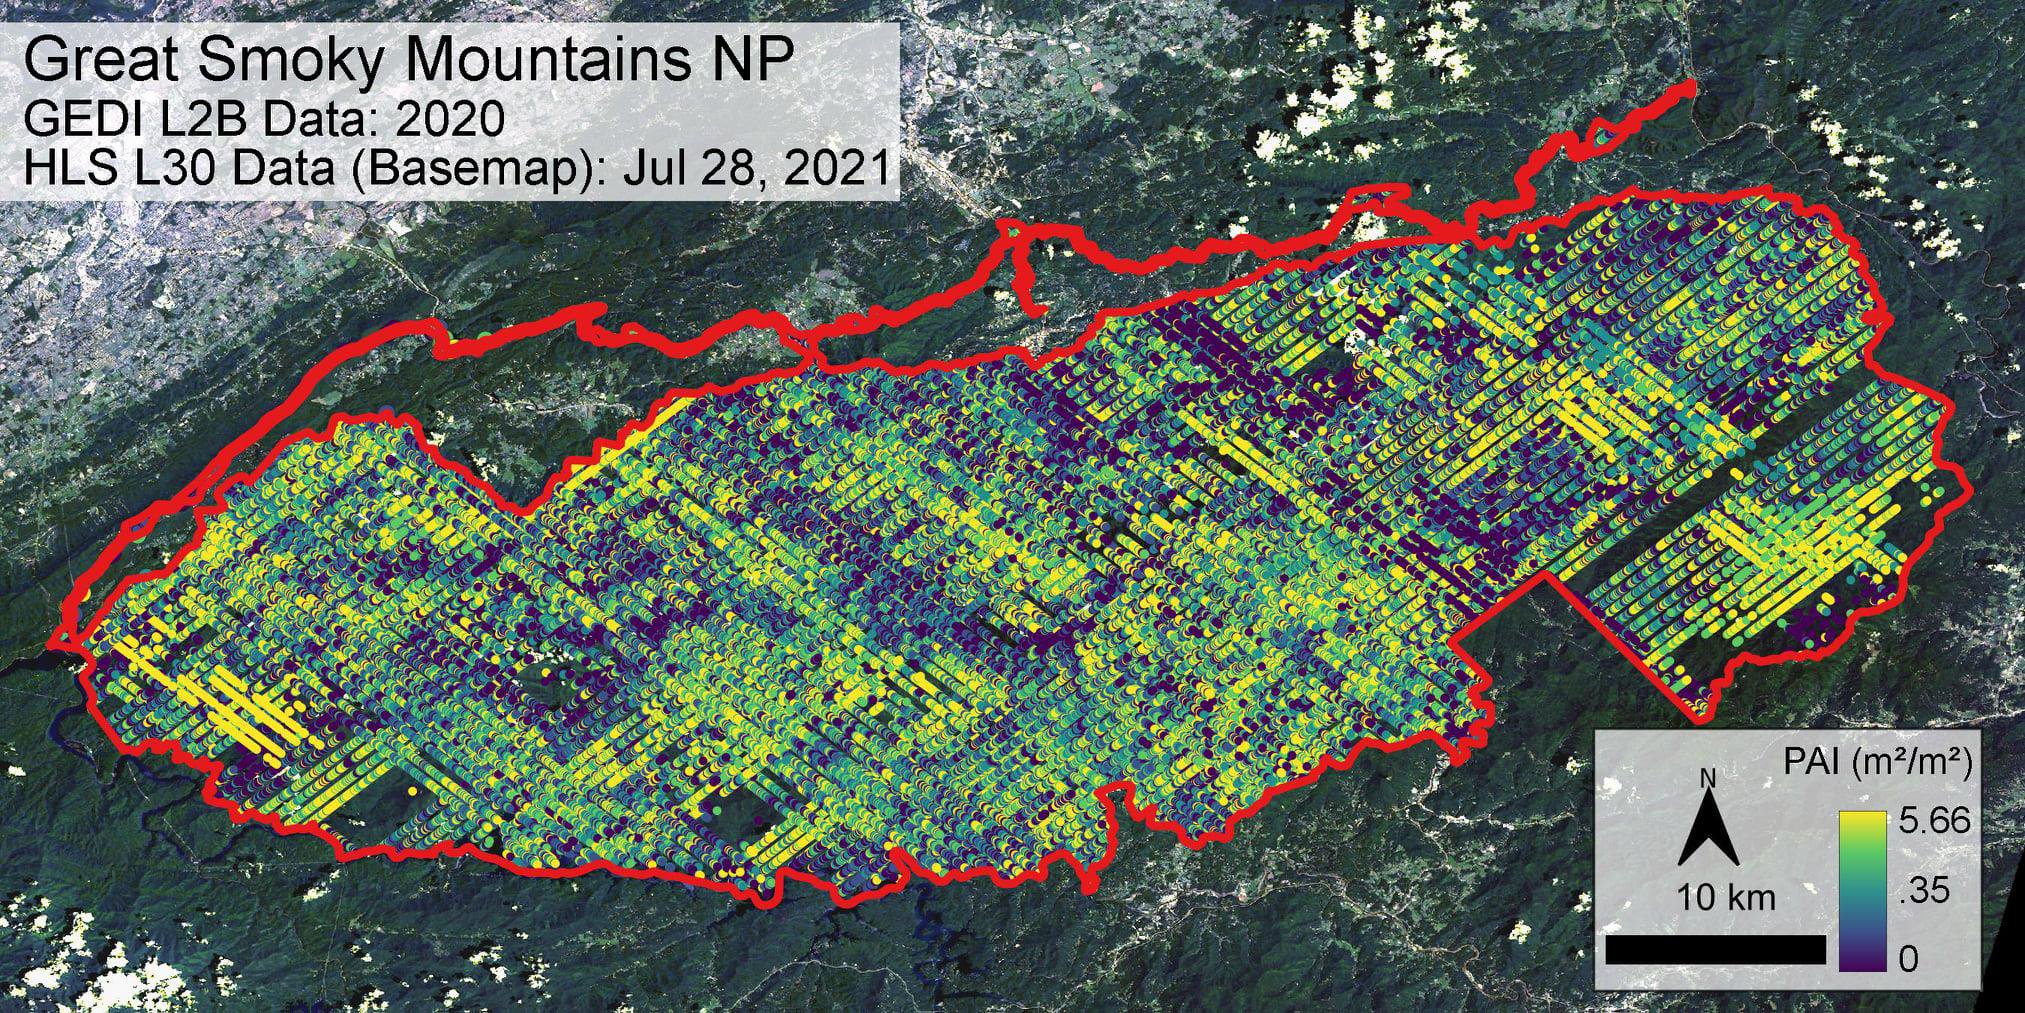
3D observations of the Earth from spaaaaaace? Meet GEDI, a full-waveform Lidar instrument aboard the ISS providing us with 3D observations and precise measurements of forest canopies and surface elevation. Visit NASA's #LPDAAC to learn more: https://t.co/O3WhGxvYJ3 @GEDI_Knights pic.twitter.com/V6gW0n1Nwd
— NASAEarthdata (@NASAEarthData) August 10, 2021
Watch this video on Facebook.
Watch this video on Twitter.
Watch this video on NASA Earthdata's YouTube.
Watch this video on USGS' YouTube.
Watch this video on the USGS Media Gallery.
Observe over two decades of snow cover (in red) over the Sierra Nevadas from 2000-2021 with data from the Terra MODIS and NASA/NOAA VIIRS instruments. DYK: Scientists measure the snowpack in these mountains every year on April 1 as it is an indicator of #drought? #LPDAAC pic.twitter.com/SYmoLDnfWv
— NASAEarthdata (@NASAEarthData) April 14, 2021
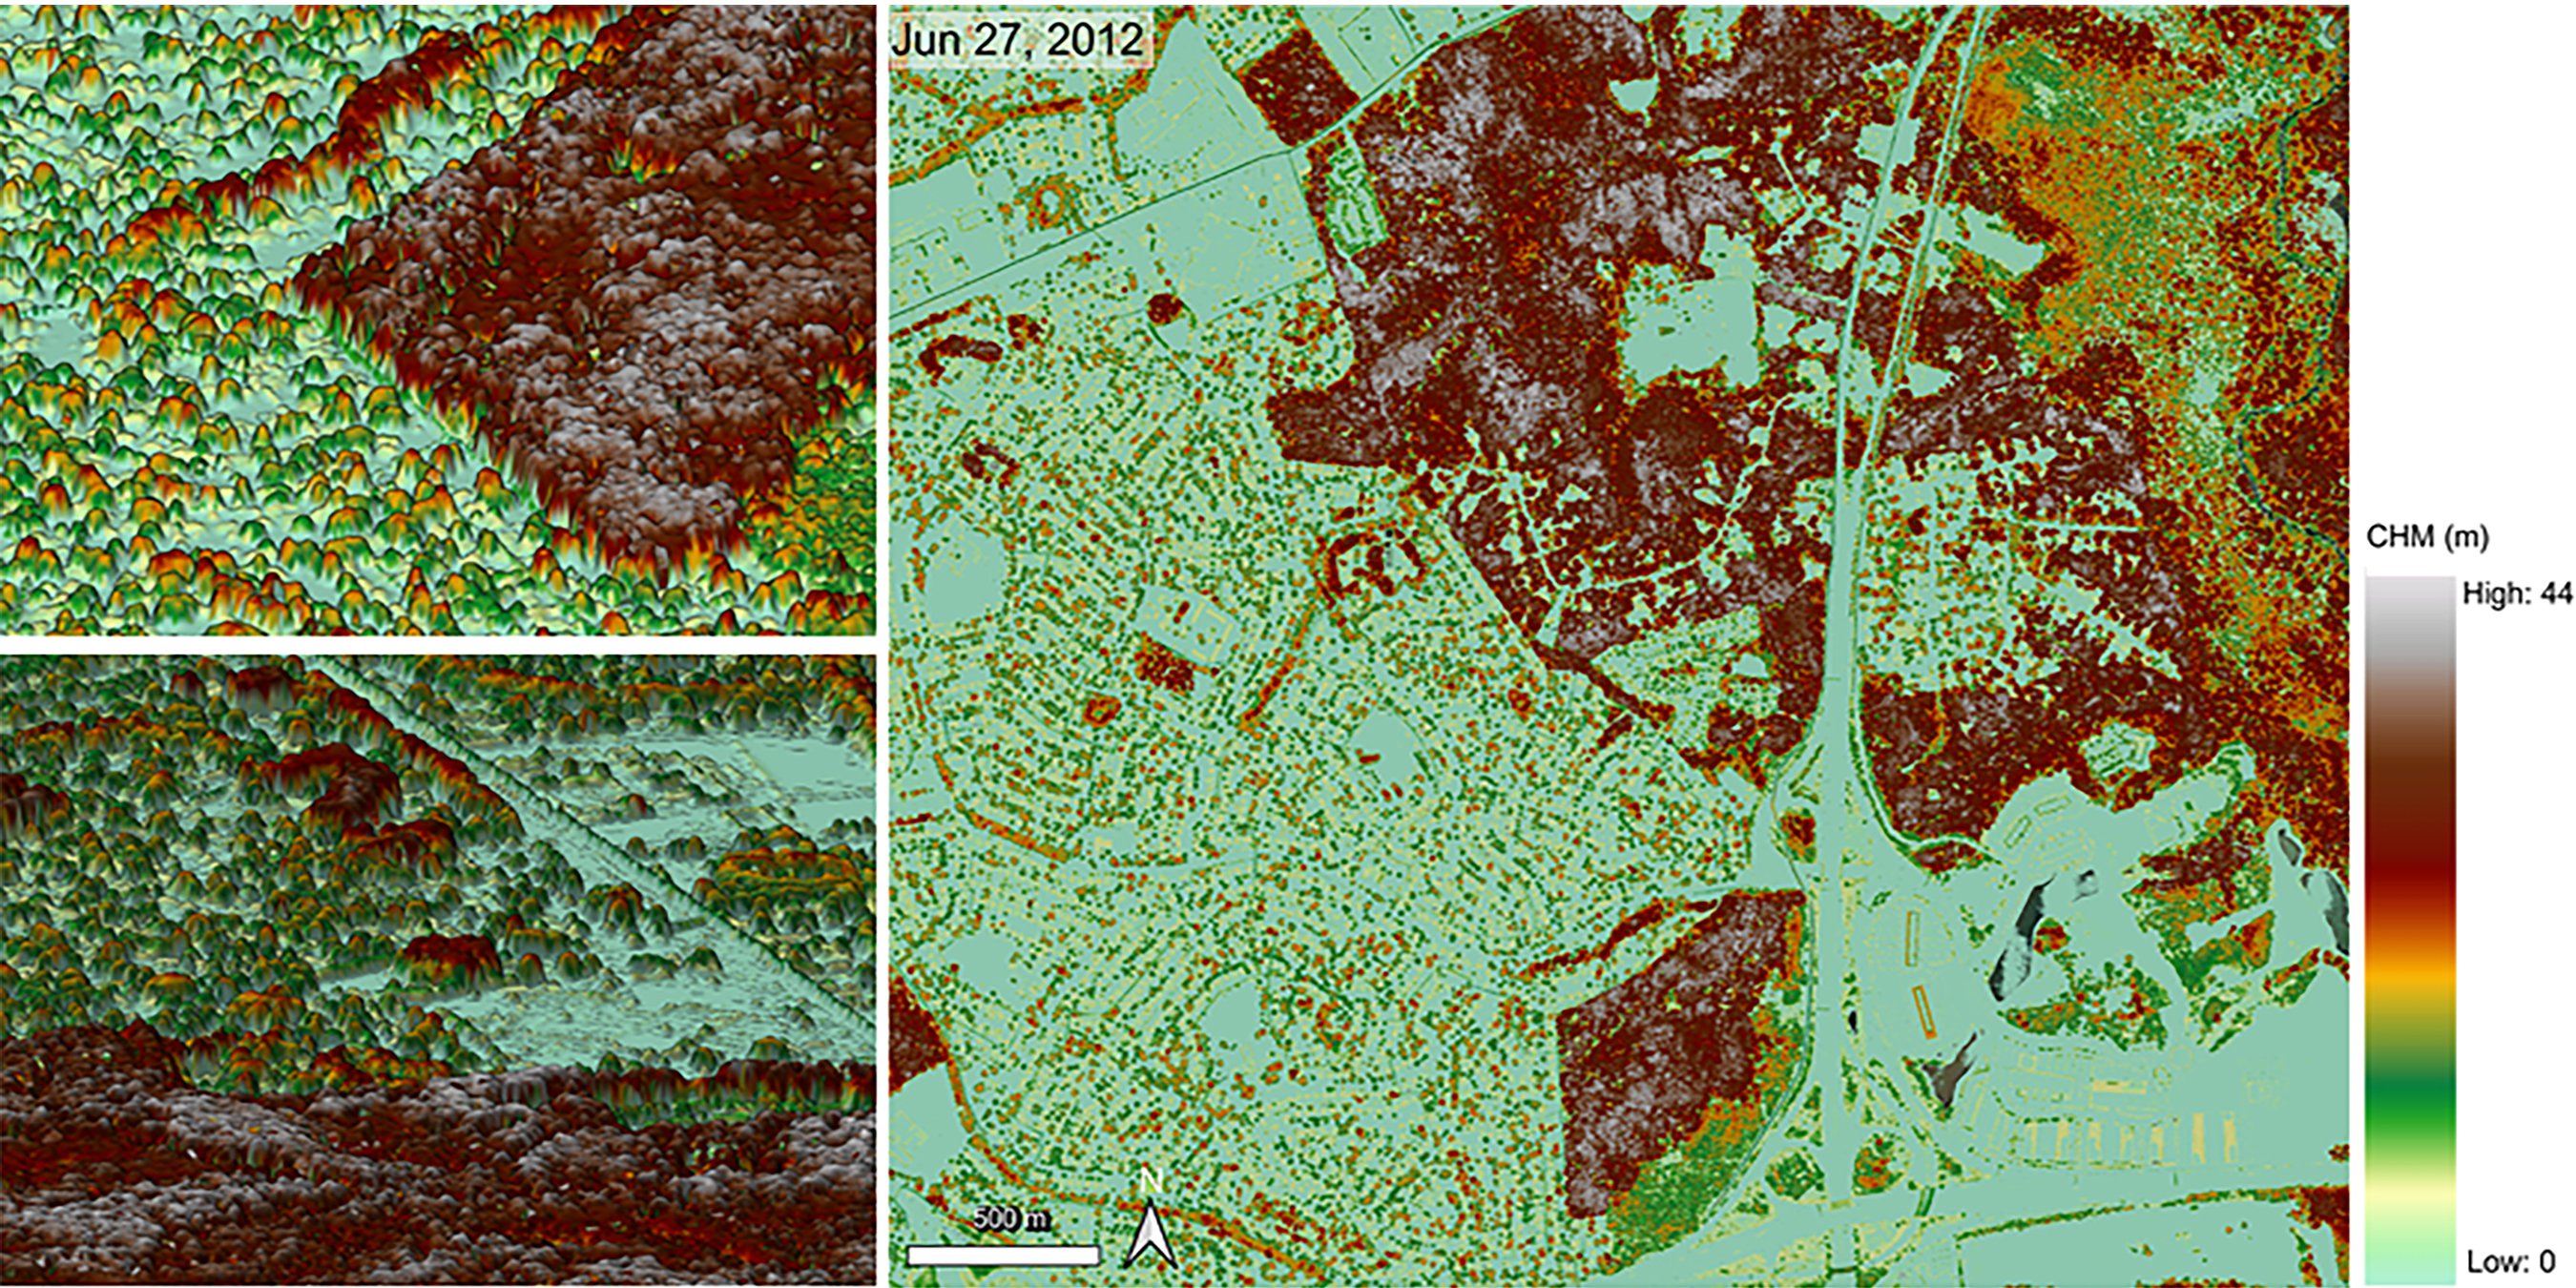
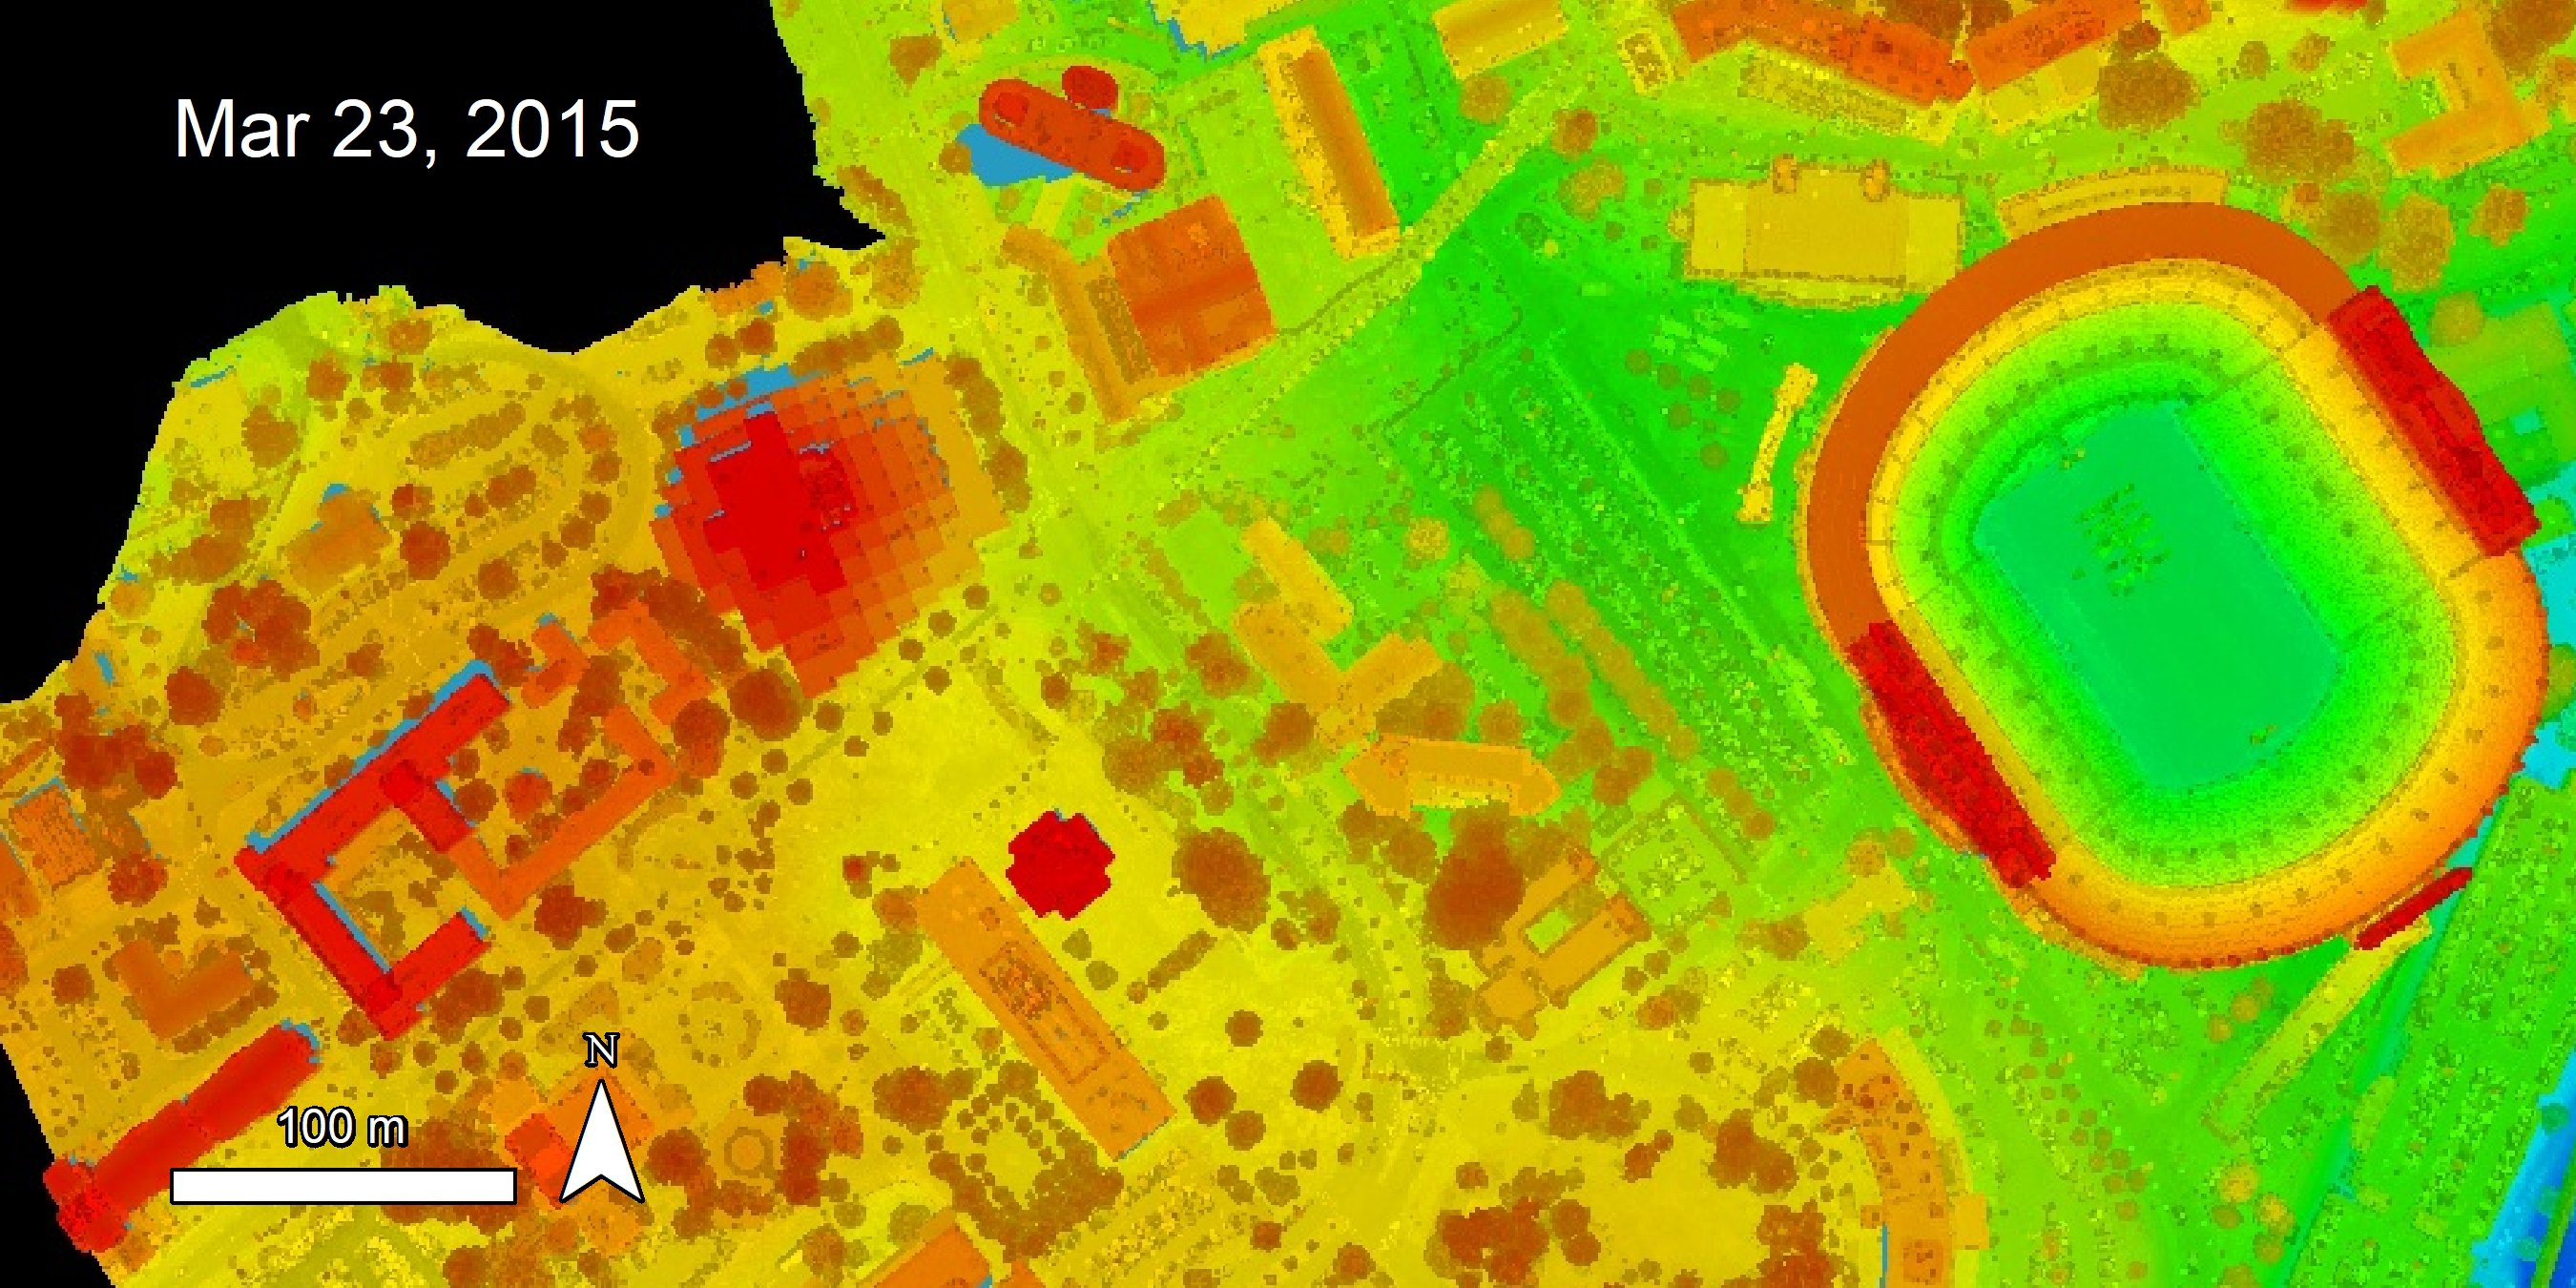
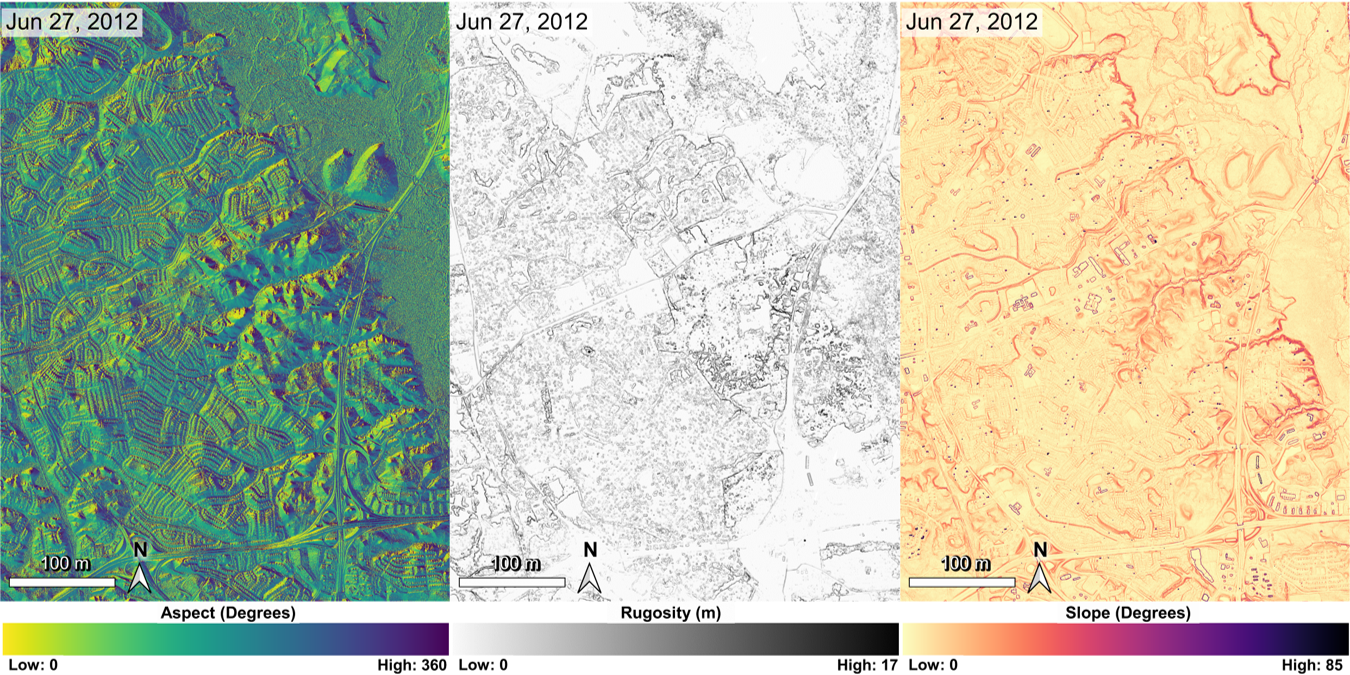
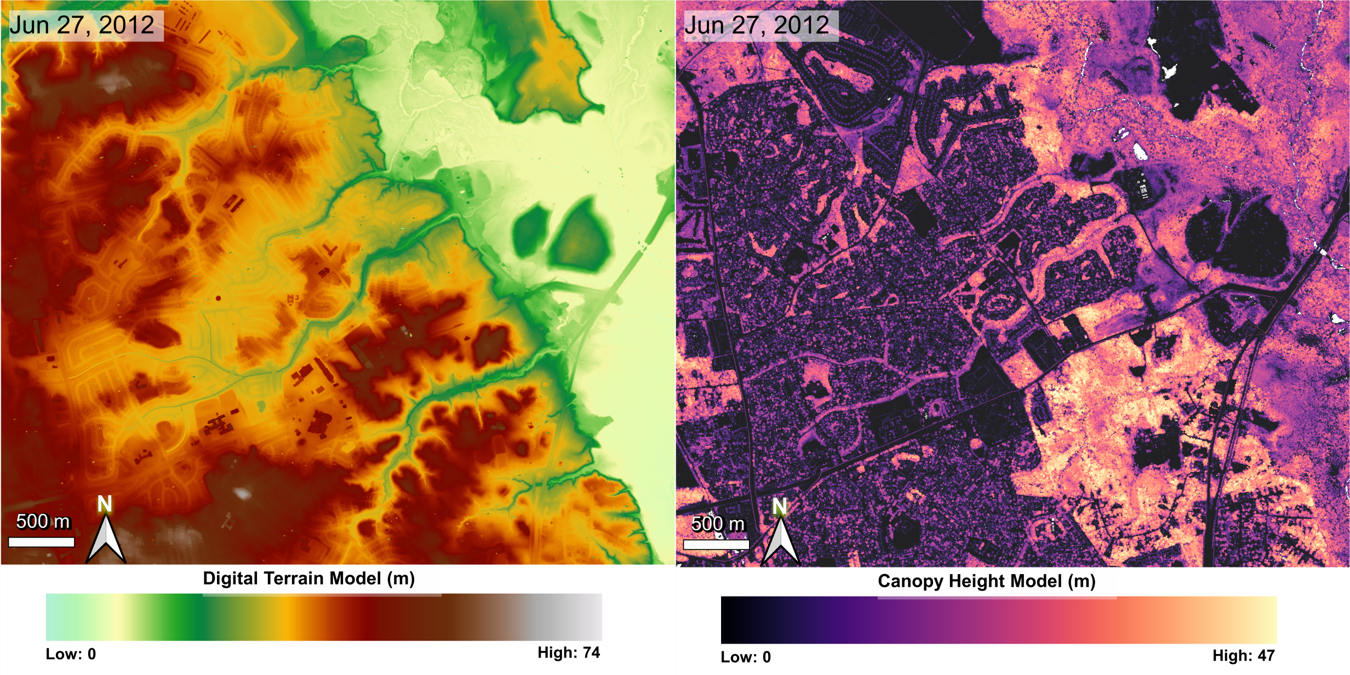
Canopy Height Model mapped over suburban area of Bowie, Maryland.
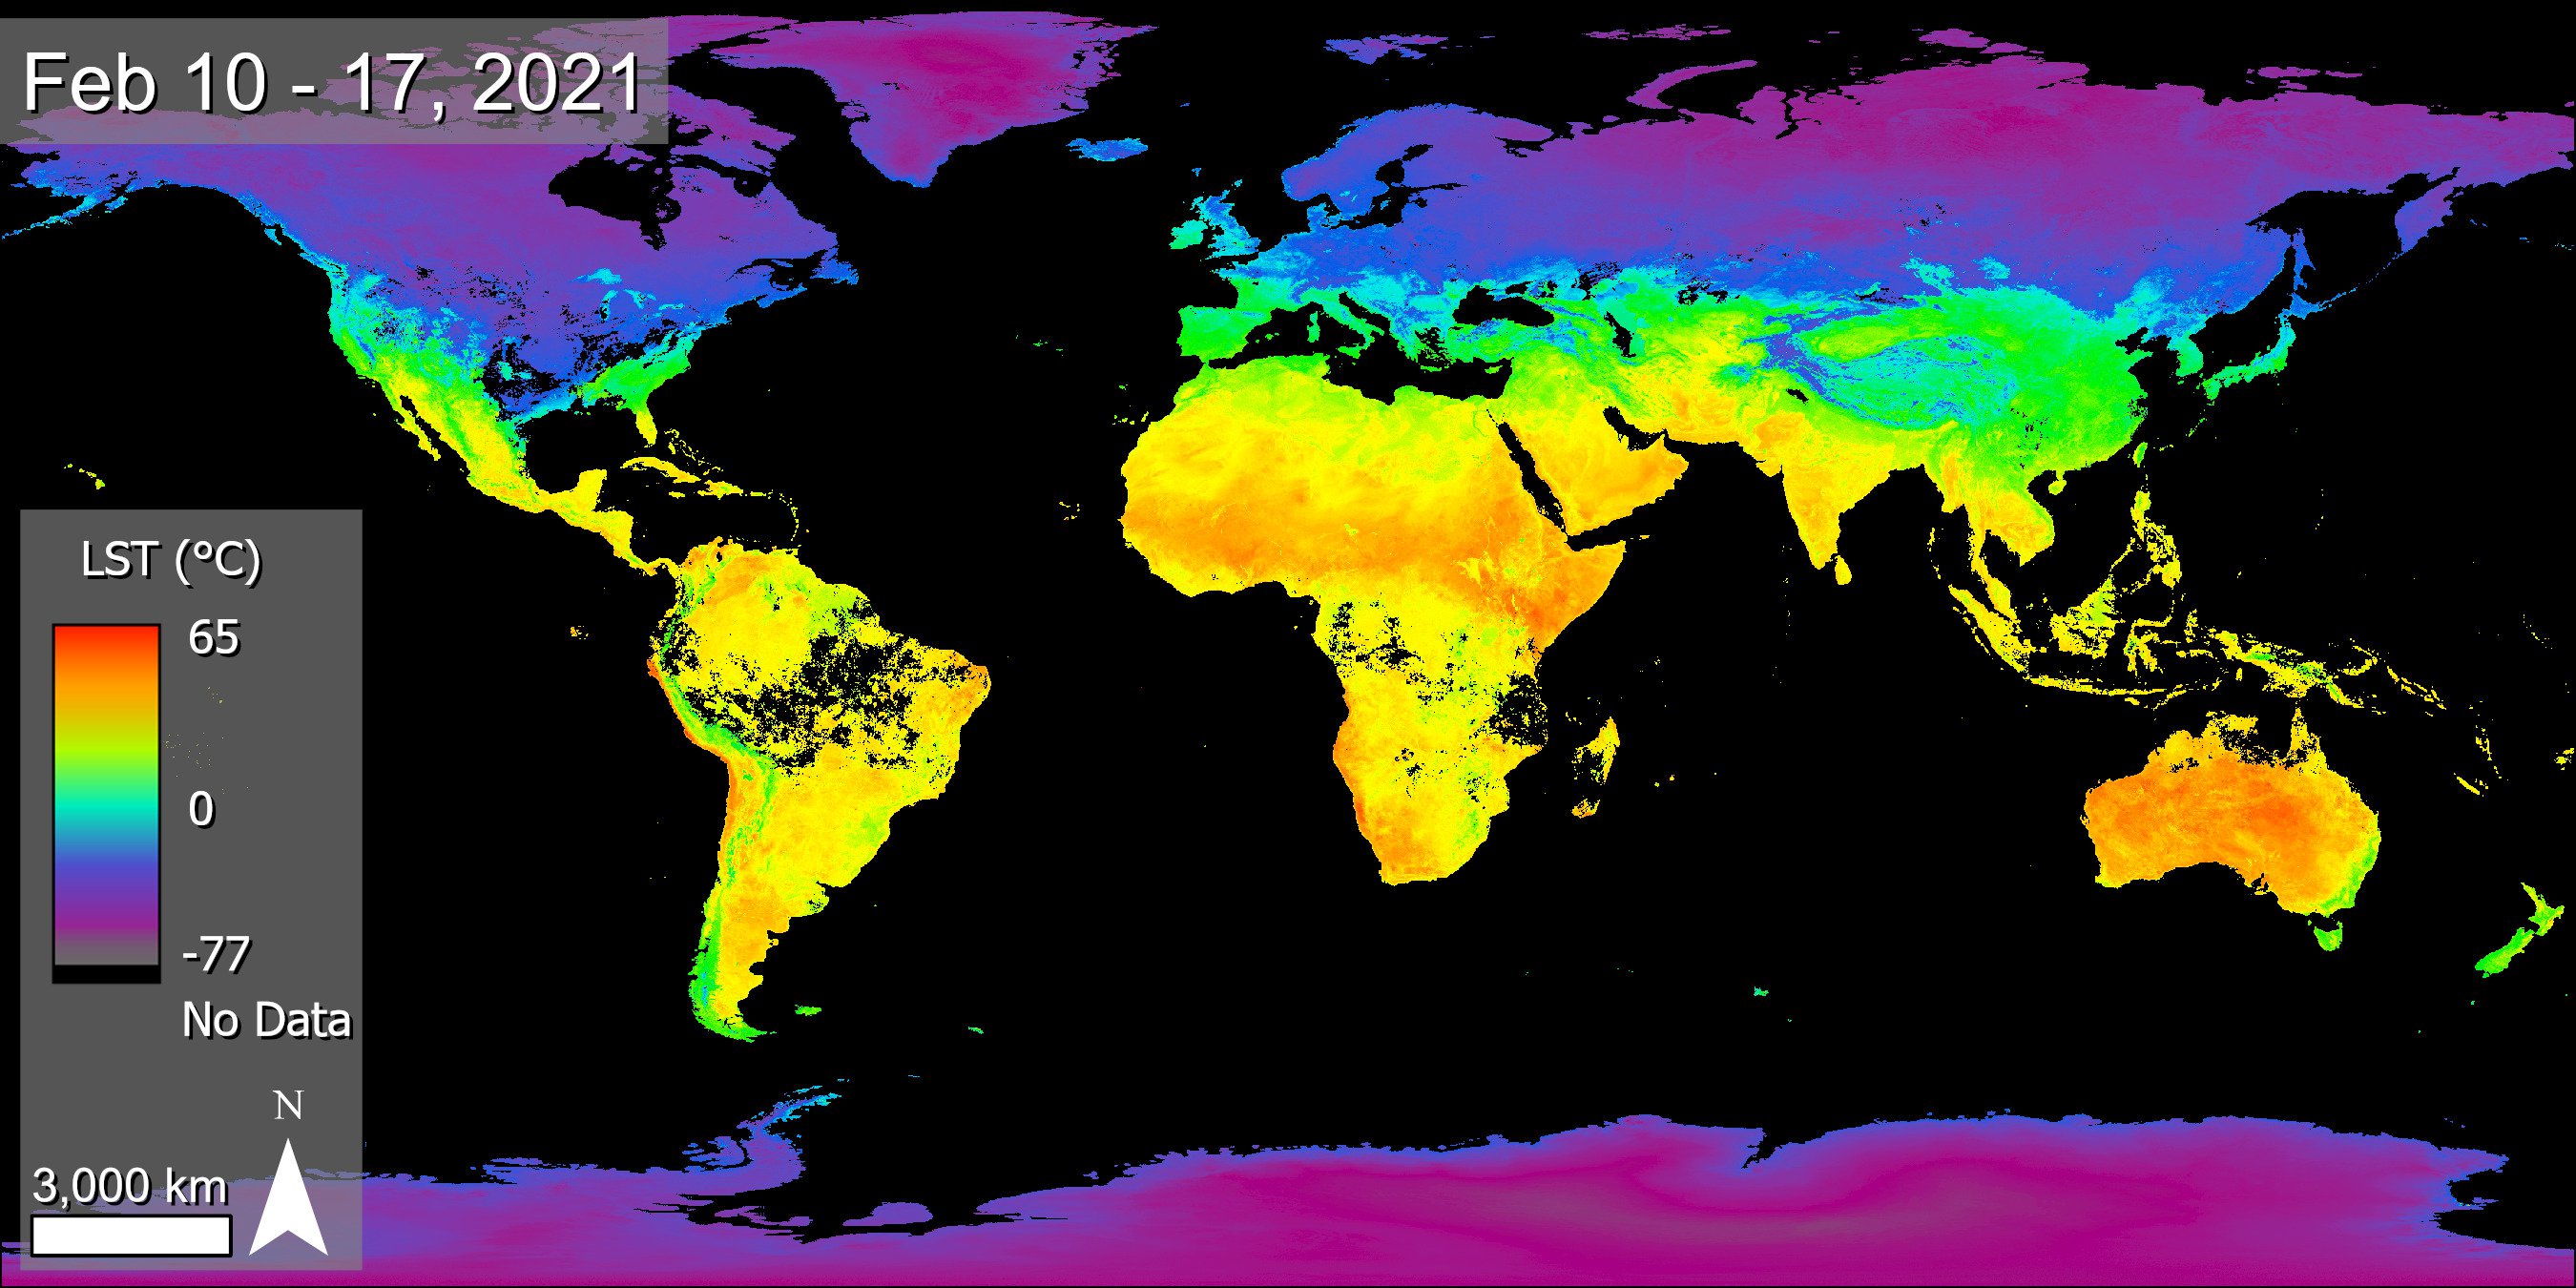
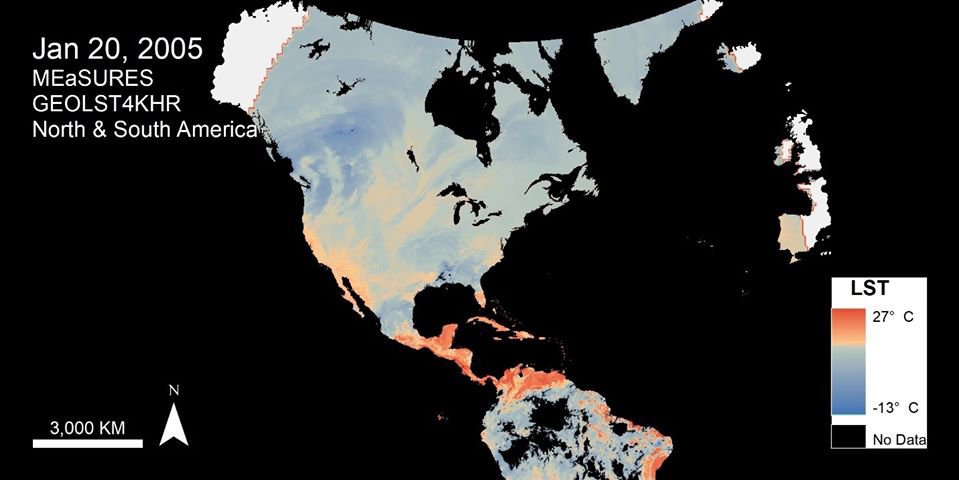
Observe the changing temperature of Earth’s land surface throughout the year 2020 using data from NASA's Terra MODIS instrument. Learn about the land surface temperature data used in this video at #LPDAAC: https://t.co/seK4HBt5dX pic.twitter.com/uG30Fumy6k
— NASAEarthdata (@NASAEarthData) January 25, 2021


The recent #derecho in the Midwest caused significant damage in Iowa. This Aqua MODIS Surface Reflectance image pair shows damage to croplands as lighter shades of green. Visit NASA’s #LPDAAC to learn about the data used to make this GIF: https://t.co/Wkf6Ch30RM, #remotesensing pic.twitter.com/FsFfJktmkH
— NASAEarthdata (@NASAEarthData) August 20, 2020
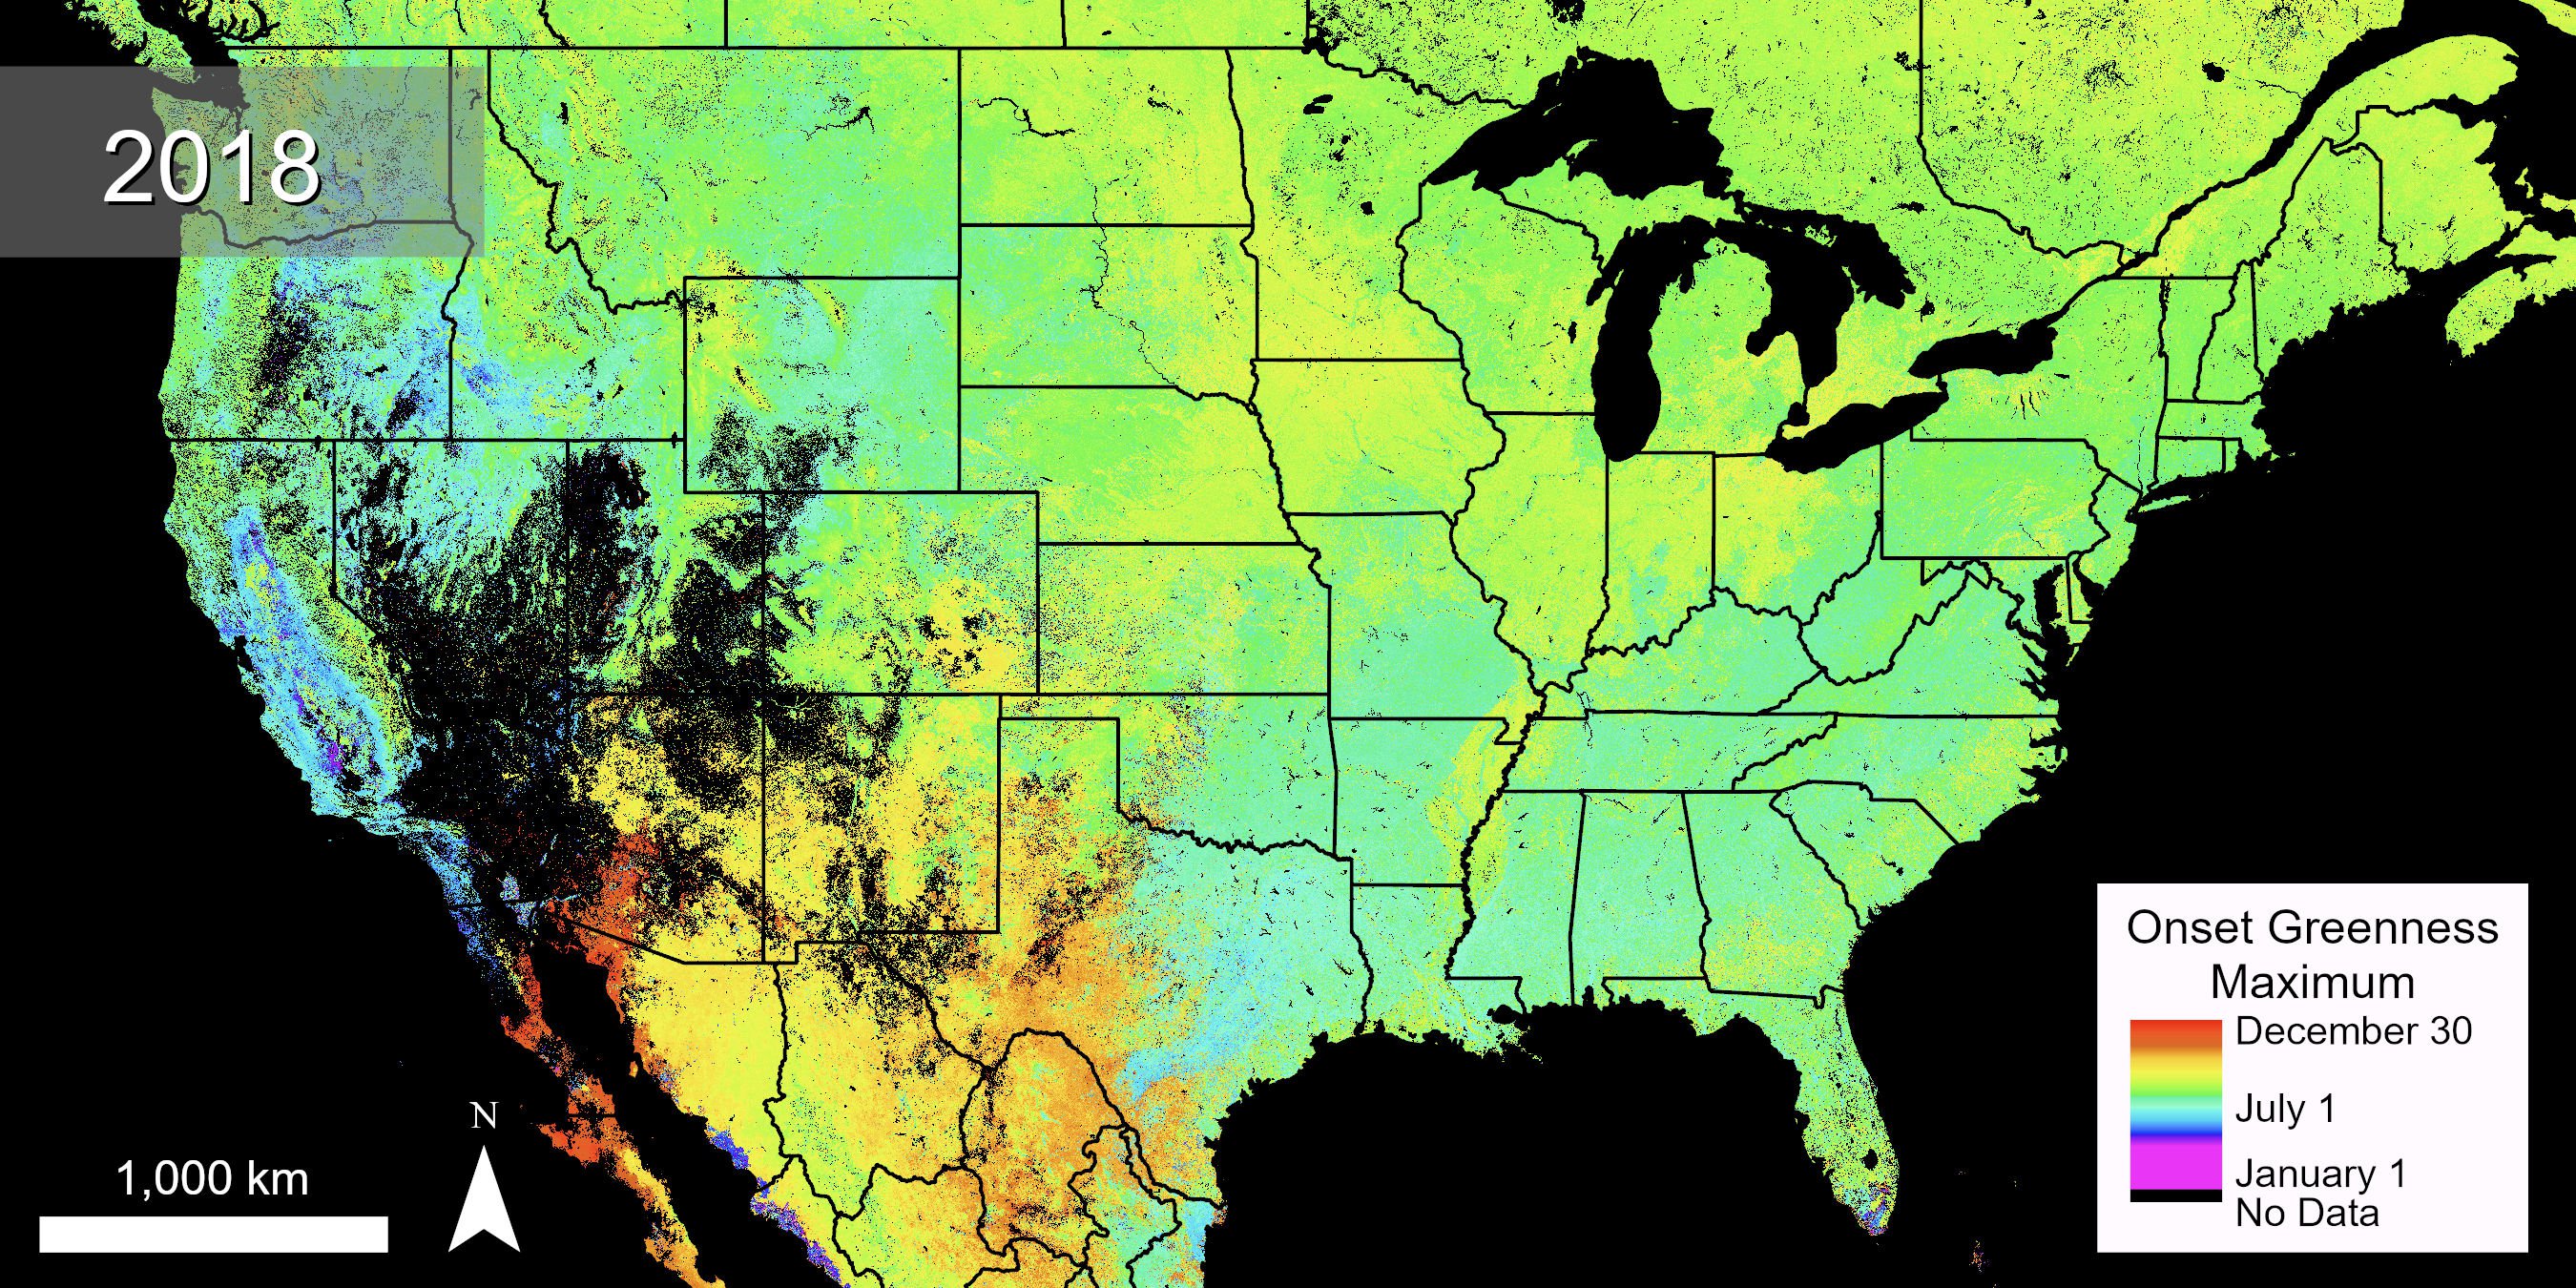
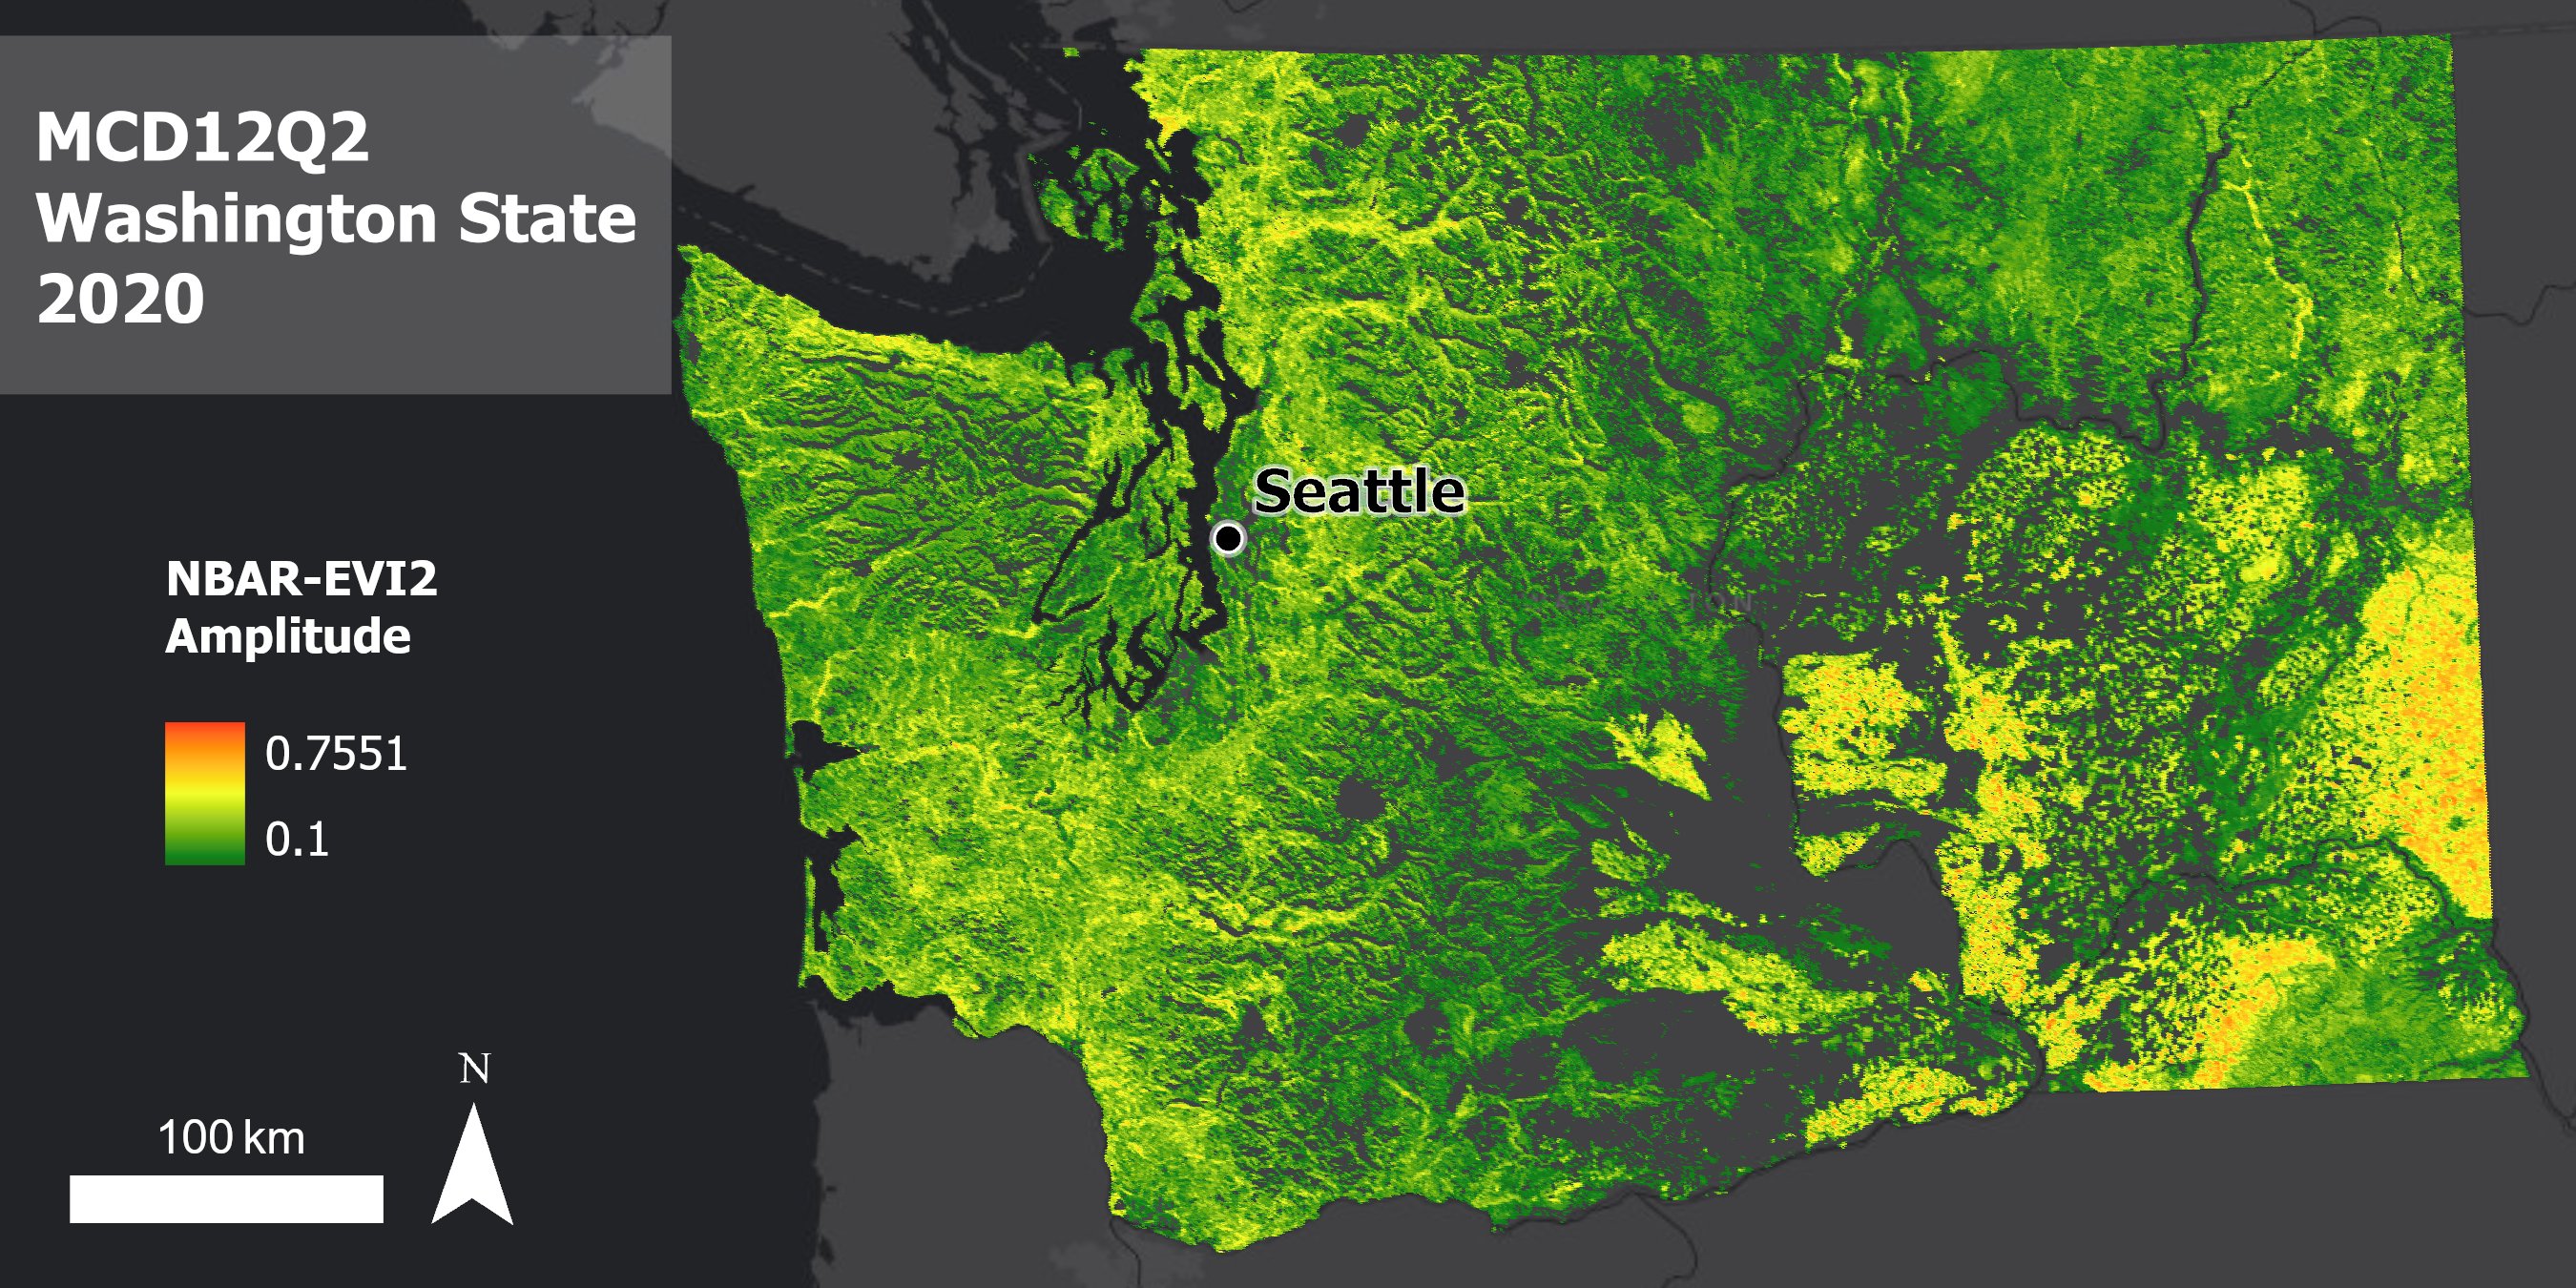
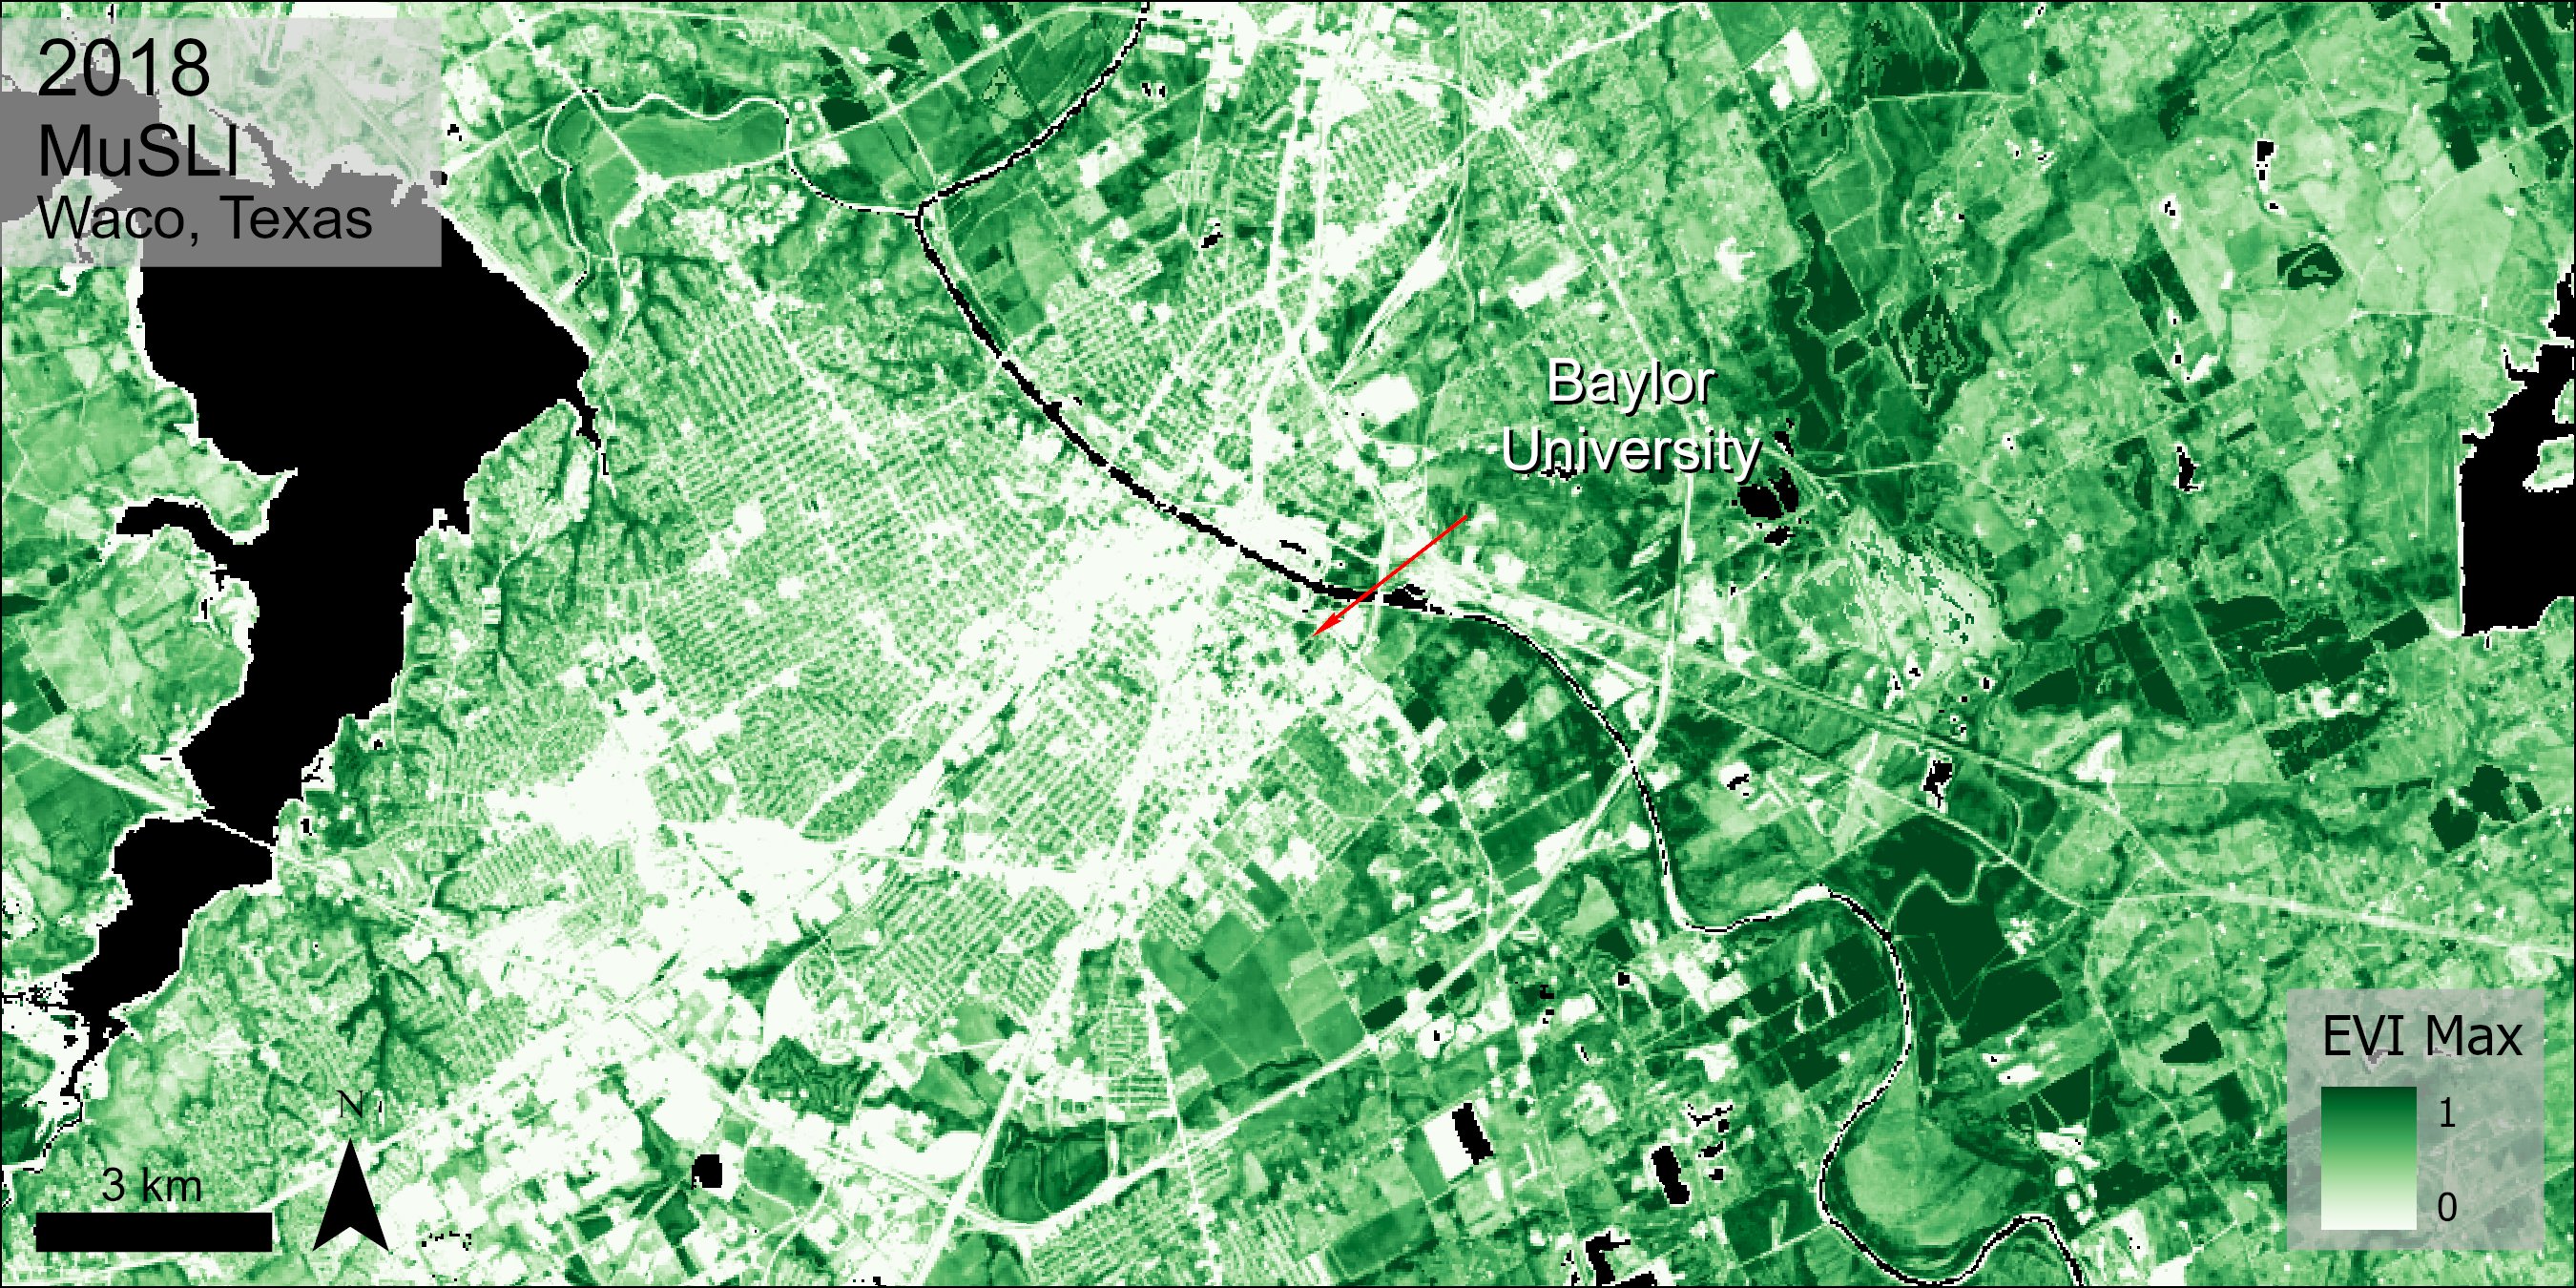
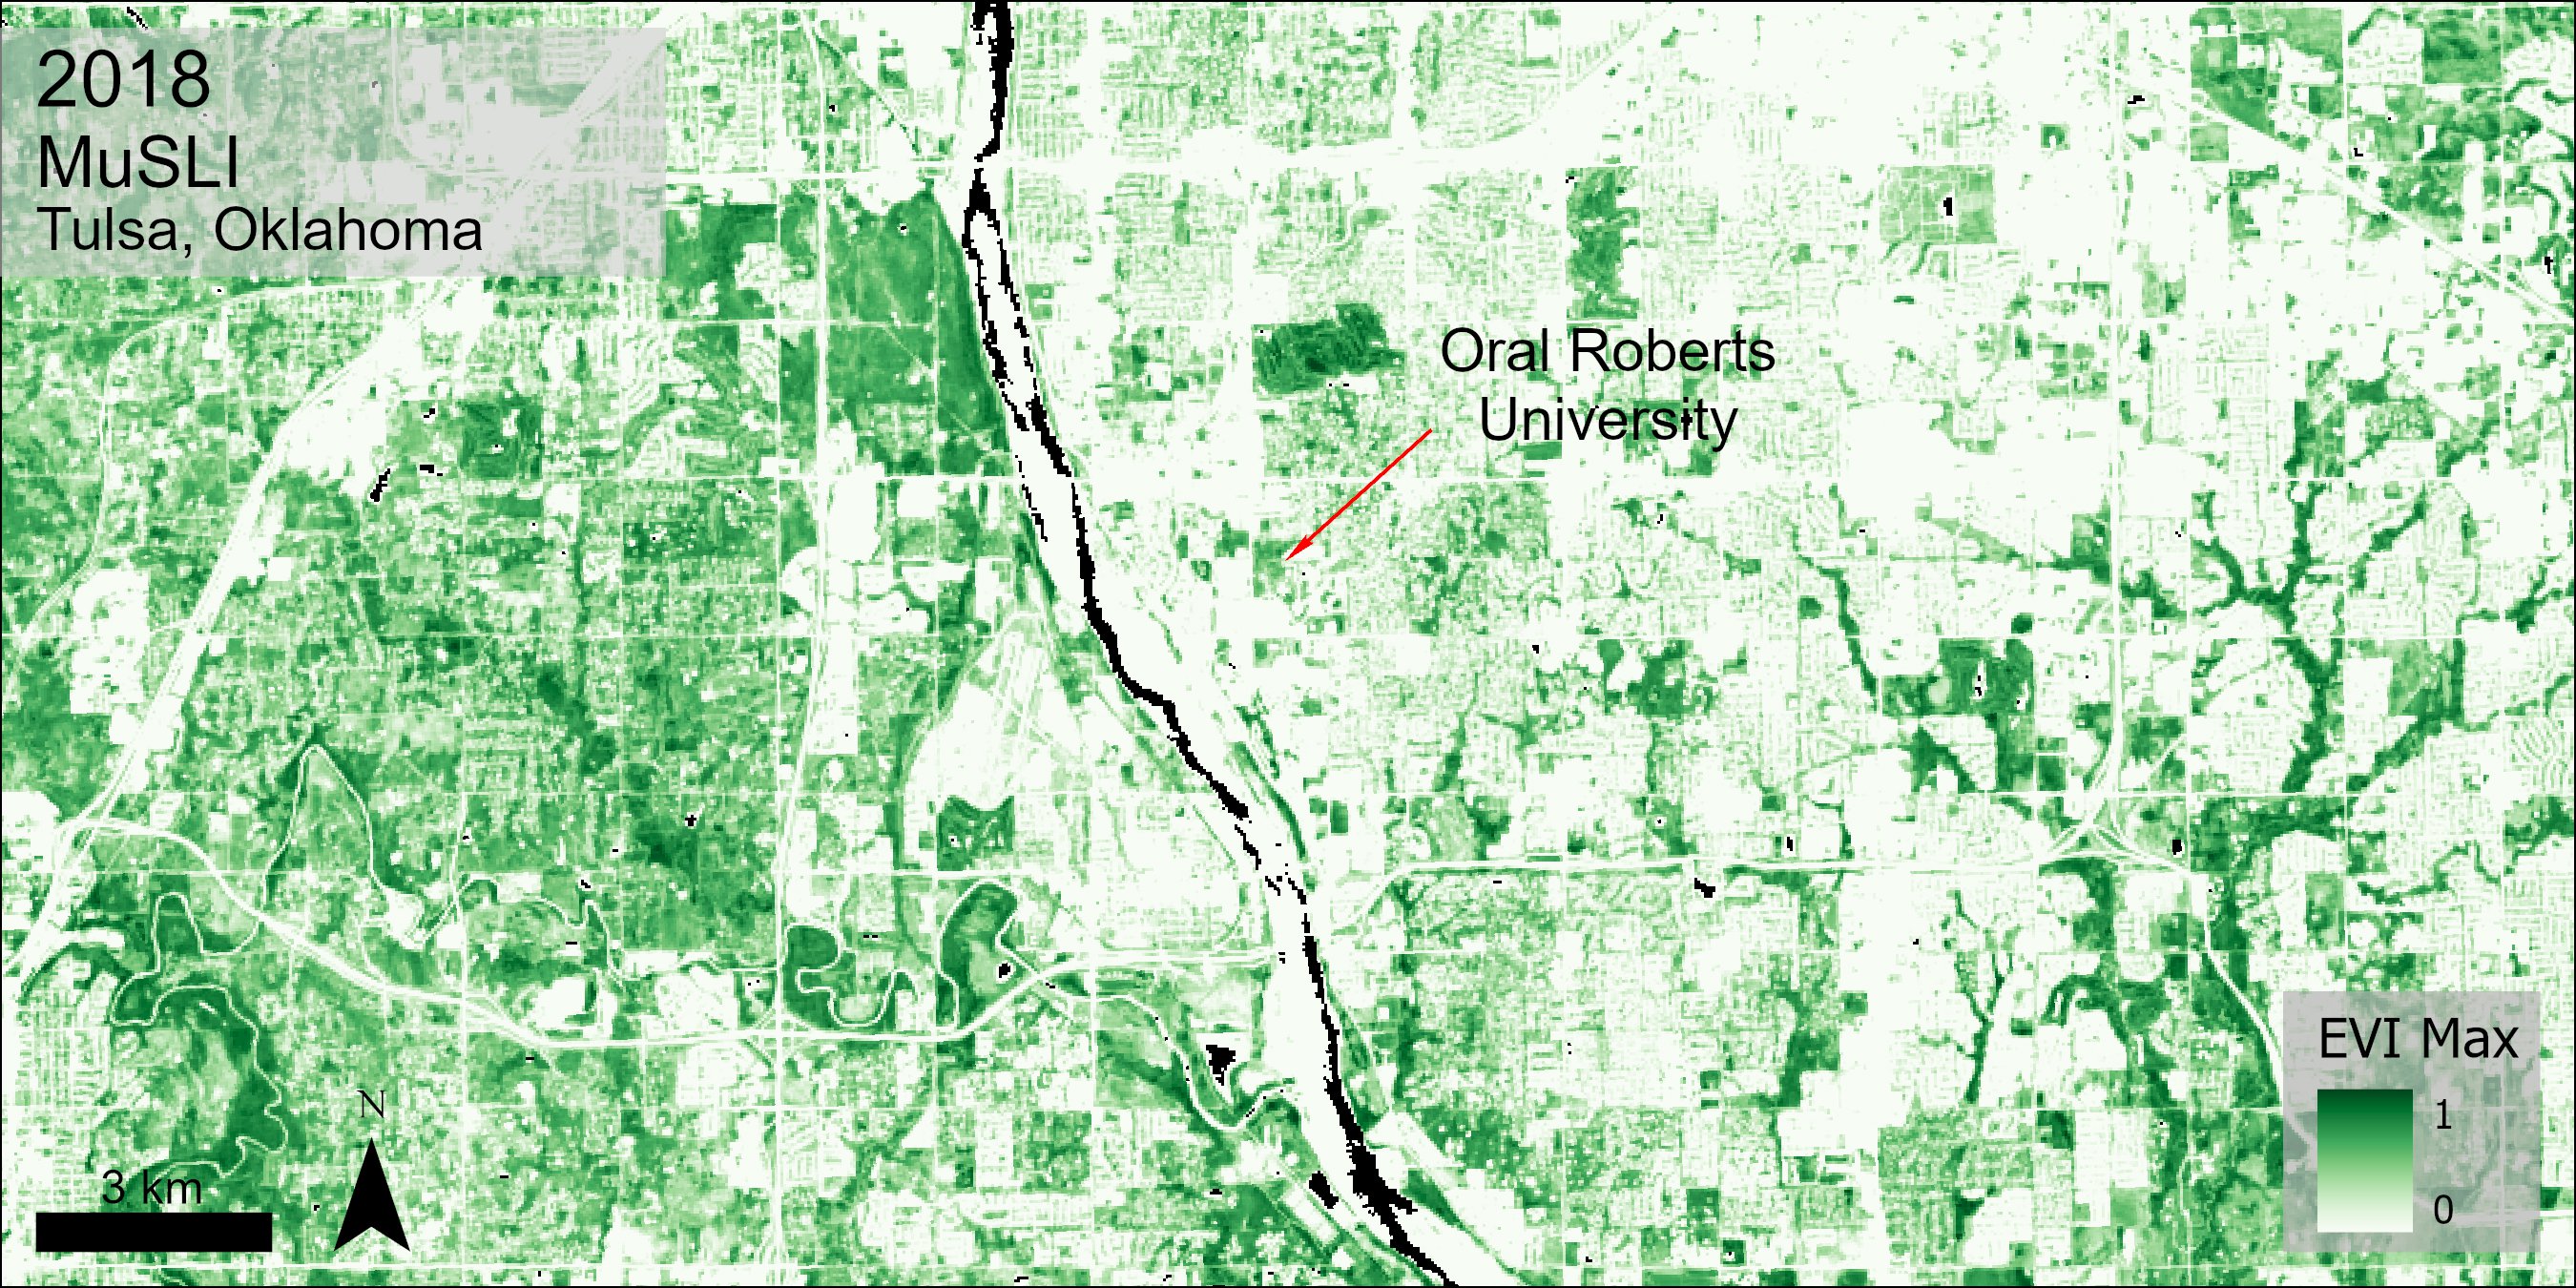
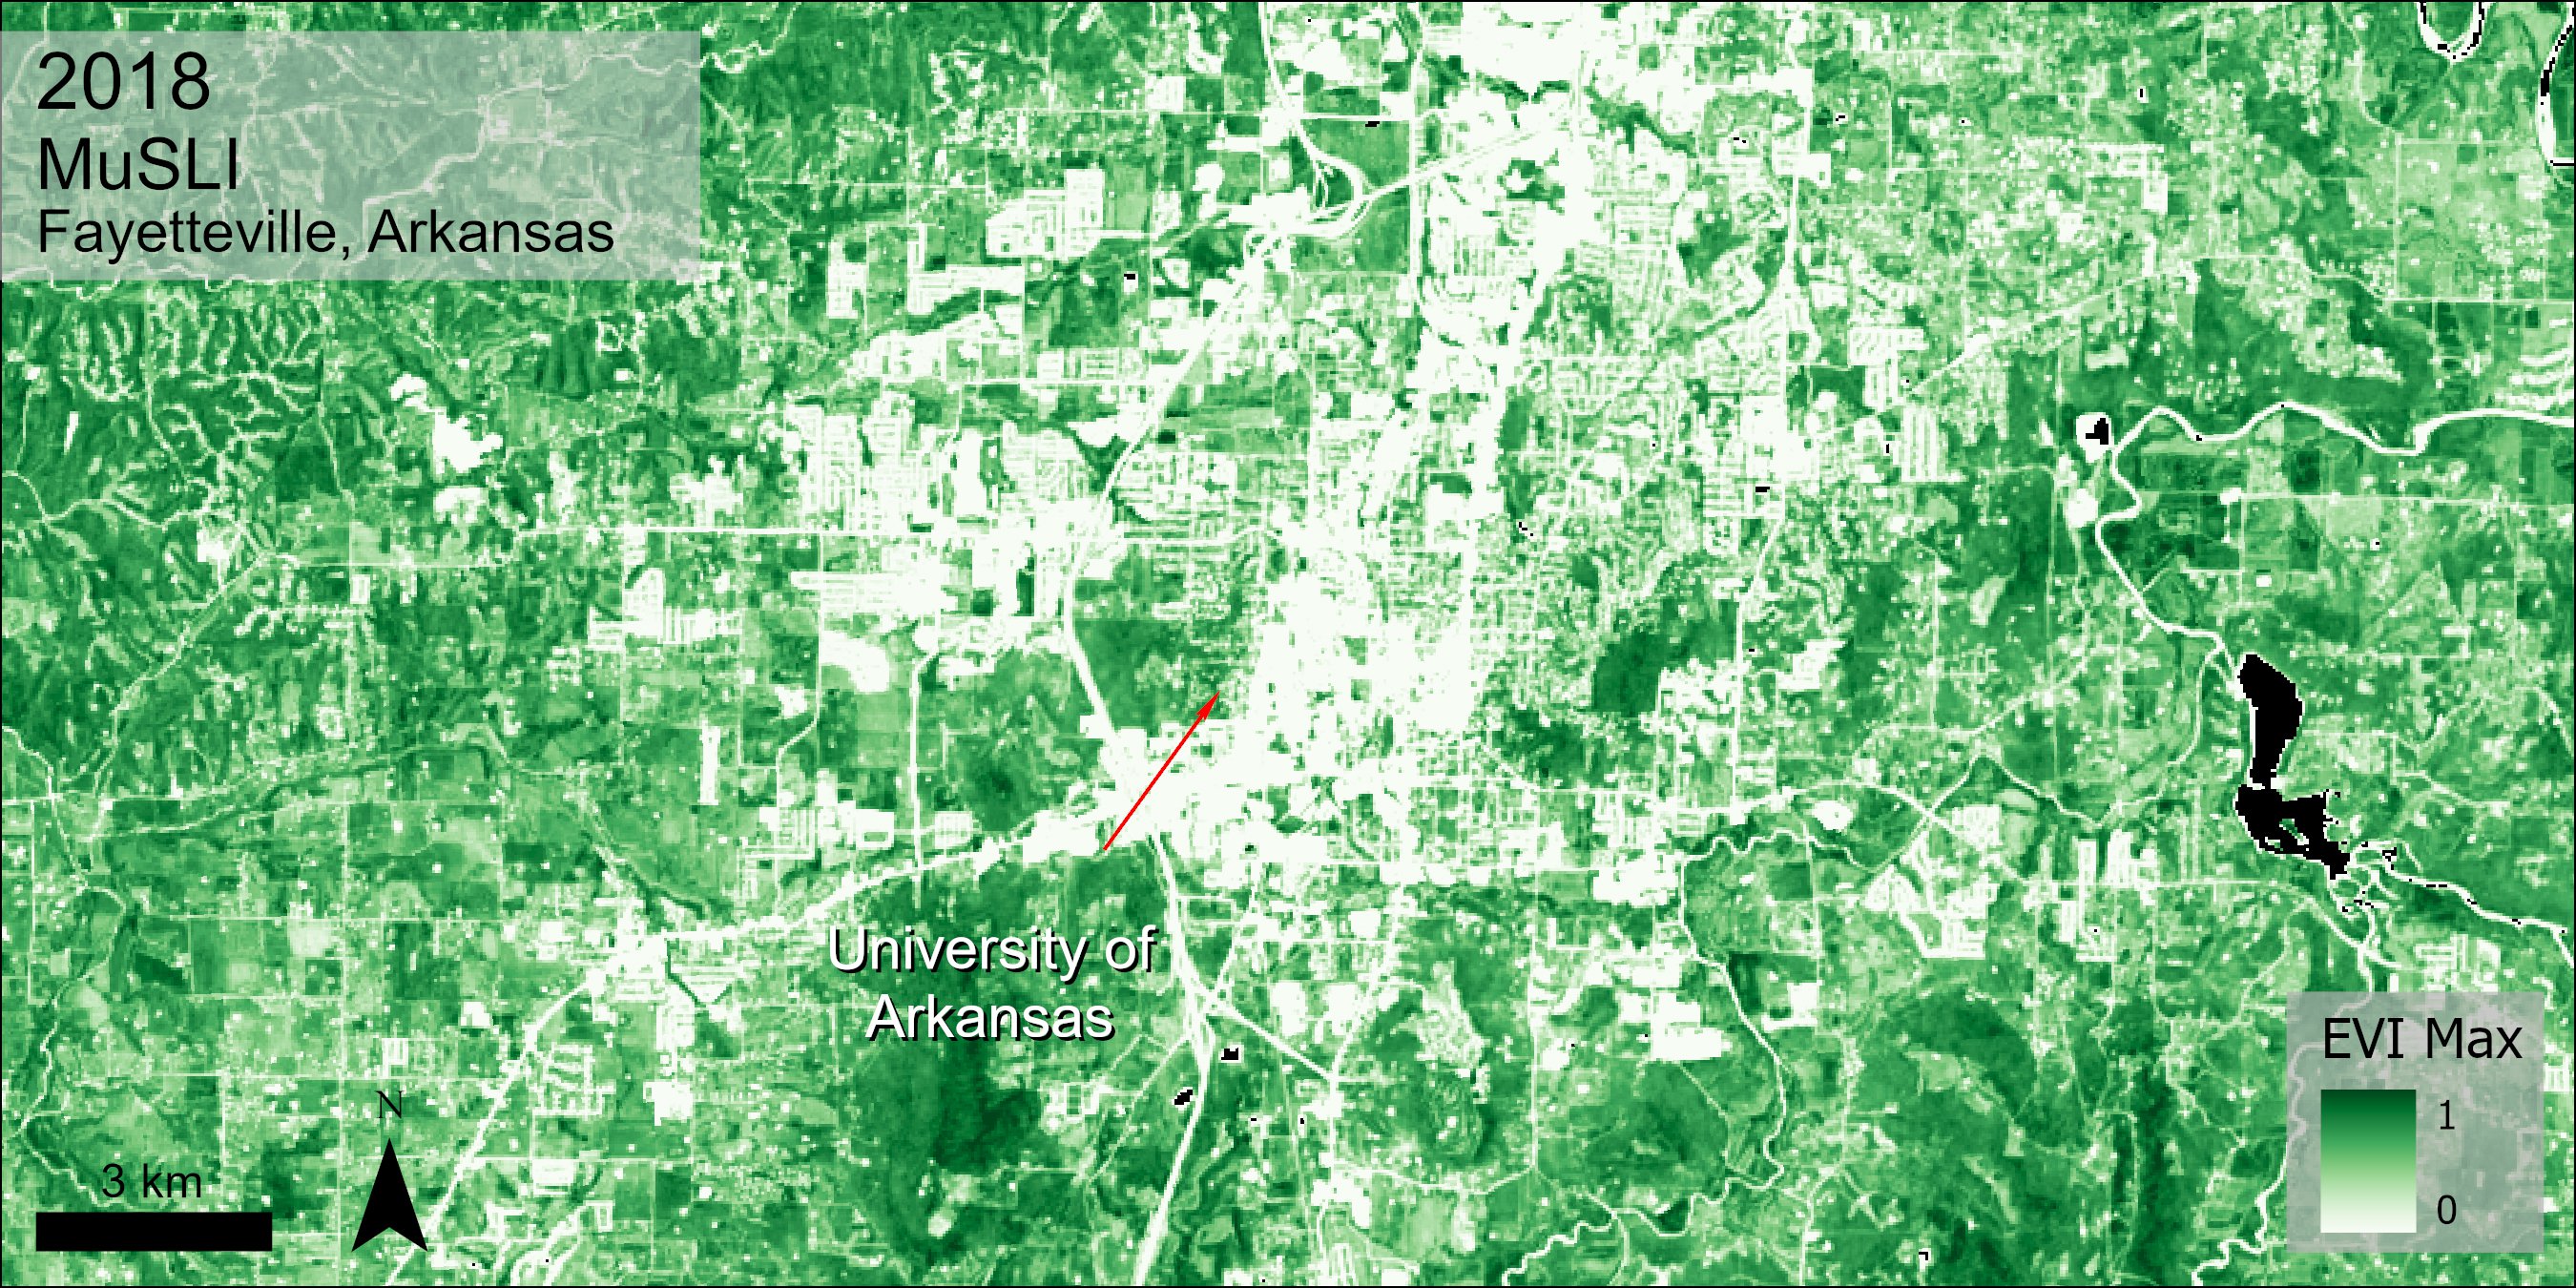
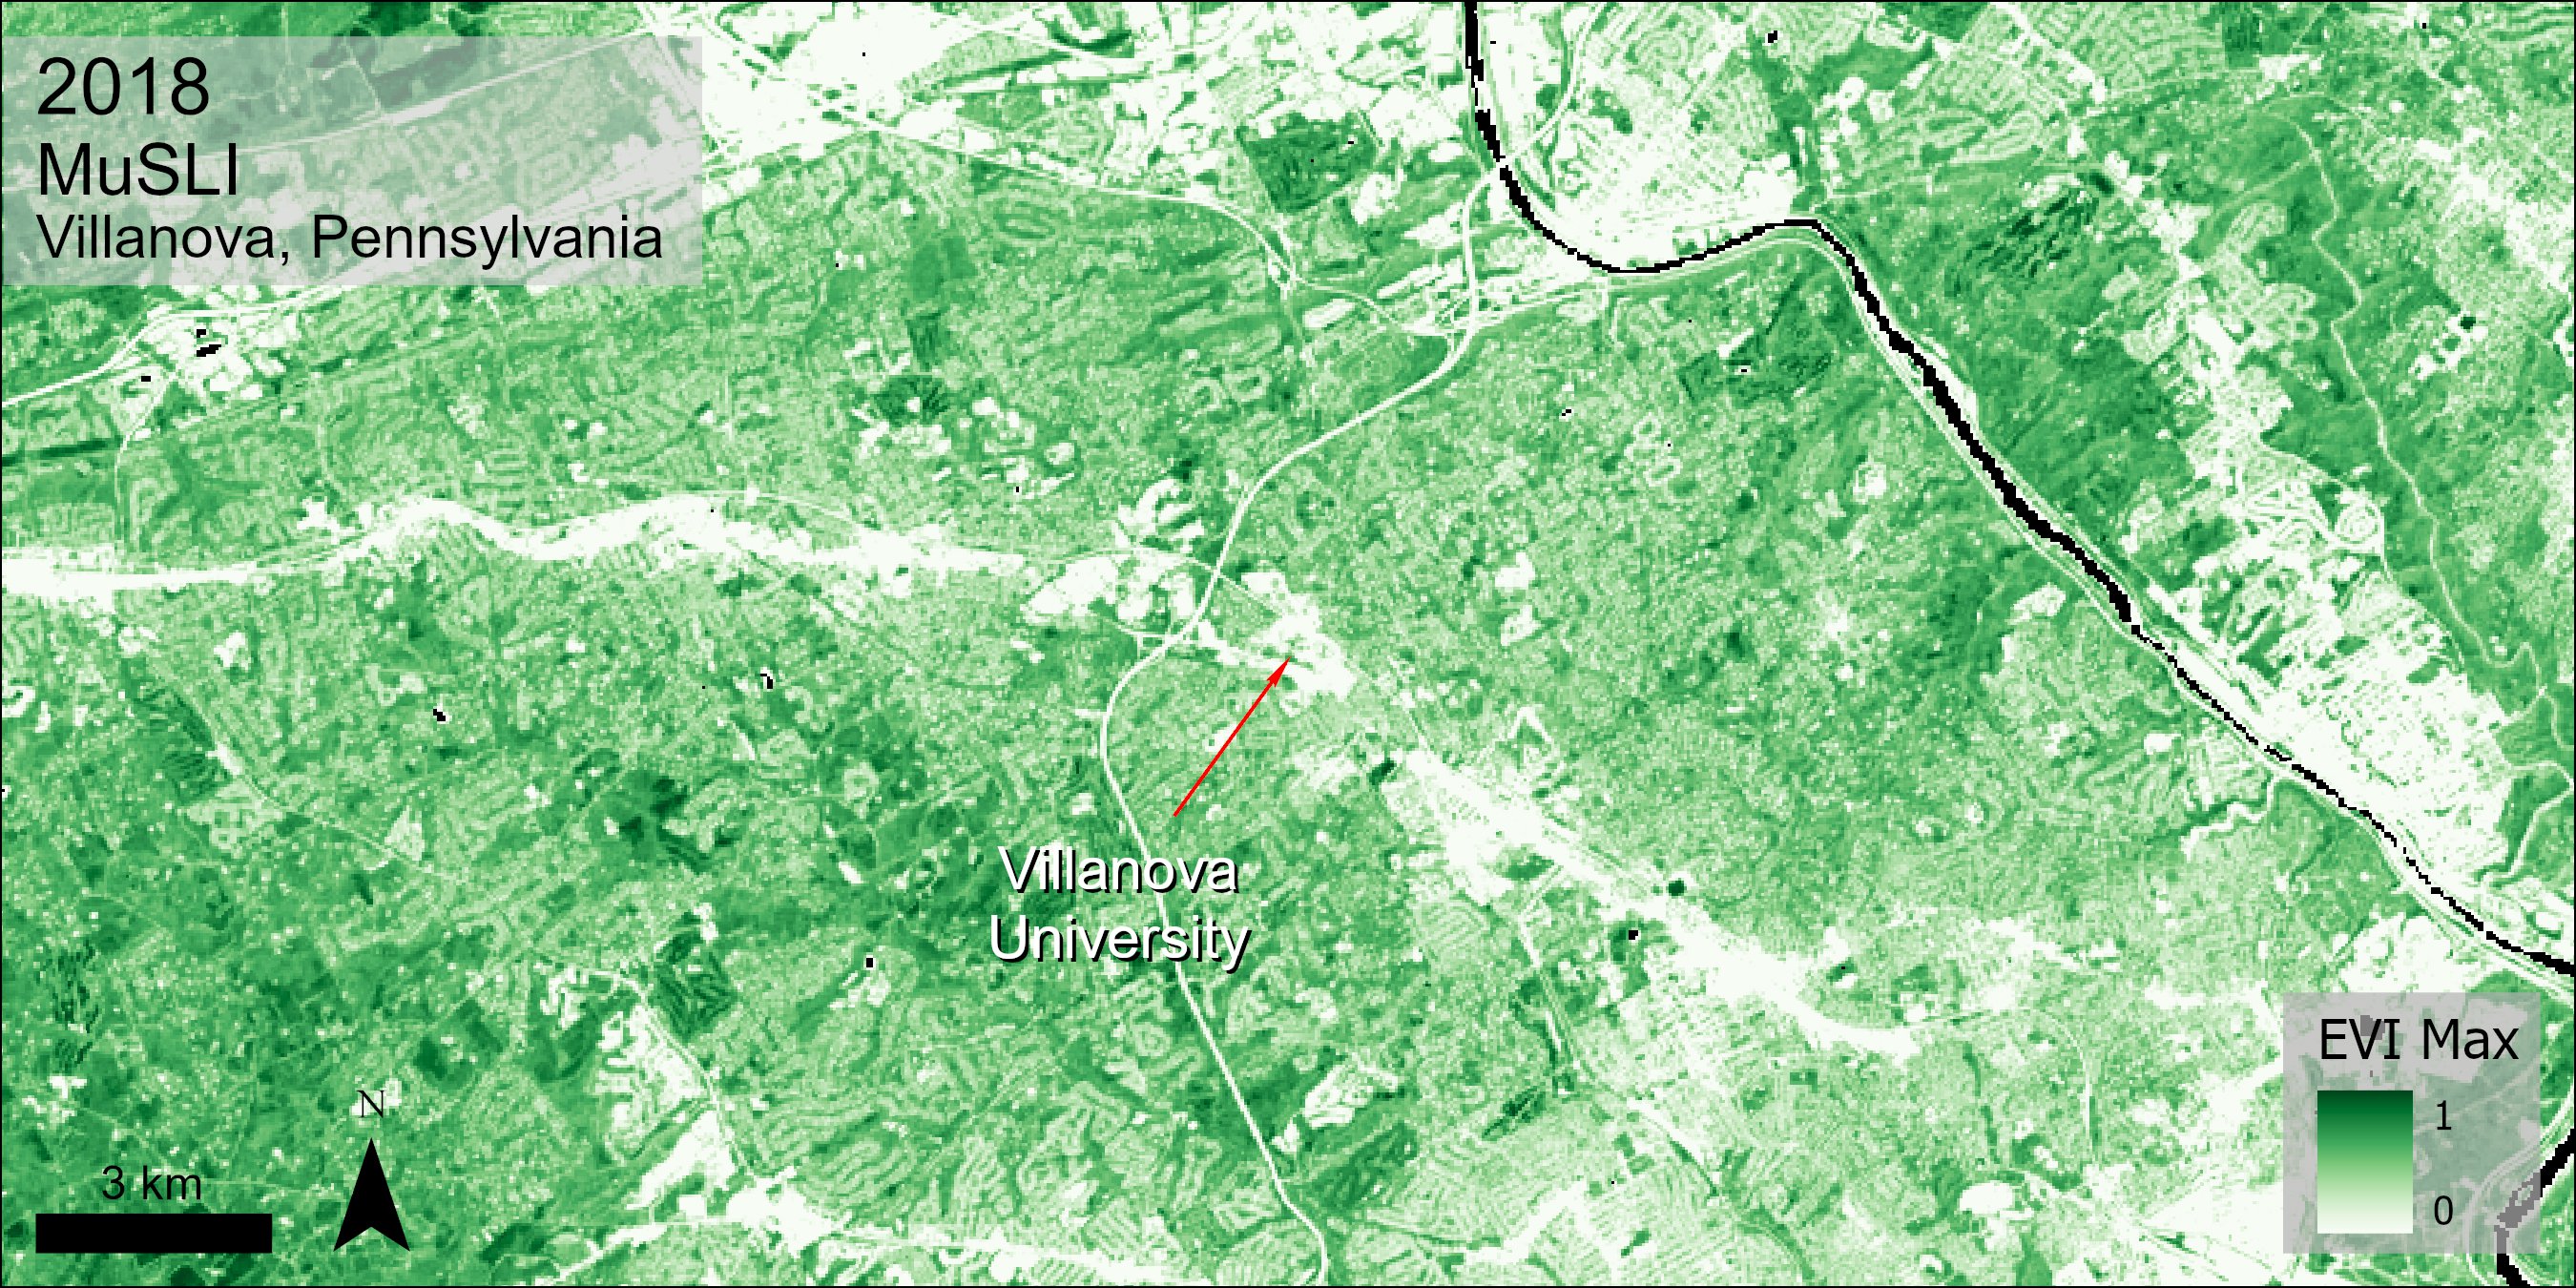
New Annual Multi-Source Land Surface #Phenology (MuSLI) 30 m data product for North America, derived from Harmonized #Landsat #Sentinel-2 data aids in #remotesensing ecosystems over time. Explore MuSLI data at NASA's #LPDAAC: https://t.co/7LCPqf0inq pic.twitter.com/juGz0fXFOG
— NASAEarthdata (@NASAEarthData) June 23, 2020
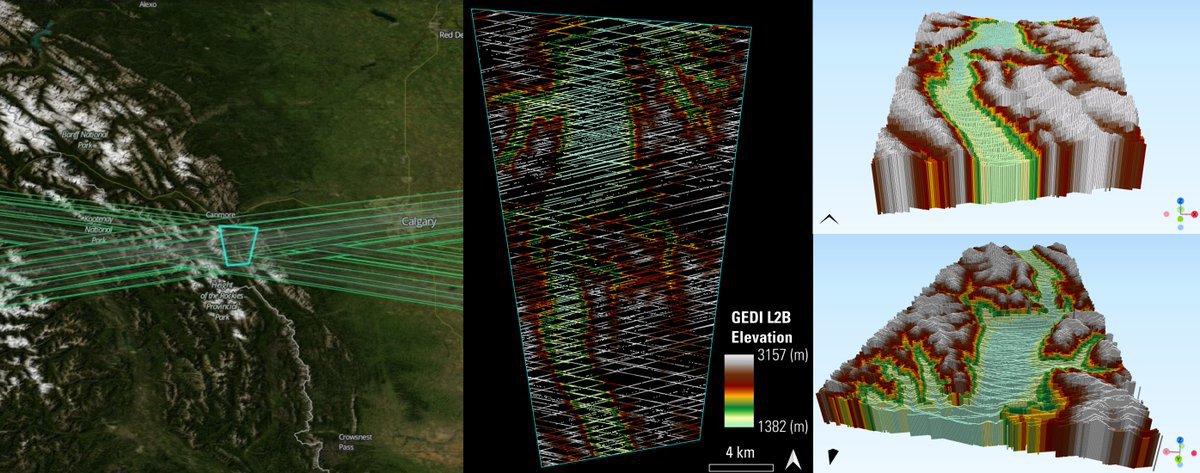
Observe Elevation, Canopy Height, and Plant Area Index over @OlympicNP with the #GEDI Level 2B Canopy Cover and Vertical Profile Metrics global product. Learn about data layers within this GEDI lidar product at NASA #LPDAAC. https://t.co/o2GFV2ohkn, #remotesensing #GEDIVis pic.twitter.com/nHzmBAAPP5
— NASAEarthdata (@NASAEarthData) June 19, 2020
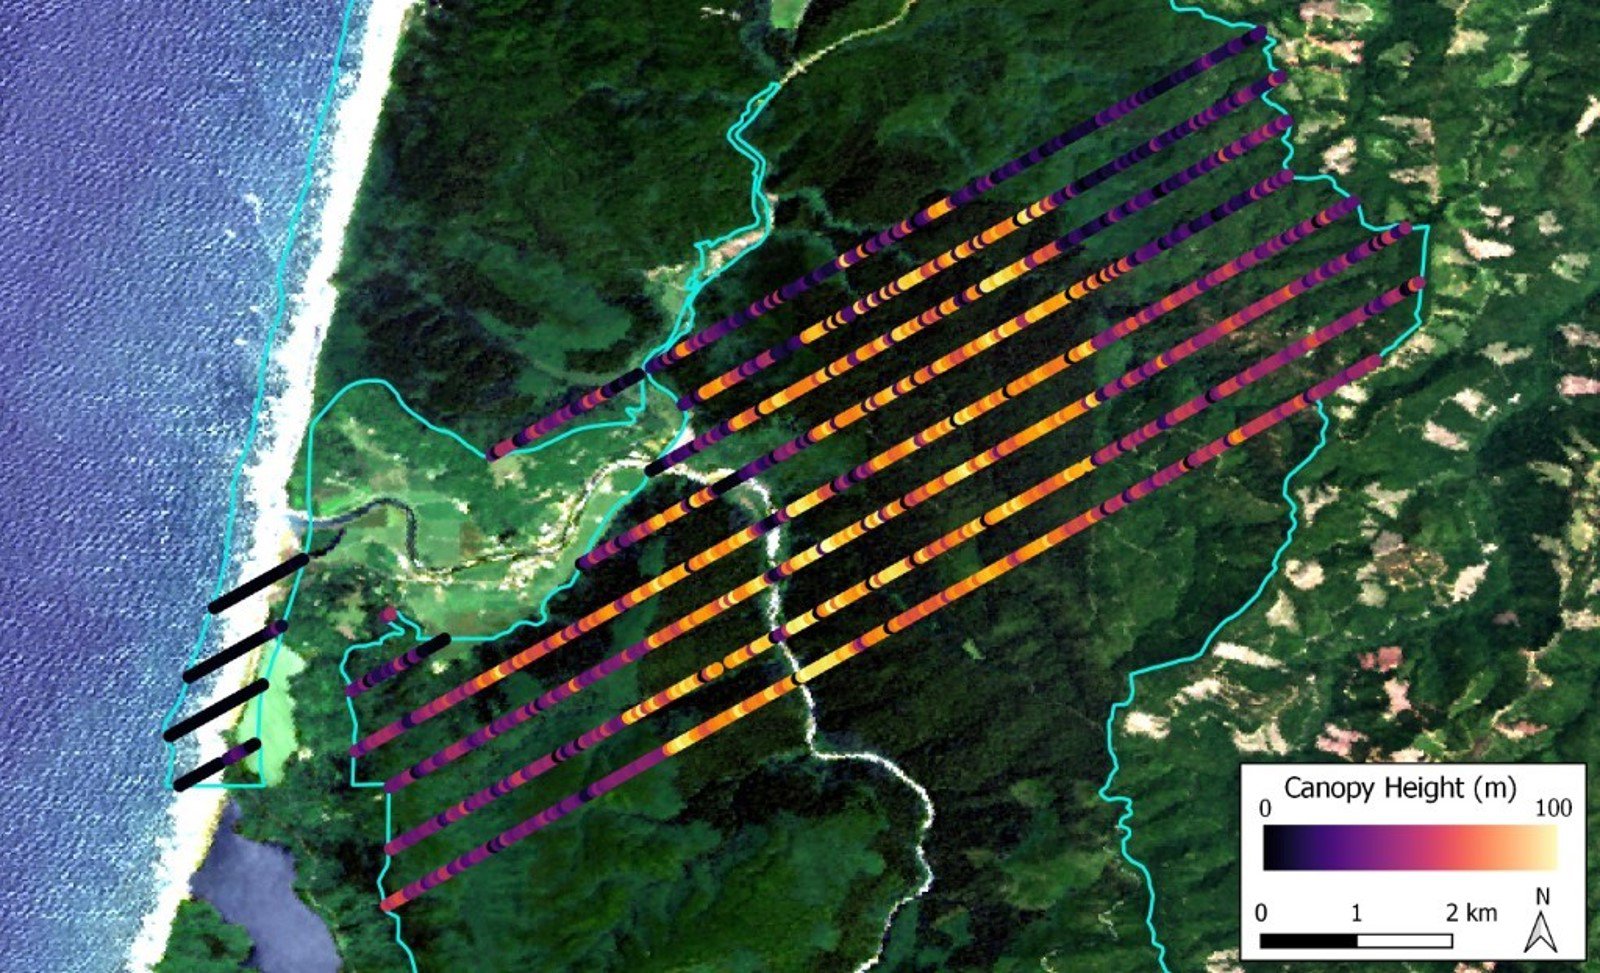
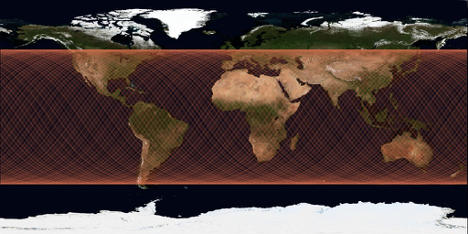
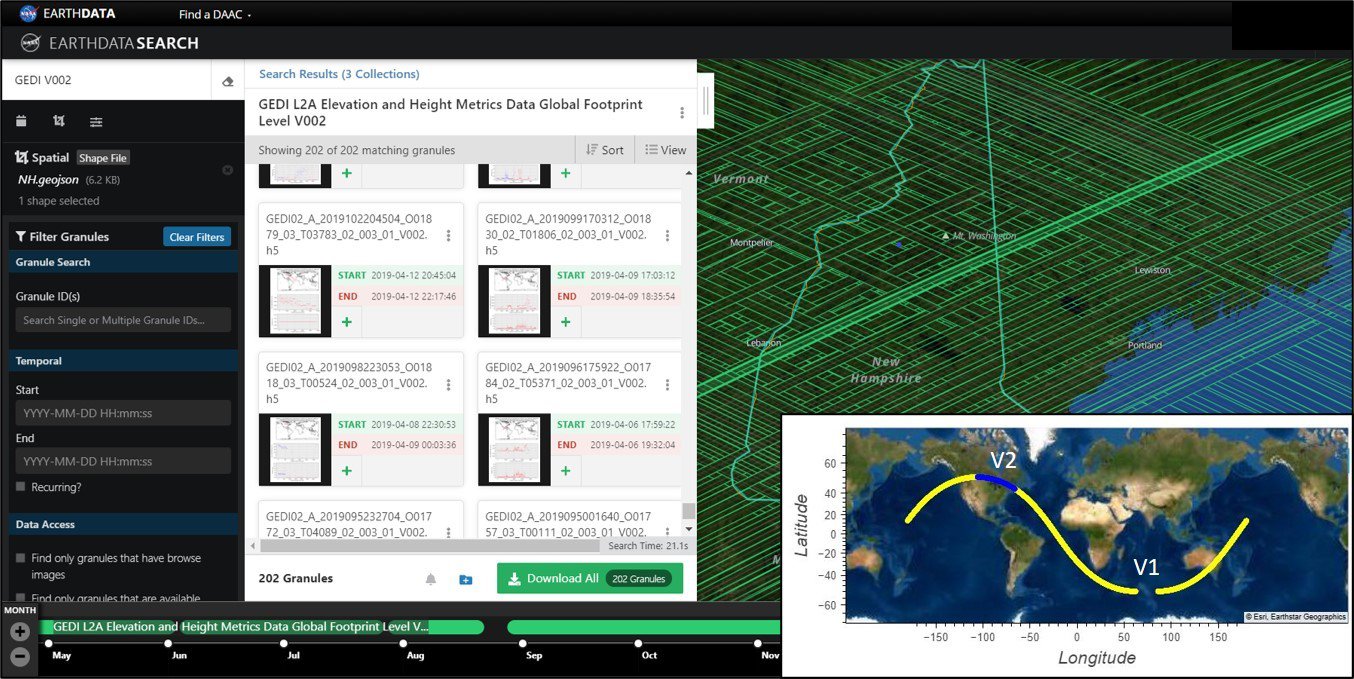
The graphic shows over 700 GEDI orbits from April to June 2019!
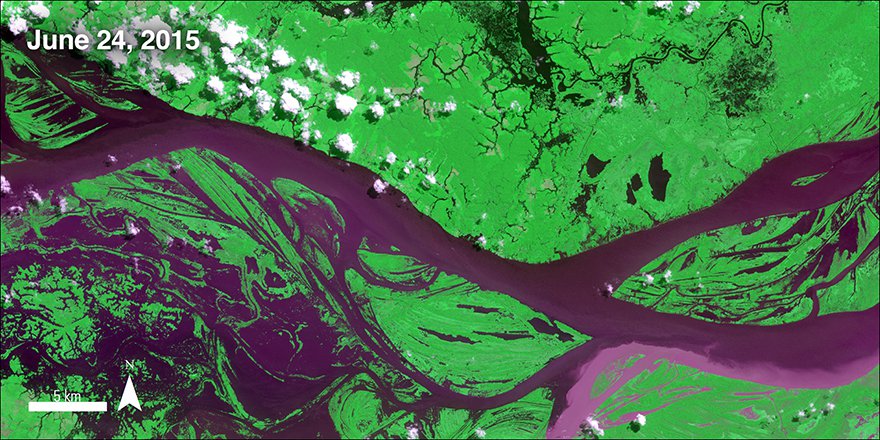
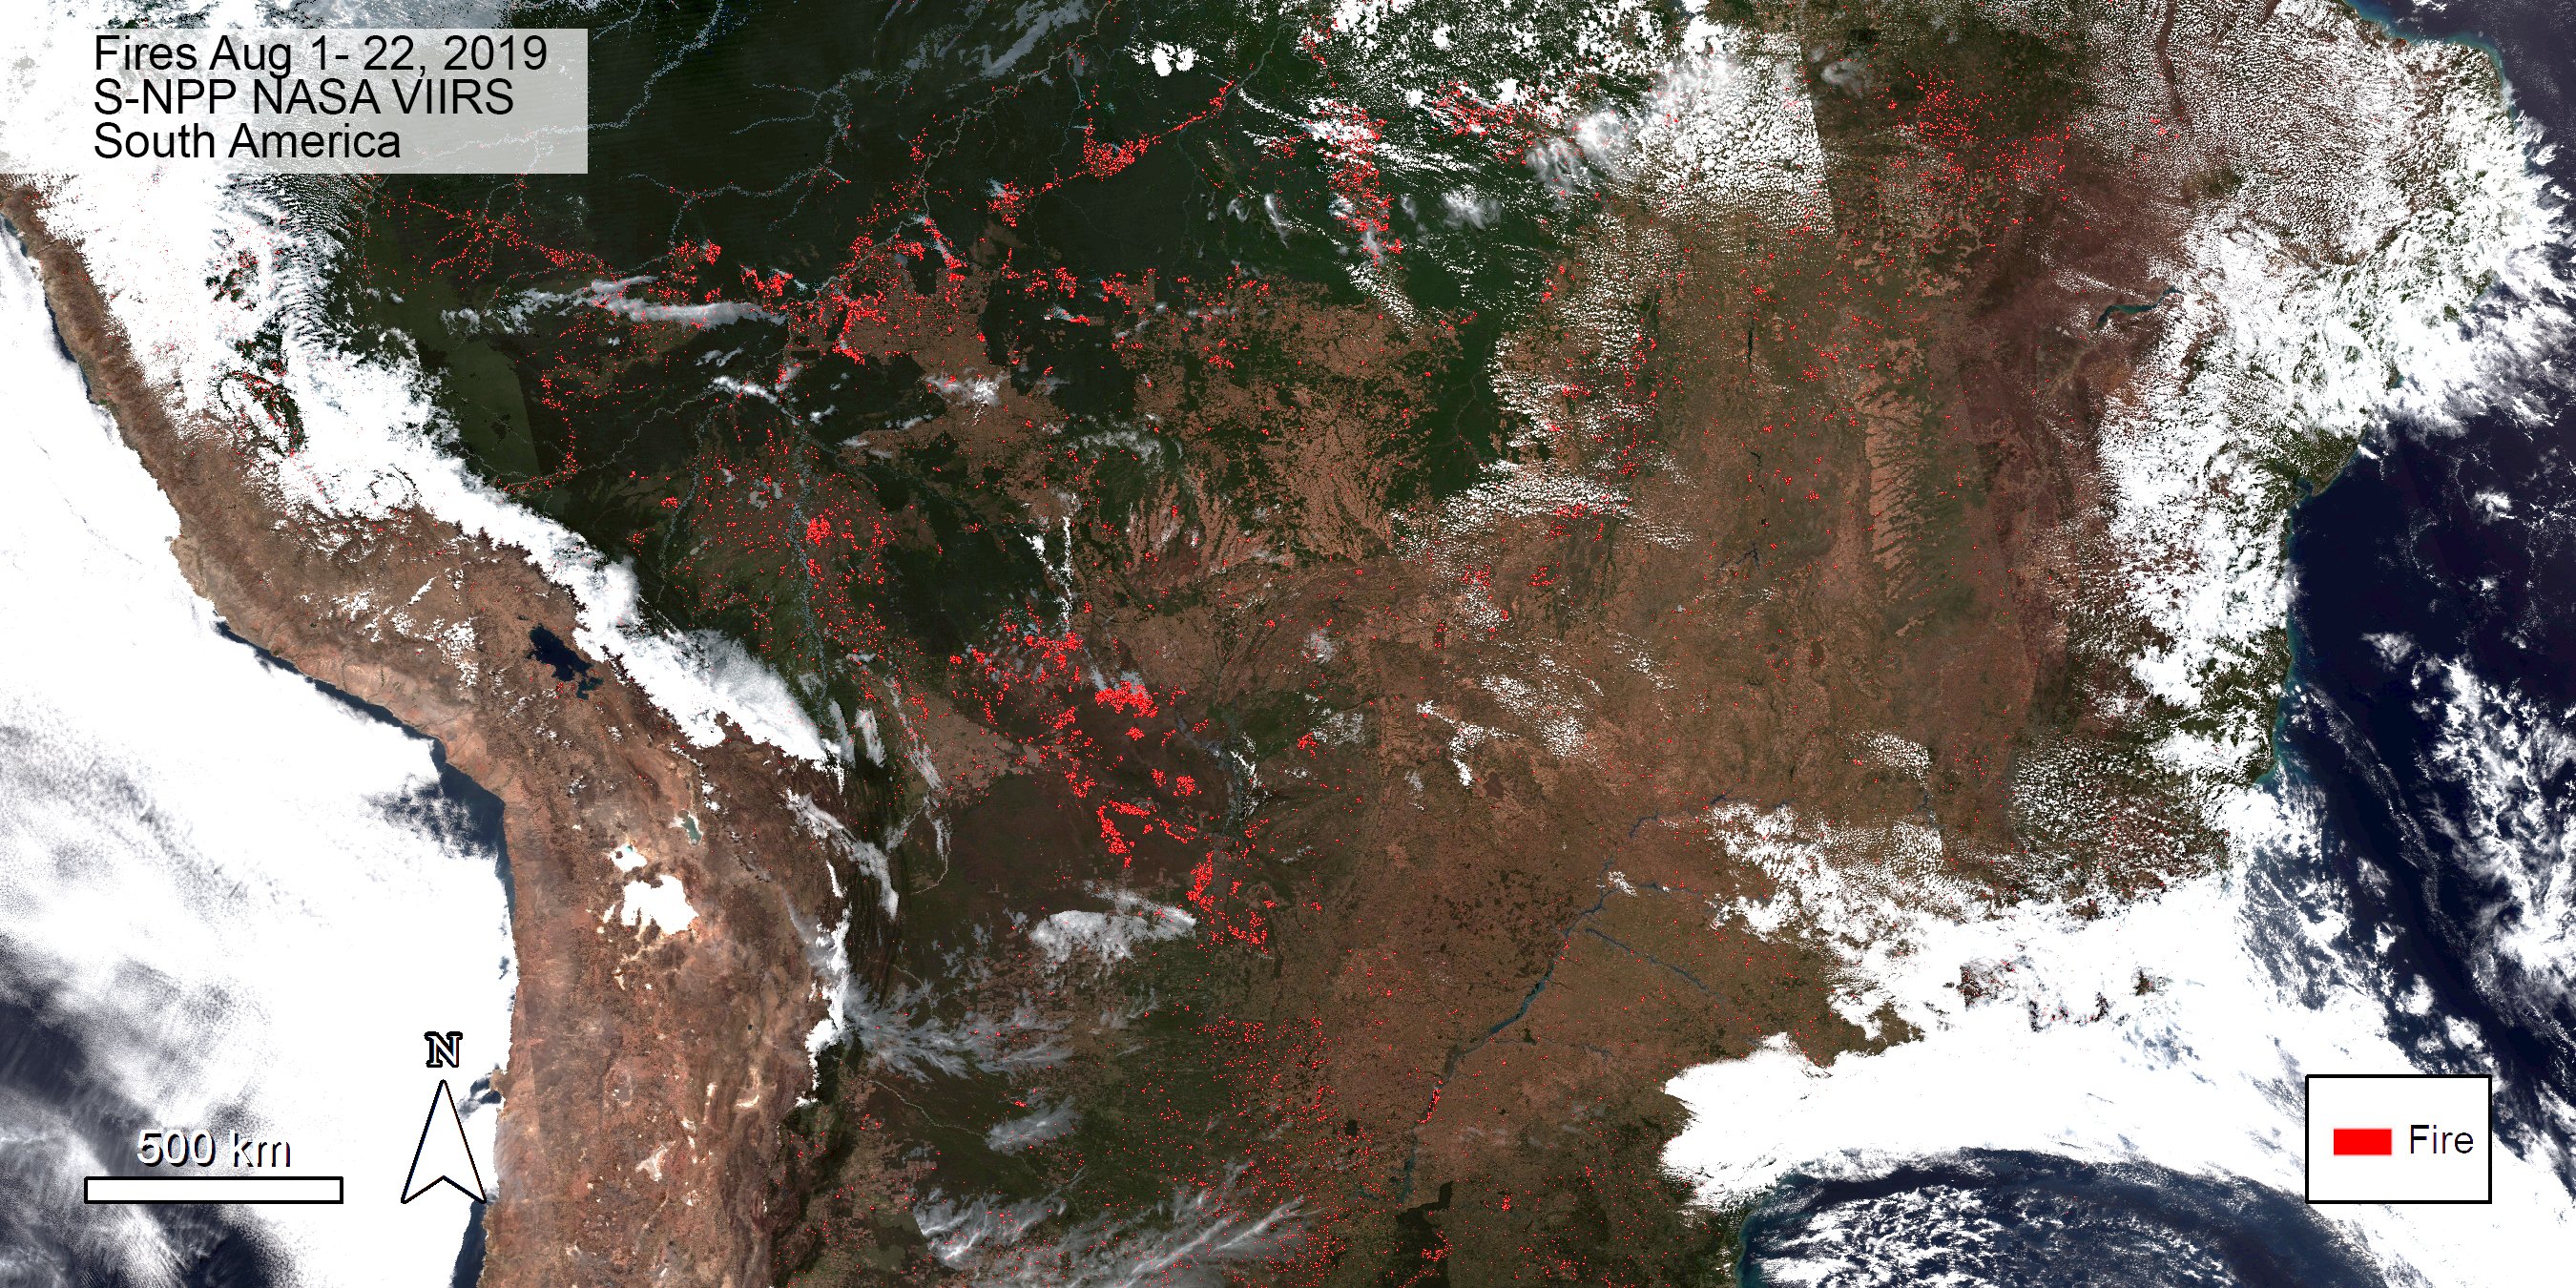
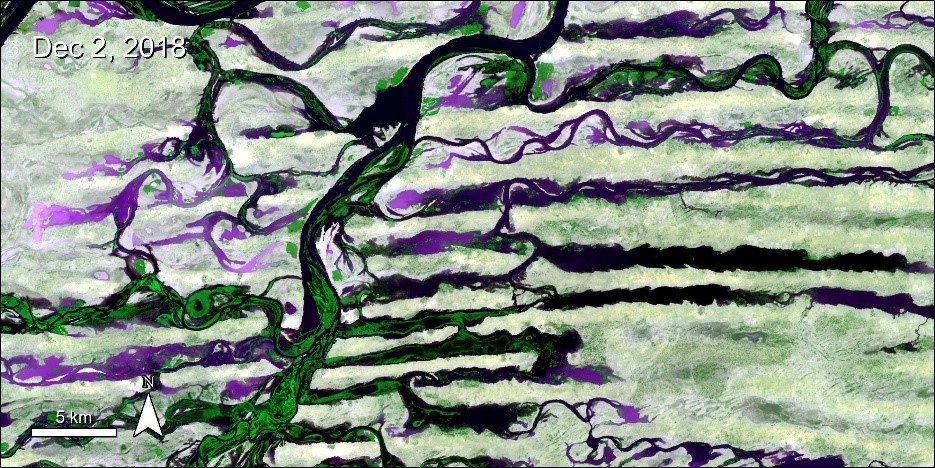
Results of Recent Fires in Brazil as seen by ASTERResults of Recent Fires in Brazil as seen by ASTER Burn scars (black) and smoke (purple) from recent fires are seen in this NASA Terra Advanced Spaceborne Thermal Emission and Reflection Radiometer (ASTER) animation showing the Brazilian state of Mato Grosso acquired on September 4, 2019. Compare what the area looked like on May 31st of this year with the the imagery acquired on September 4. Learn more about the NASA Land Processes Distributed Active Archive Center (LP DAAC) ASTER Precision Terrain Corrected data used in this animation: http://bit.ly/2m1sluN
Posted by NASA Earthdata on Thursday, September 26, 2019
Tengger Desert Solar Park, ChinaTengger Desert Solar Park, China Observe the construction of the Tengger Desert Solar Park, currently the largest photovoltaic power plant in the world, through the “eye” of the Terra Advanced Spaceborne Thermal Emission and Reflection Radiometer (ASTER) satellite sensor. This solar park, located in Zhongwei, Ningxia, China, is nicknamed the “Great Wall of Solar”. It covers 42 square kilometers worth of land and generates ~1,500 megawatt (mw) per year. Learn more about the NASA data used to create this image by visiting the Land Processes Distributed Active Archive Center (LP DAAC) website: http://bit.ly/2pwxIkr NASA's LP DAAC is one of the Earth Observing System Data and Information System (EOSDIS) DAACs that manage, archive and distribute Earth science data as part of the Earth Science Data Systems Program.
Posted by NASA Earthdata on Friday, May 24, 2019

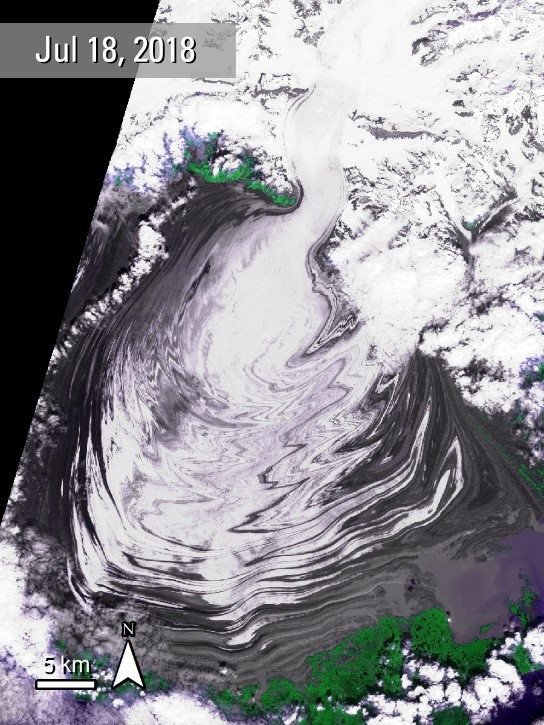
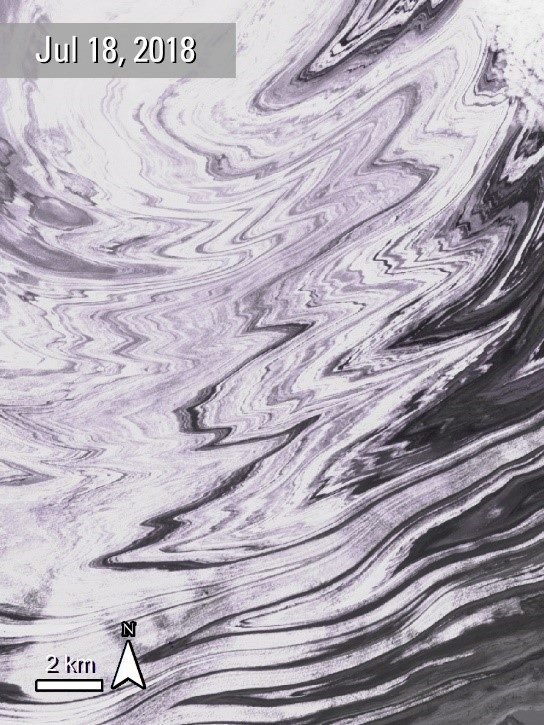
Changes in the Brunt Ice Shelf, Antarctica (2001-2019)Changes in the Brunt Ice Shelf, Antarctica (2001-2019 Did you hear the news? Cracks growing over the Brunt Ice Shelf are poised to break a large iceberg, more than twice the size of New York City, off into the Weddell Sea. In this animation, data from the Advanced Spaceborne Thermal Emission and Reflection Radiometer (ASTER) instrument, aboard the Terra spacecraft, has been used to highlight some of these changes over time. To learn about the terrain-corrected ASTER data used in this animation, please visit NASA's Land Processes Distributed Active Archive Center (LP DAAC):http://bit.ly/2C2oNgz LP DAAC is one of NASA's Earth Observing System Data and Information System (EOSDIS) DAACs that manage, archive and distribute Earth science data as part of the Earth Science Data Systems Program (ESDS). To learn more about the ESDS Program and EOSDIS data, information, services and tools: https://earthdata.nasa.gov
Posted by NASA Earthdata on Wednesday, March 6, 2019

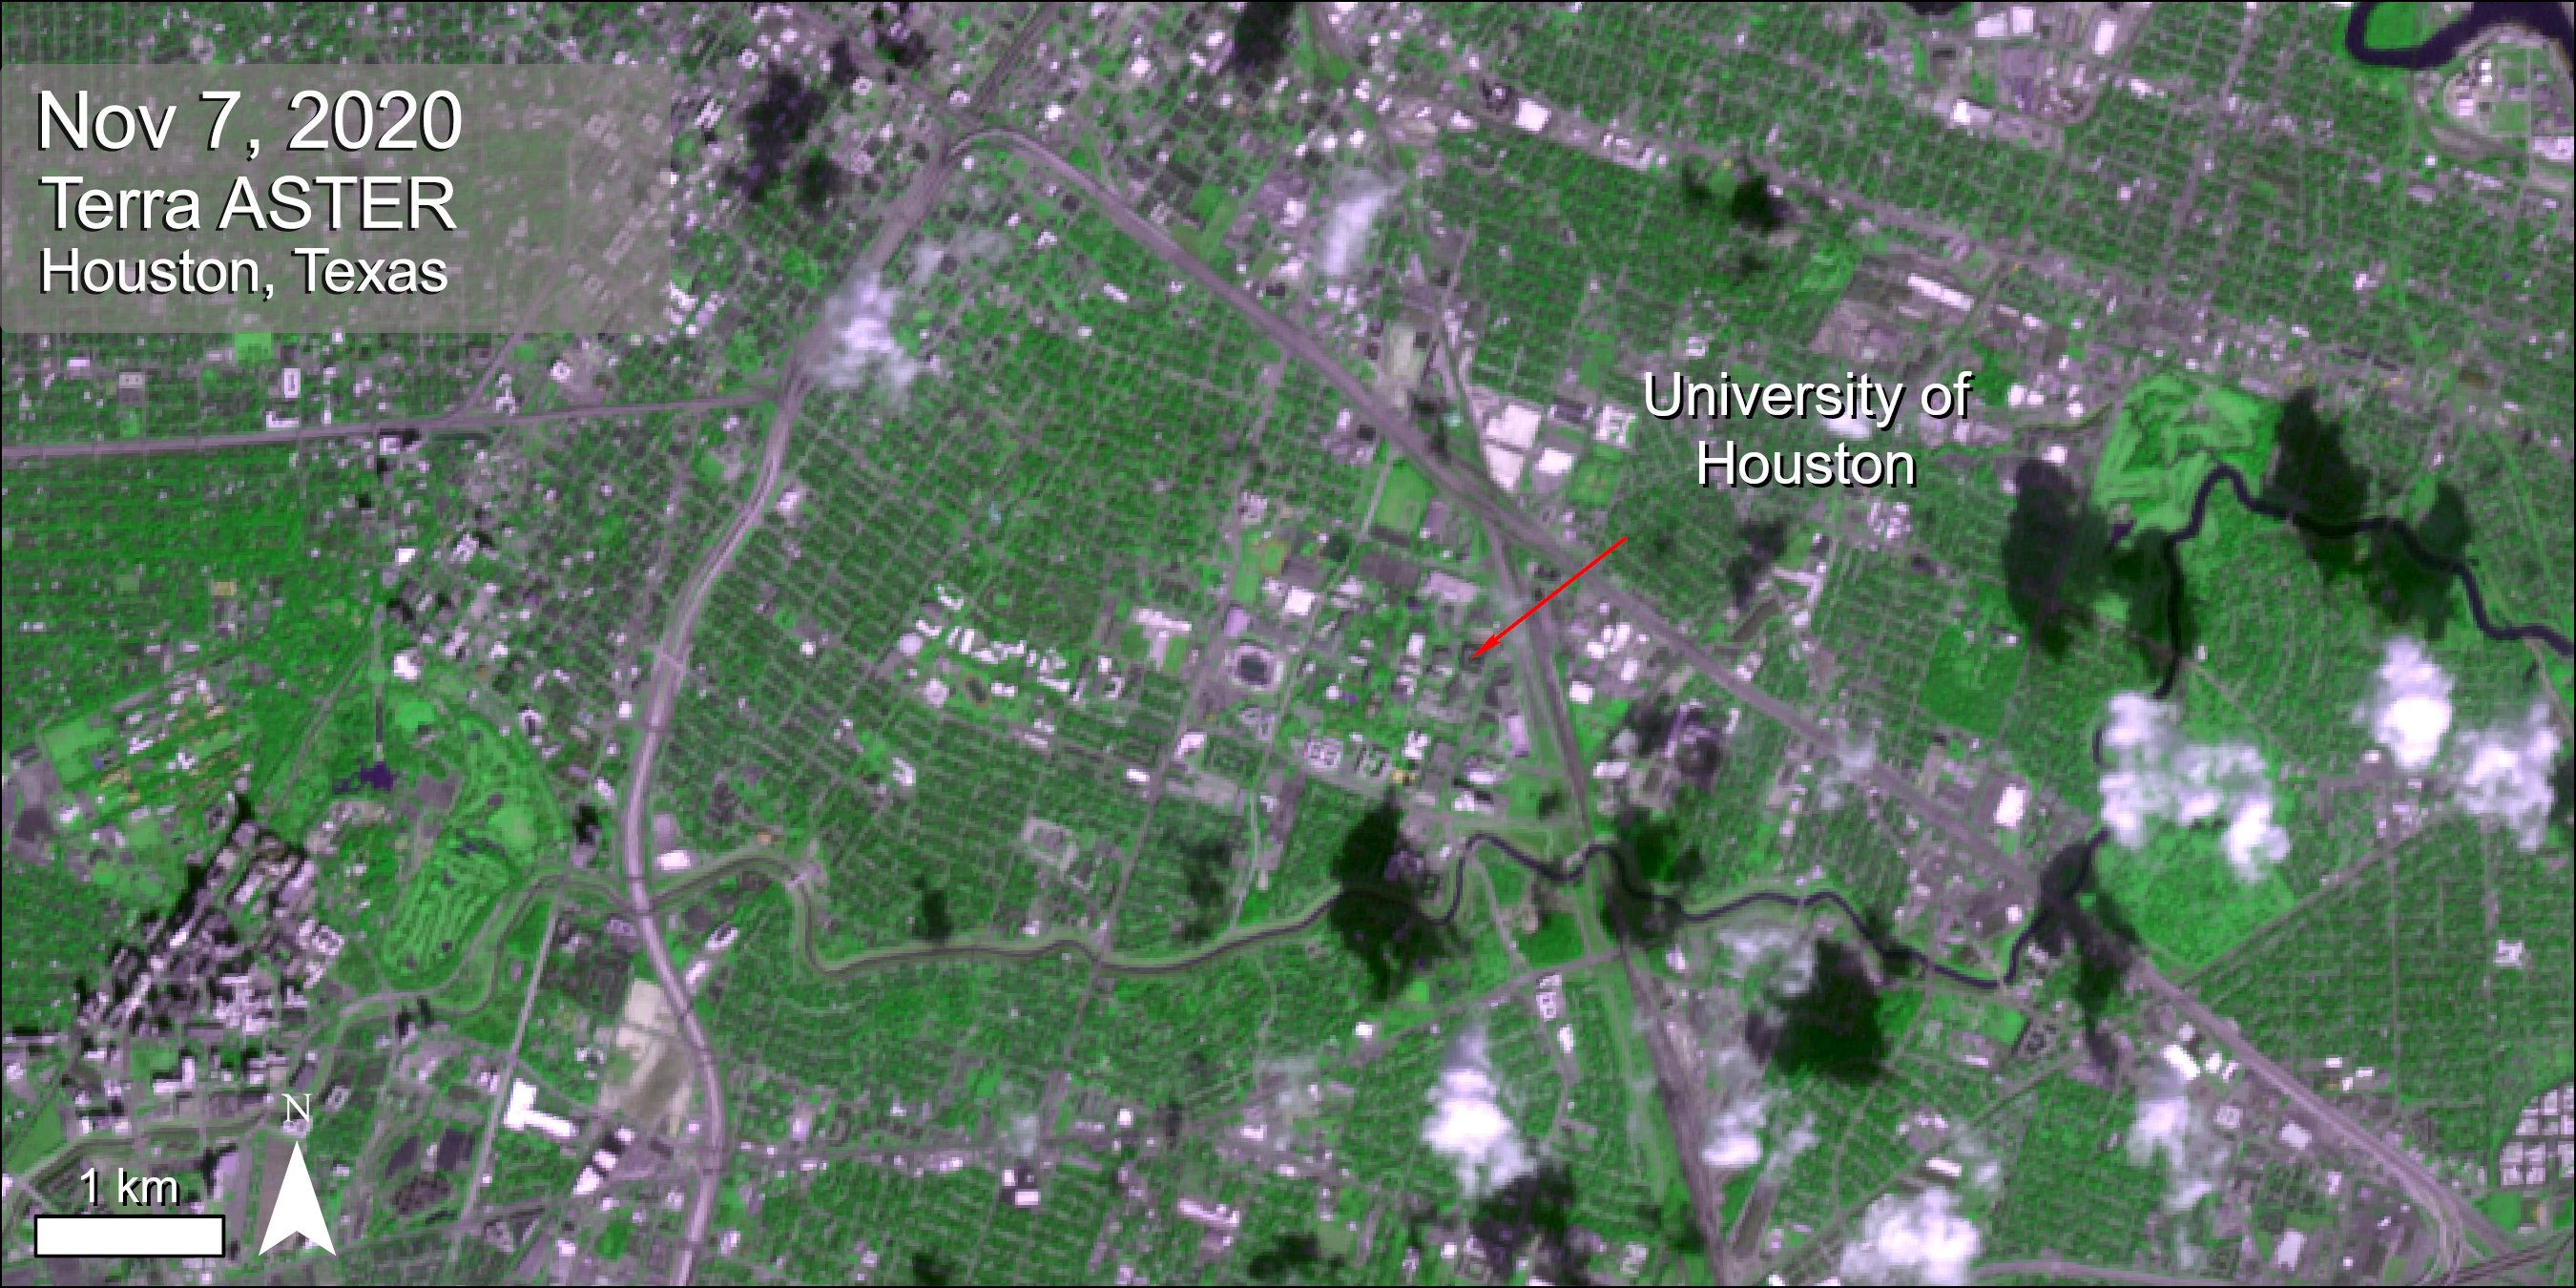
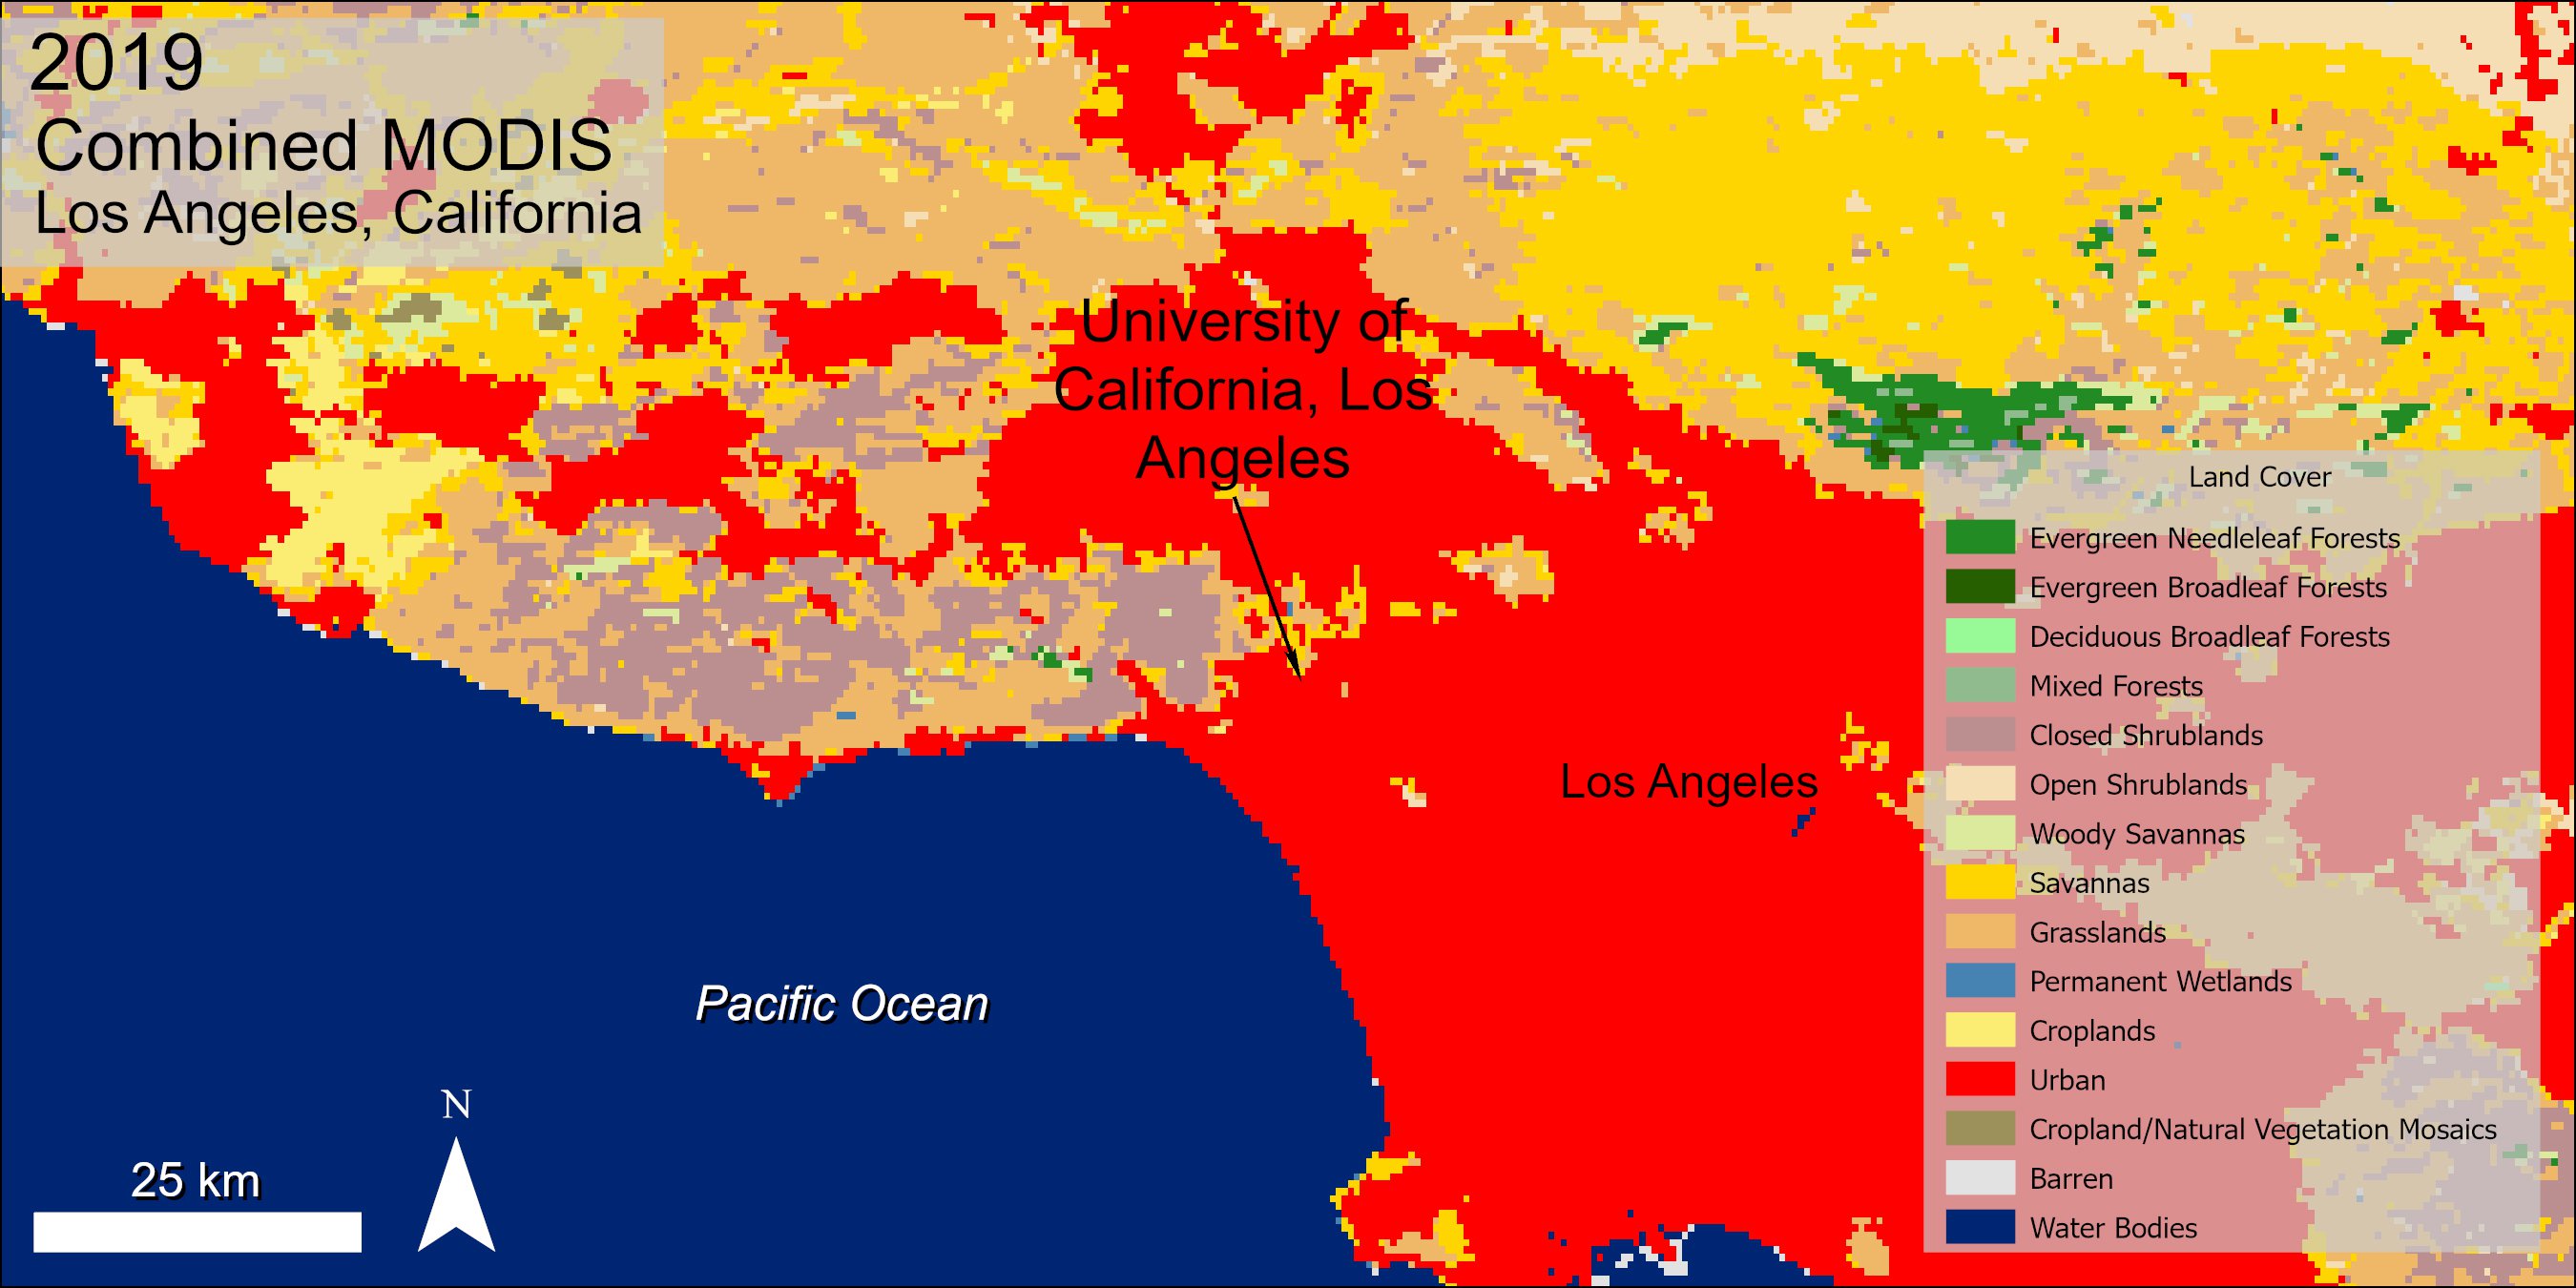
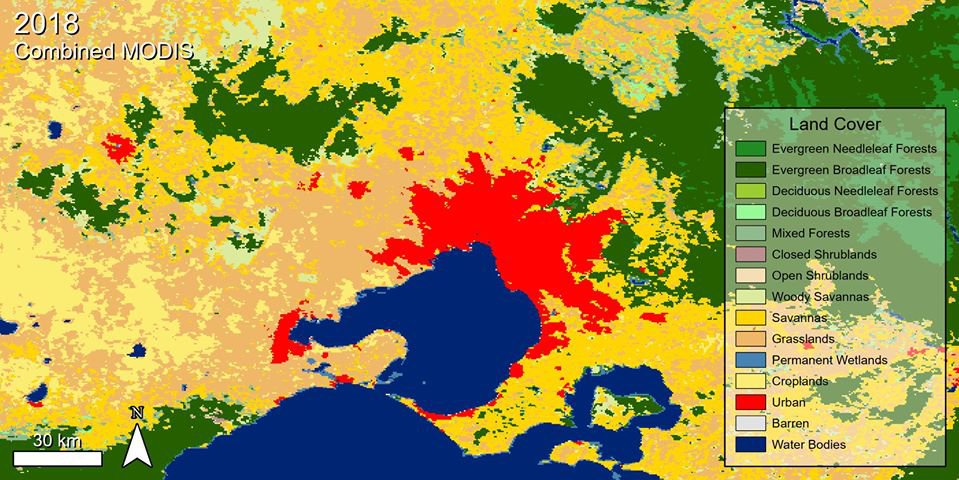
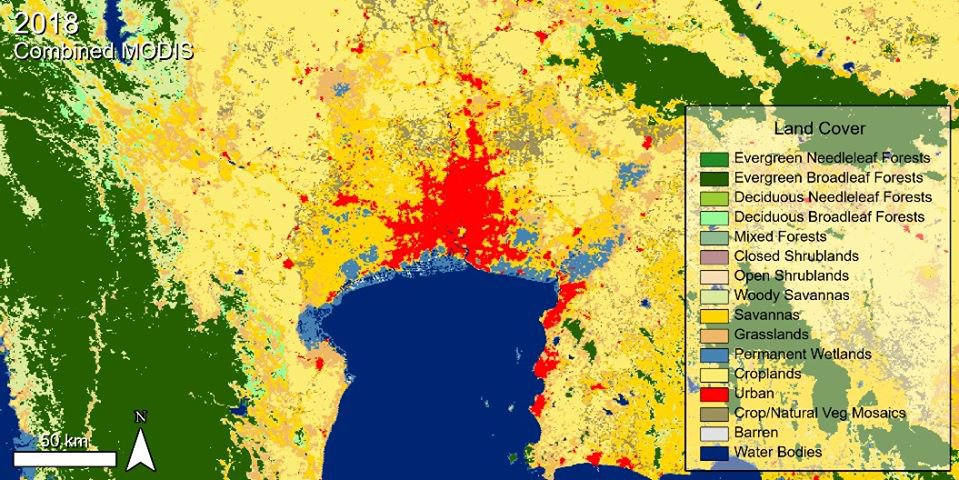
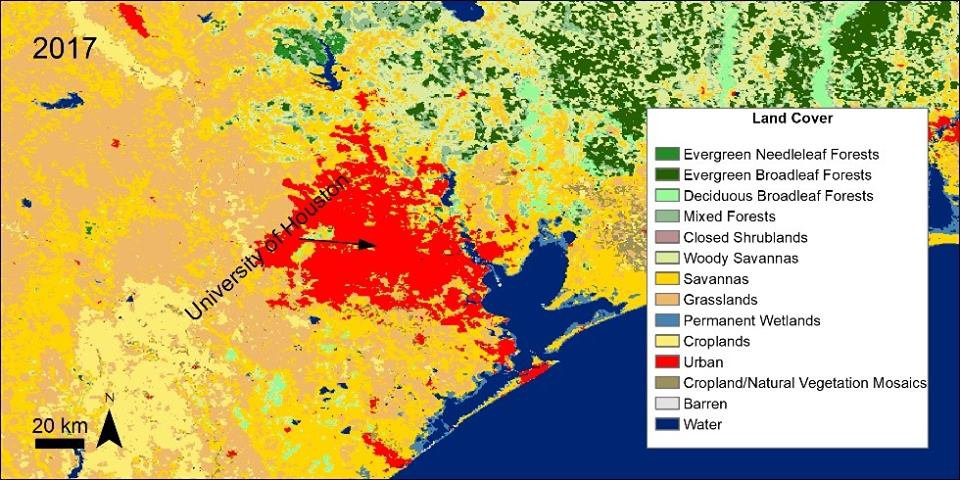
Land Cover Change in Houston, Texas (2001-2016)Urban Growth in Houston, TX (2001-2016) Houston, Texas is one of the most populous cities in the United States. Observe the increase of urban and built up areas, shown in this animation as red, from 2001 to 2016, using the Terra and Aqua Combined MODIS Version 6 Land Cover data product. The last image in the animation is a Terra MODIS surface reflectance image that provides a recent view of Houston. Learn more about the NASA data used to create this data image by visiting the LP DAAC website. http://bit.ly/2Og4gsM NASA's Land Processes Distributed Active Archive Center (LP DAAC) is one of the Earth Observing System Data and Information System (EOSDIS) DAACs that manage, archive and distribute Earth science data as part of the Earth Science Data Systems Program. To discover and access NASA EOSDIS data, information, services and tools: https://earthdata.nasa.gov
Posted by NASA Earthdata on Monday, August 6, 2018
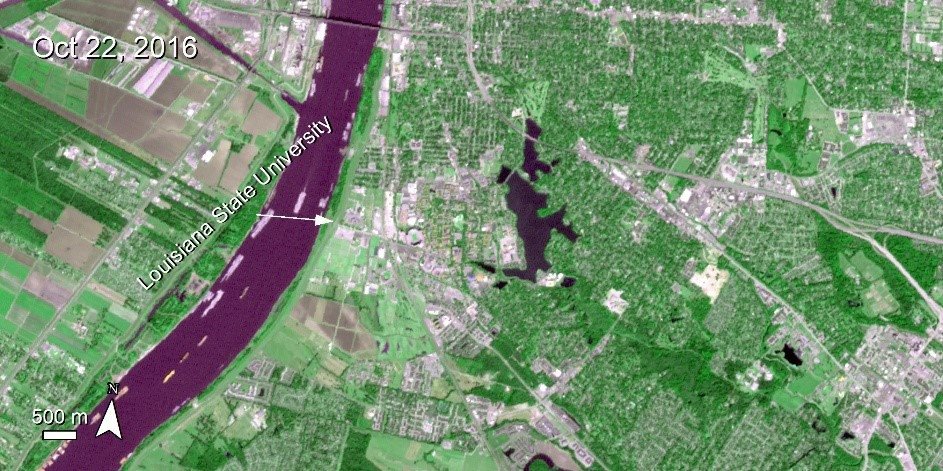
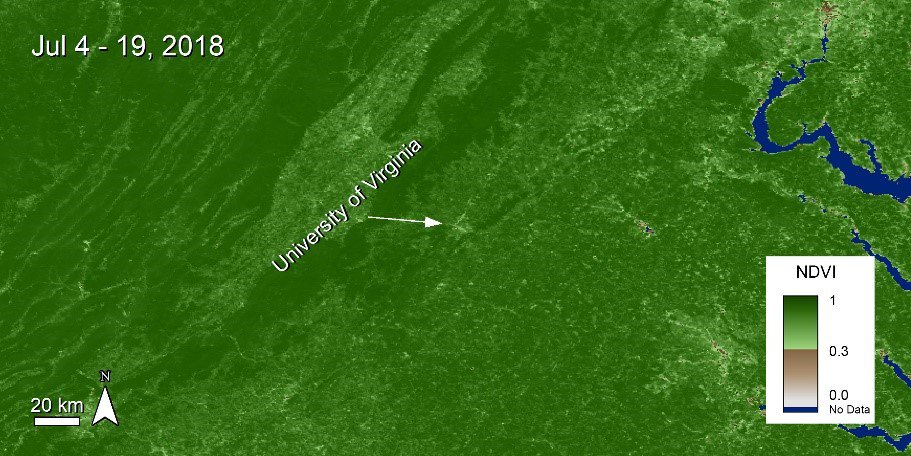
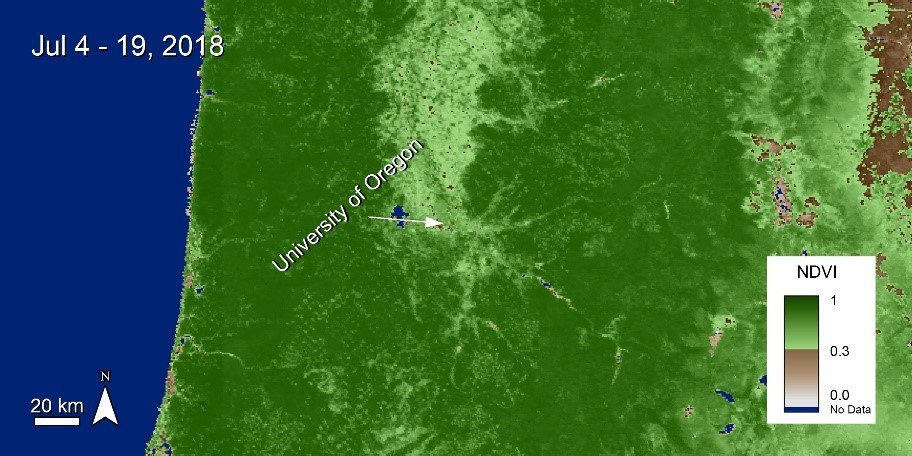
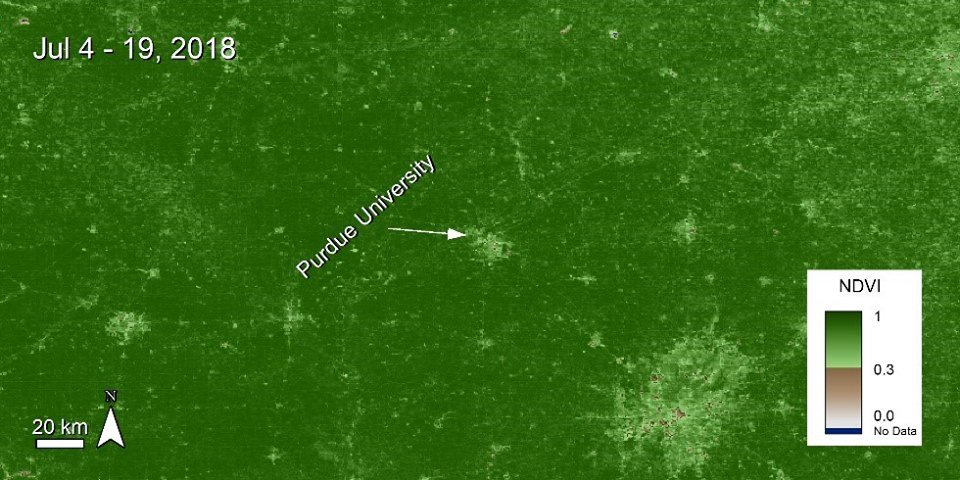
New S-NPP NASA VIIRS Vegetation Indices Data Products Available!New S-NPP NASA VIIRS Vegetation Indices Data Products Available! The Suomi National Polar-orbiting Partnership (S-NPP) Visible Infrared Imaging Radiometer Suite (VIIRS) Vegetation Indices data products (VNP13s), produced by NASA, are now available from the Land Processes Distributed Active Archive Center (LP DAAC). These 16-day and monthly data products provide global vegetation metrics at 500 meter, 1 kilometer, and 5,600 meter spatial resolutions. These data can support research on phenology and change detection and can be used as a parameter for vegetation models. The imagery below shows the Normalized Difference Vegetation Index (NDVI) for portions of Romania, including the Carpathian Mountains, and surrounding countries. As the months transition from February to June the region experiences vegetation greenup, as indicated by higher NDVI values. Learn more about this data:http://bit.ly/2K20qpx
Posted by NASA Earthdata on Friday, June 22, 2018
Snowpack in the Sierra Nevada Mountain Range (2001-2018)Snowpack in the Sierra Nevada Mountain Range (2001-2018) NASA’s Terra Moderate Resolution Imaging Spectroradiometer (MODIS) satellite sensor can be used to observe large-scale changes that have occurred around the world. The joint NASA NOAA Suomi National Polar-Orbiting Partnership (S-NPP) Visible Infrared Imaging Radiometer Suite (VIIRS) satellite sensor was launched in 2011. The new VIIRS data products, created by NASA, provide a continuation of MODIS heritage and enable the study of drought and water availability over time. This data animation shows Terra MODIS and S-NPP NASA VIIRS observations of the snowpack on the Sierra Nevada mountain range from 2001 to 2018. The melt from this snowpack provides California with 30 percent of their fresh water during years with average rainfall. The California Department of Water Resources measures the amount of snowpack in the mountains every year on April 1, to provide consistent data and to study the size of the snowpack. Notice how in the drought years, for example 2003 and 2015, the snowpack is smaller in size than it is during the wetter years, like 2005 and 2017. Lesser amounts of snowpack can be problematic during times of drought, as water resources for California residents can be limited. Learn more about these data, and other data products distributed by the NASA Land Processes Distributed Active Archive Center (LP DAAC) by visiting: https://lpdaac.usgs.gov/.
Posted by NASA Earthdata on Tuesday, April 17, 2018
View the #OrovilleDam during a dry 2015 & after several heavy storms in 2017, as observed by #NASA Terra ASTER. #EarthdataEnablesScience pic.twitter.com/KkbIfj2pI8
— NASAEarthdata (@NASAEarthData) March 30, 2017
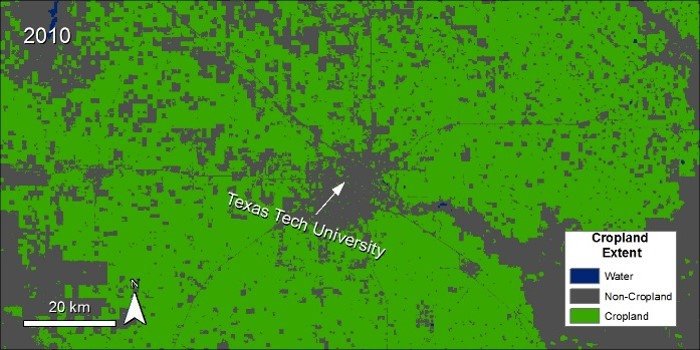
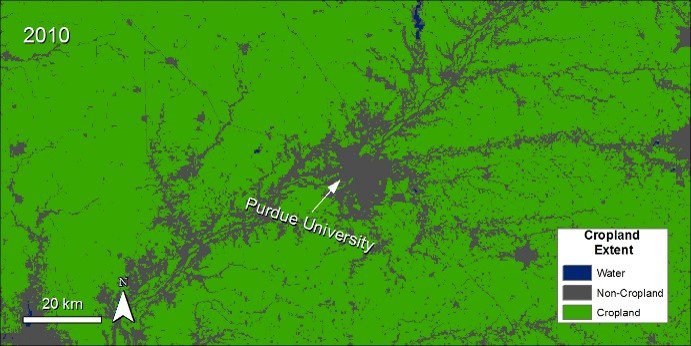
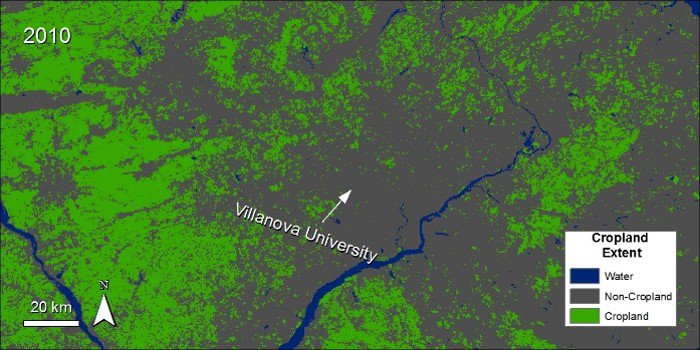
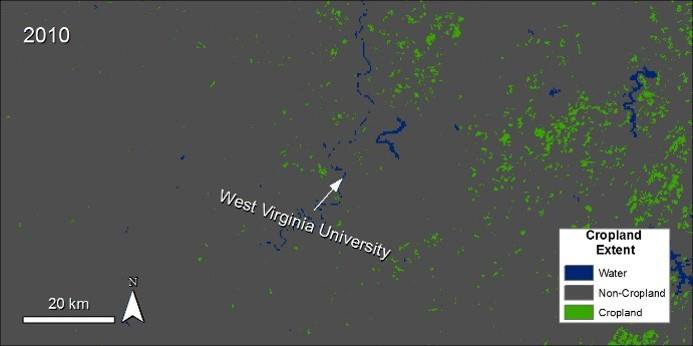
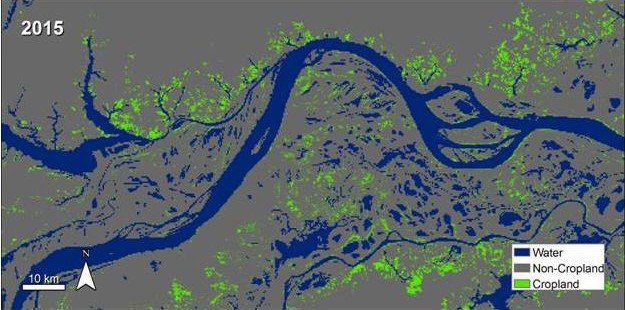
30 m Cropland Extent in AfricaNew Global 30 m Cropland Extent Data Now Available! A new NASA MEaSUREs Global Food Security-support Analysis Data (GFSAD30) data product is now available at the NASA Land Processes Distributed Active Archive Center (LP DAAC). This video shows the extent of cropland throughout different countries in Africa. To learn more about the GFSAD30 Collection: http://bit.ly/2hEK6dD LP DAAC is one of NASA's Earth Observing System Data and Information System (EOSDIS) DAACs that manage, archive and distribute Earth science data as part of the Earth Science Data Systems Program. To learn more about NASA Earth science data, information, services and tools: https://earthdata.nasa.gov To discover and access EOSDIS data: https://search.earthdata.nasa.gov
Posted by NASA Earthdata on Tuesday, November 21, 2017
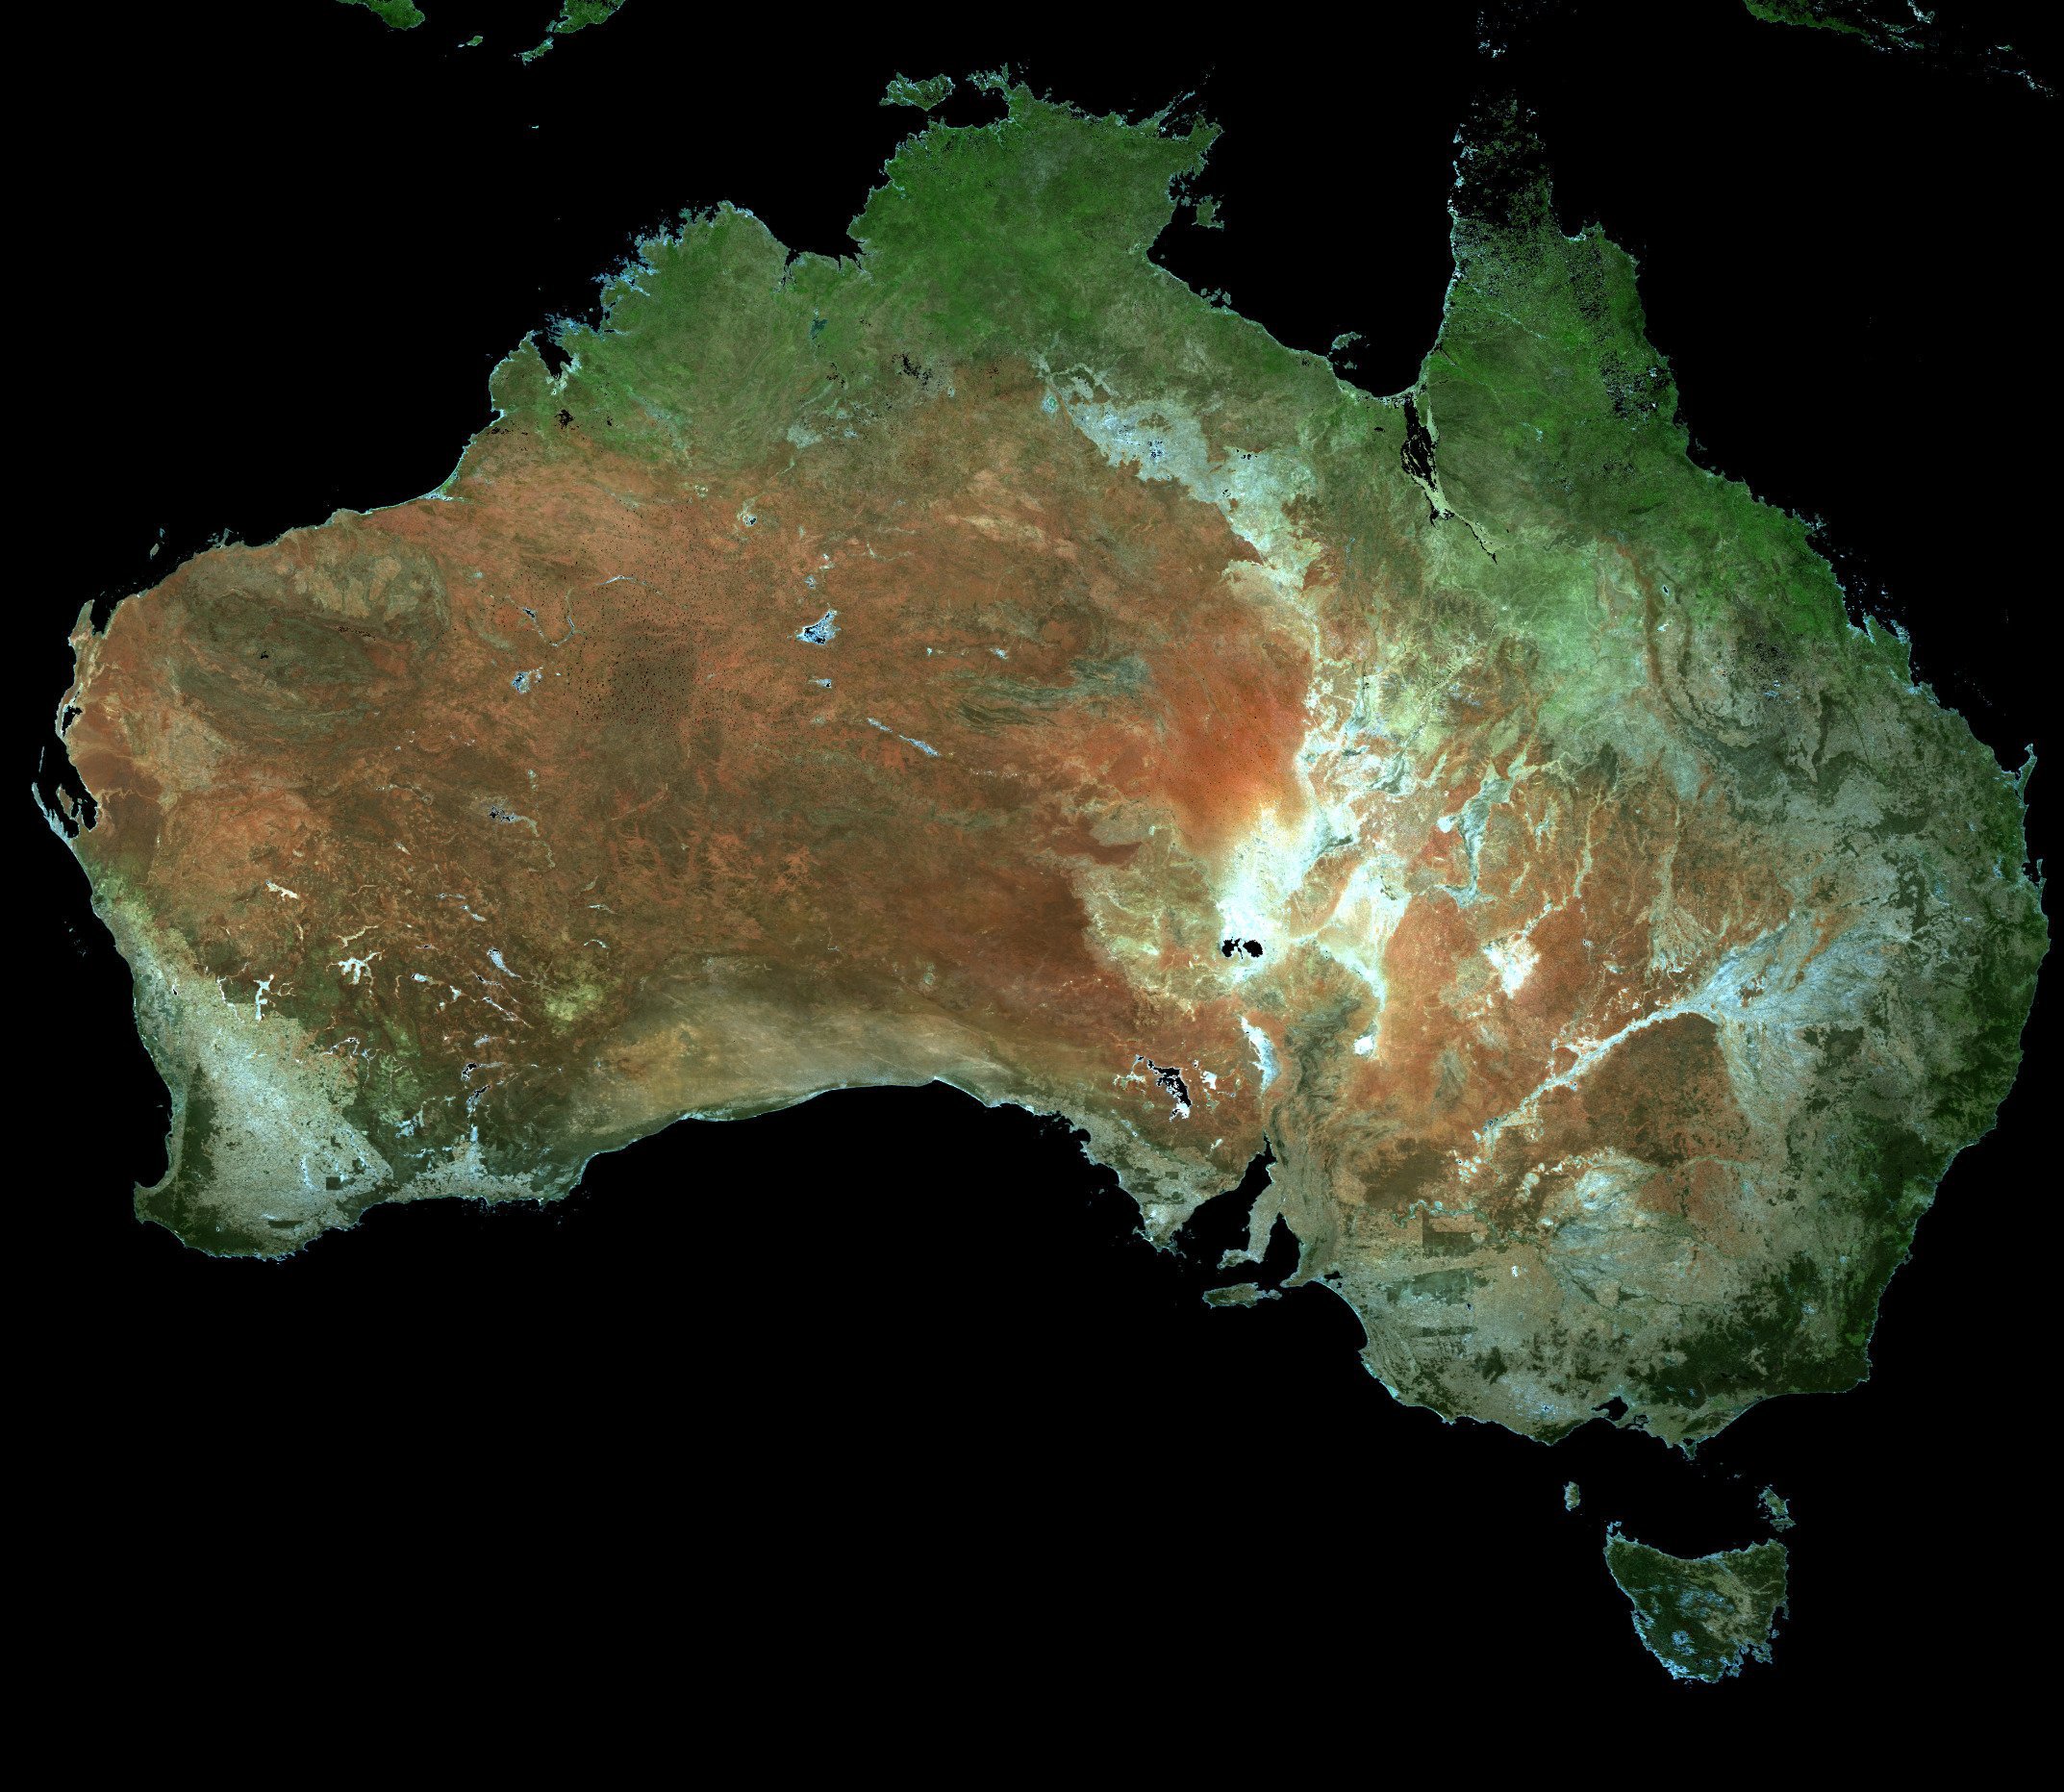
New MODIS Data Released!New Moderate Resolution Imaging Spectroradiometer (MODIS) Downward Shortwave Radiation (DSR) and Photosynthetically Active Radiation (PAR) data products have been released! Terra and Aqua Combined MODIS (MCD18) DSR and PAR data products are now available from the Land Processes Distributed Active Archive Center (LP DAAC). The data product provides information about energy emitted from plant life, and can be used to better understand the carbon cycle and other climatological processes. MCD18 Products are produced daily, with estimates of DSR or PAR in three hour increments, at 5,600 meter resolution. The animation below shows PAR values in thermal transmittance (W/m²) over Australia during a 24 hour period from December 31, 2008 to January 1, 2009 in local time. For more information: MODIS/Terra and Aqua Downward Shortwave Radiation Daily 3-Hourly Global 5 km V006 (MCD18A1.006) DOI: https://doi.org/10.5067/MODIS/MCD18A1.006 MODIS/Terra and Aqua Photosynthetically Active Radiation Daily 3-Hourly Global 5 km (MCD18A2.006) DOI: https://doi.org/10.5067/MODIS/MCD18A2.006 LP DAAC is one of twelve NASA Earth Observing System Data and Information System (EOSDIS) DAACs that manage, archive and distribute Earth science data as part of the Earth Science Data Systems Program.
Posted by NASA Earthdata on Tuesday, October 24, 2017
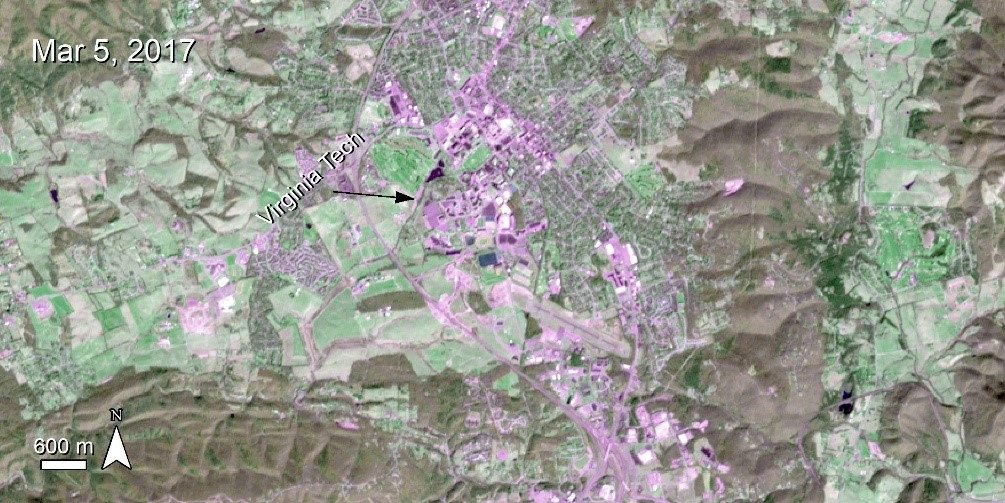
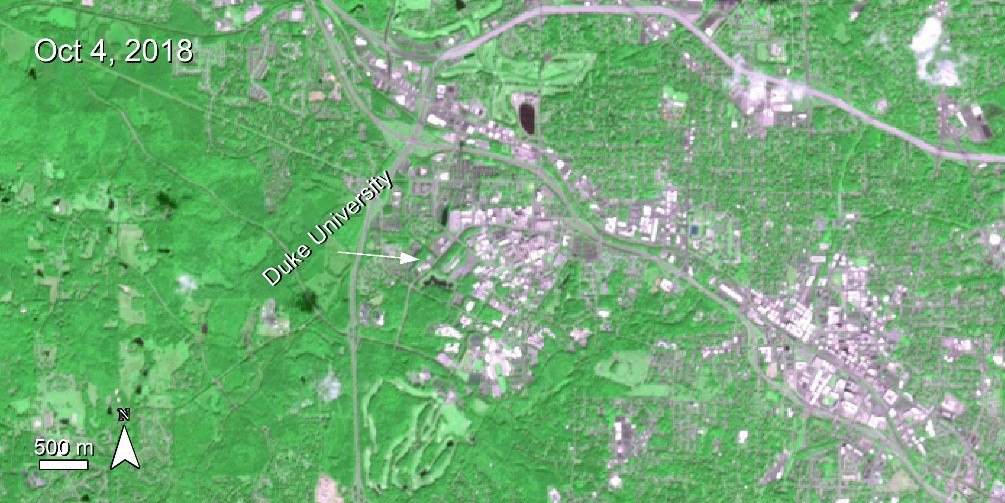
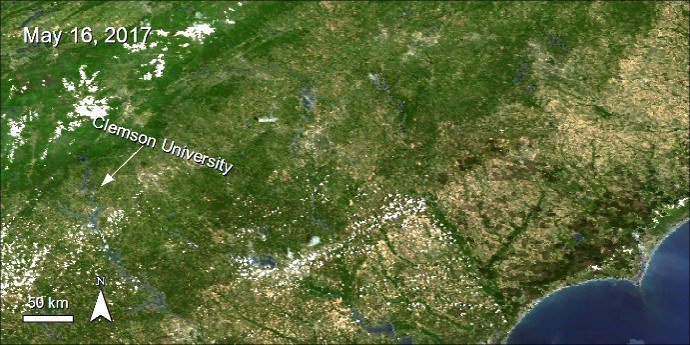
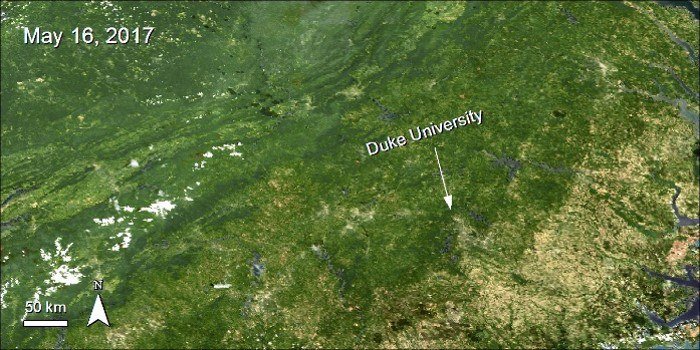
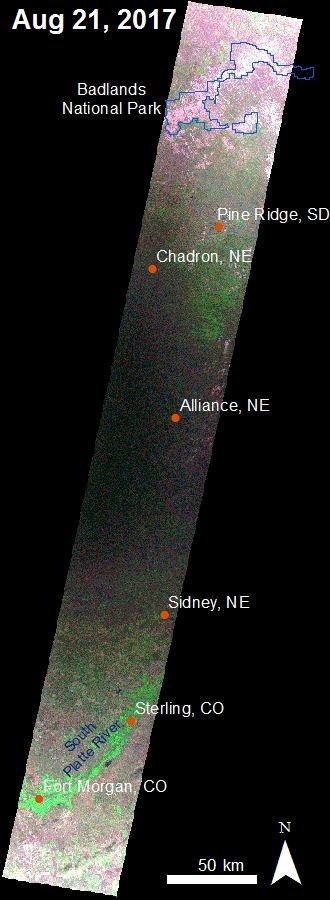
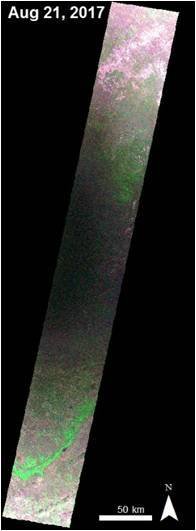
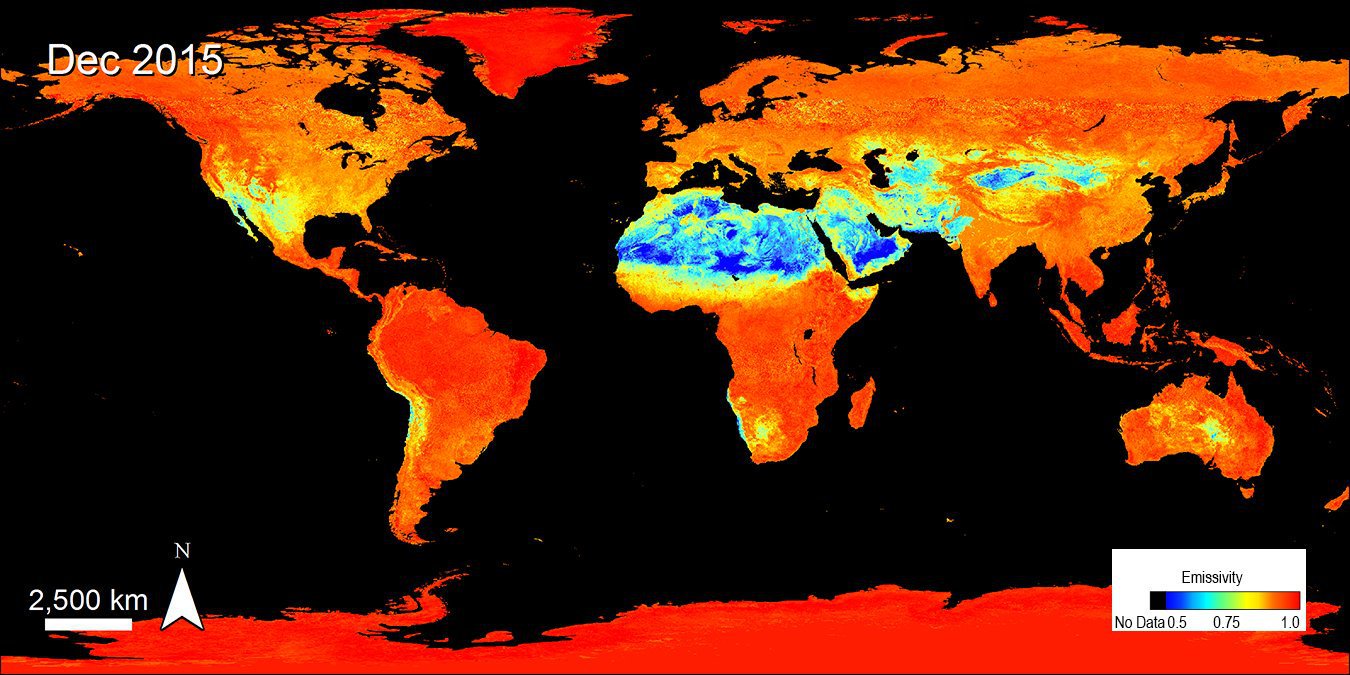
New #NASA Moderate Resolution Imaging Spectroradiometer (MODIS) Land Surface Temperature (LST) and Emissivity data released! NASA’s Terra and Aqua MODIS MOD21/MYD21 Land Surface Temperature (LST) and Emissivity data products are now available from the Land Processes Distributed Active Archive Center (LP DAAC). These products provide daytime and nighttime acquisitions of these dynamic processes across the globe at 1000 meter resolution with daily and 8-day coverage. The data images below show seasonal daytime LST from September 2016 to July 2017 in the Southeastern United States. For more information about this product suite: https://lpdaac.usgs.gov/about/news_archive/release_modis_land_surface_temperature_and_emissivity_version_6_products
Posted by NASA Earthdata on Monday, September 25, 2017
Hurricane HarveyJoint NASA/NOAA Suomi-NPP VIIRS images of Hurricane #Harvey as it made landfall near Houston, Texas, United States. To see more Hurricane Harvey satellite observations including precipitation accumulation imagery, and soil moisture, visit https://www.nasa.gov/feature/goddard/2017/harvey-atlantic-ocean
Posted by NASA Earthdata on Wednesday, August 30, 2017
Development of India's Kurnool Ultra Mega Solar ParkDevelopment of India's Kurnool Ultra Mega Solar Park This animation, derived from NASA Terra Advanced Spaceborne Thermal Emission and Reflection Radiometer (ASTER) data, shows the development of India’s Kurnool Ultra Mega Solar Park from 2015, 2016, and 2017. This solar park is currently the world’s largest single-location solar park, occupying over 5,812 acres (9 square miles) of land. Animation courtesy of the NASA Land Processes Distributed Active Archive Center (LP DAAC).For more information about LP DAAC land data, information, services and tools, https://lpdaac.usgs.gov
Posted by NASA Earthdata on Wednesday, July 5, 2017
#NASA Terra & Aqua MODIS animation shows active fires & post-fire burned areas in Florida during Feb 2017. Data at https://t.co/IMflEWWLLj pic.twitter.com/IbAivYC7L0
— NASAEarthdata (@NASAEarthData) April 26, 2017
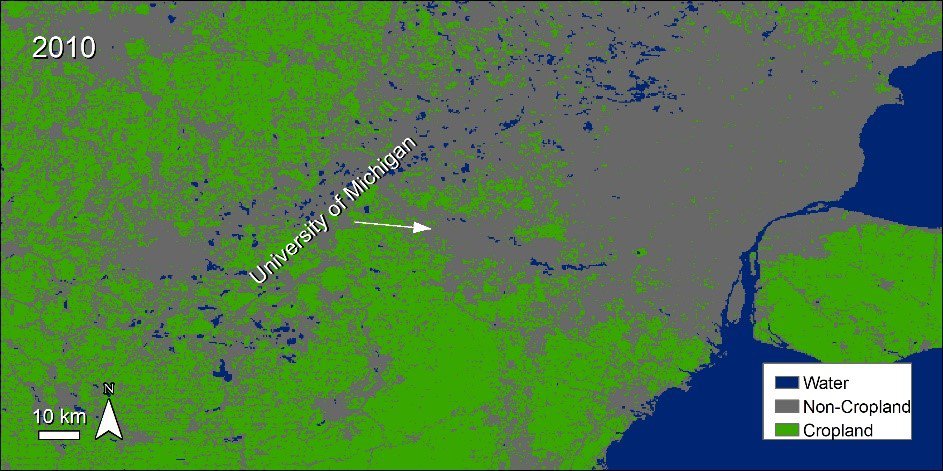
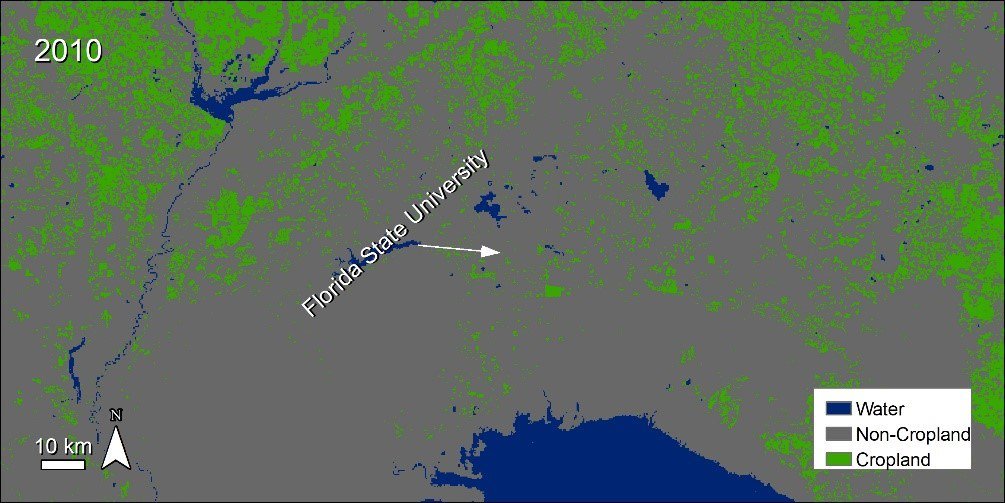
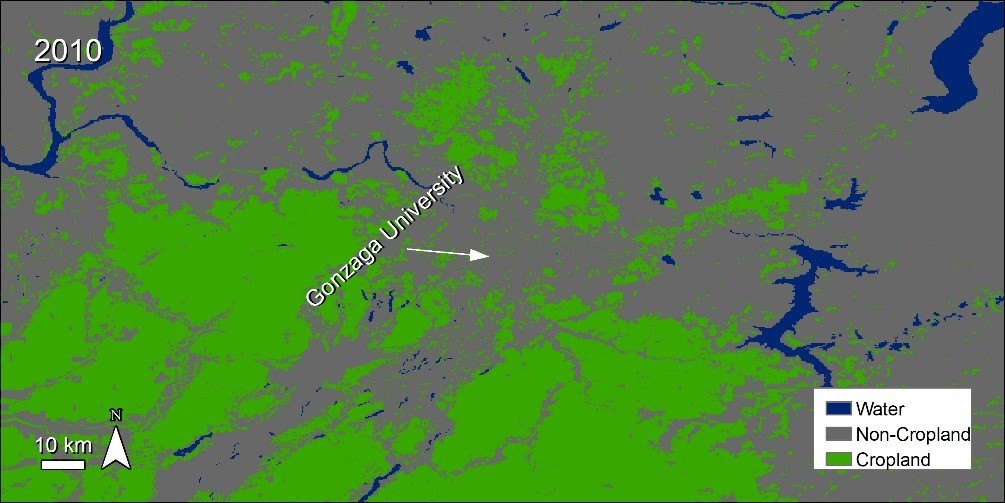
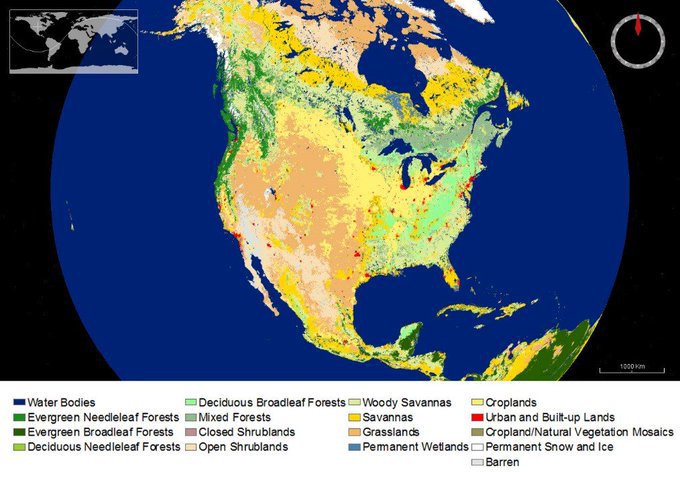
Super Sleuth Answer-April 7, 2017The answer to this week's "Are you a Super Sleuth? Take the Earth Imagery Challenge" is C)Types of crops. The first image in this animation shows different types of crops (wheat, rice, corn, etc.) around the world using the Global Food Security Support Analysis Data (GFSAD) Crop Dominance (CD) data product from the nominal year 2010. The second image in this animated sequence shows the GFSAD Crop Mask (CM) product, which identifies rainfed or irrigated crops. The datasets featured in this video contains input data from NASA’s Moderate Resolution Imaging Spectroradiometer (MODIS), NASA/USGS’s Landsat, NOAA’s Advanced Very High Resolution Radiometer (AVHRR), Satellite Probatoire d'Observation de la Terre (SPOT), vegetation data and other sources. GSFAD data is available at the NASA Land Processes Distributed Active Archive Center (LP DAAC).https://lpdaac.usgs.gov LP DAAC is one of twelve NASA Earth Observing System Data and Information System (EOSDIS) DAACs that manage, archive and distribute Earth science data as part of the Earth Science Data Systems Program. To discover and access NASA Earth science data, https://search.earthdata.nasa.gov
Posted by NASA Earthdata on Friday, April 7, 2017
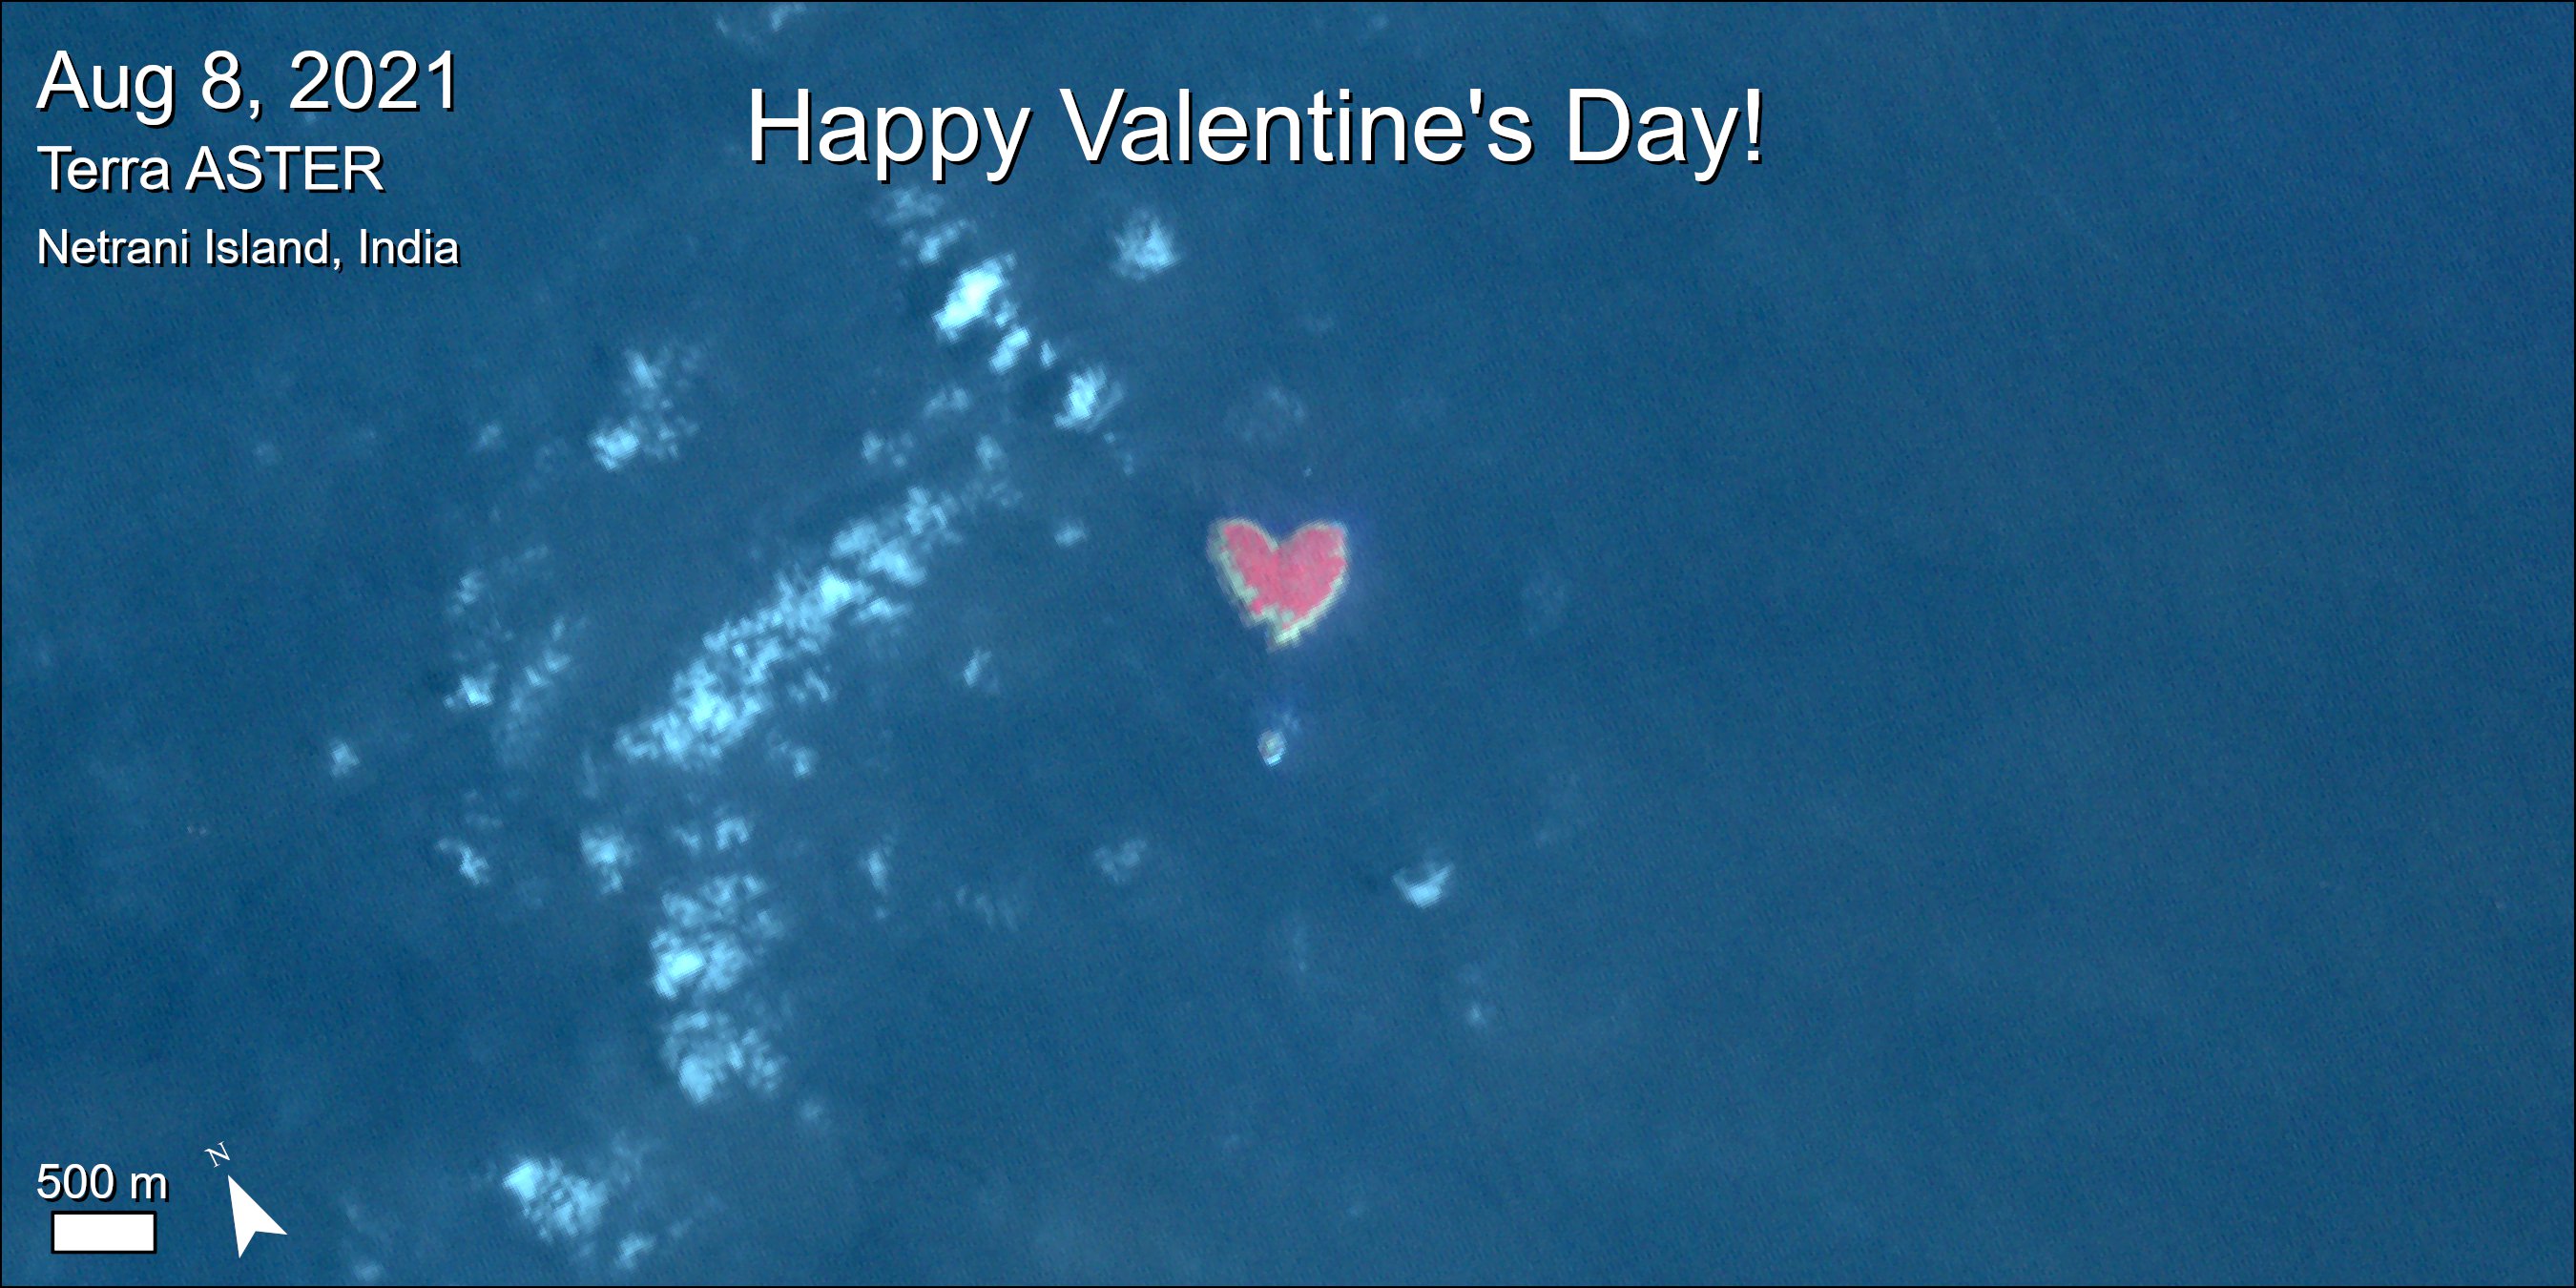
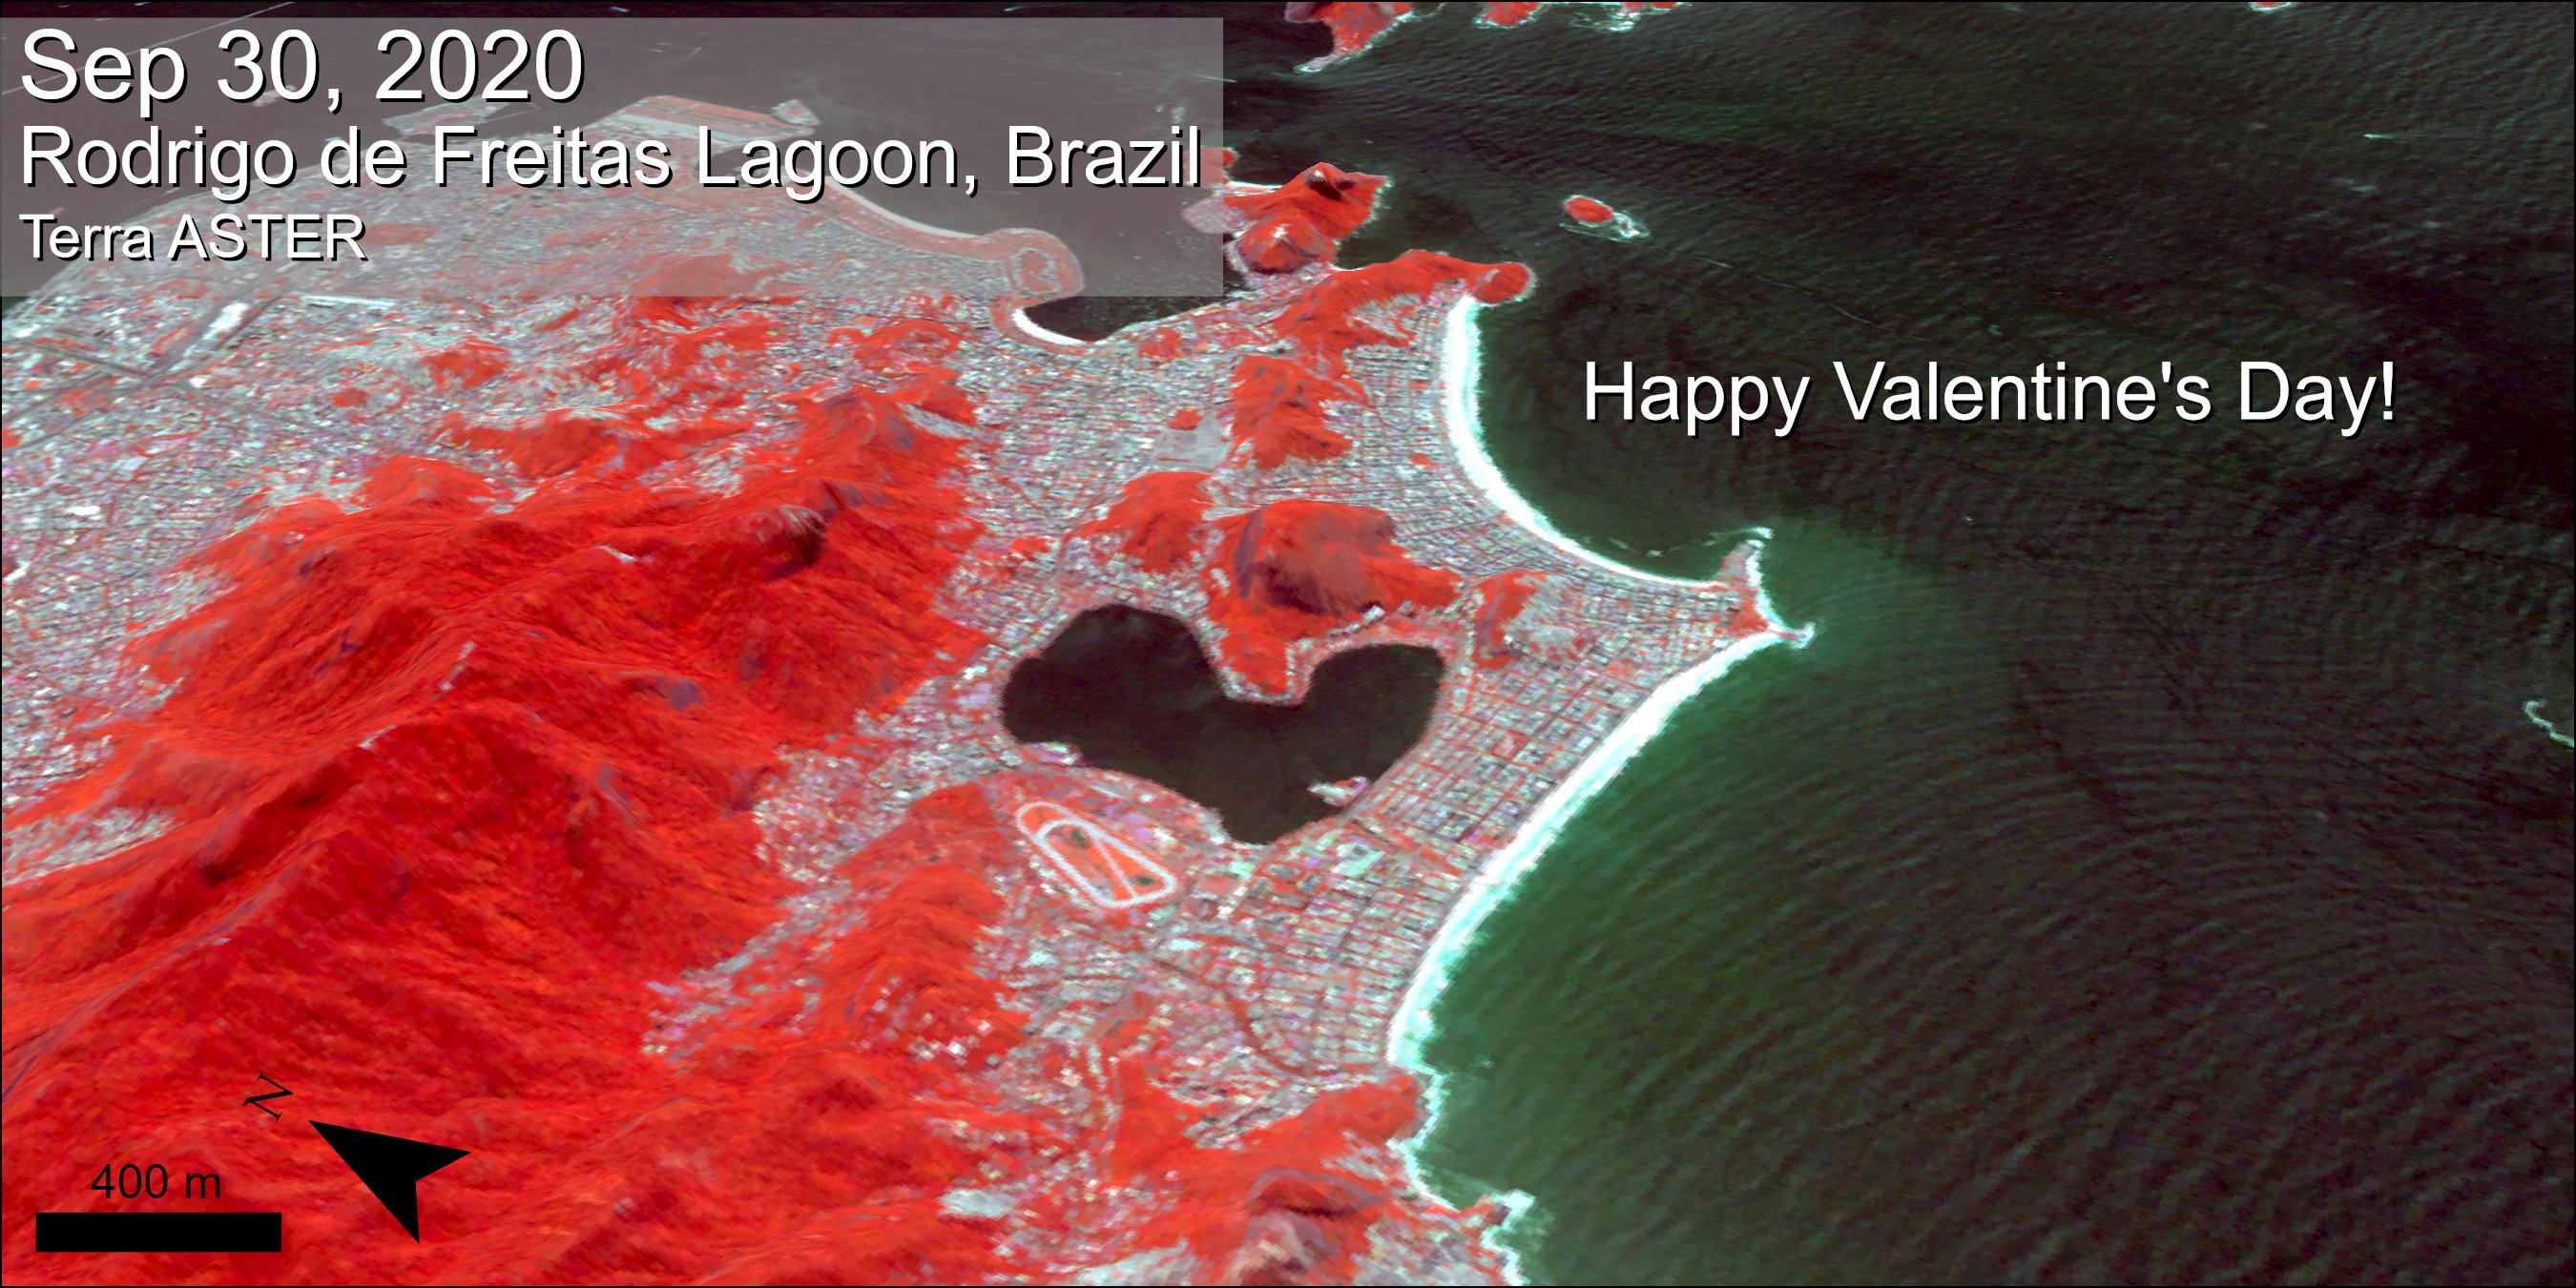
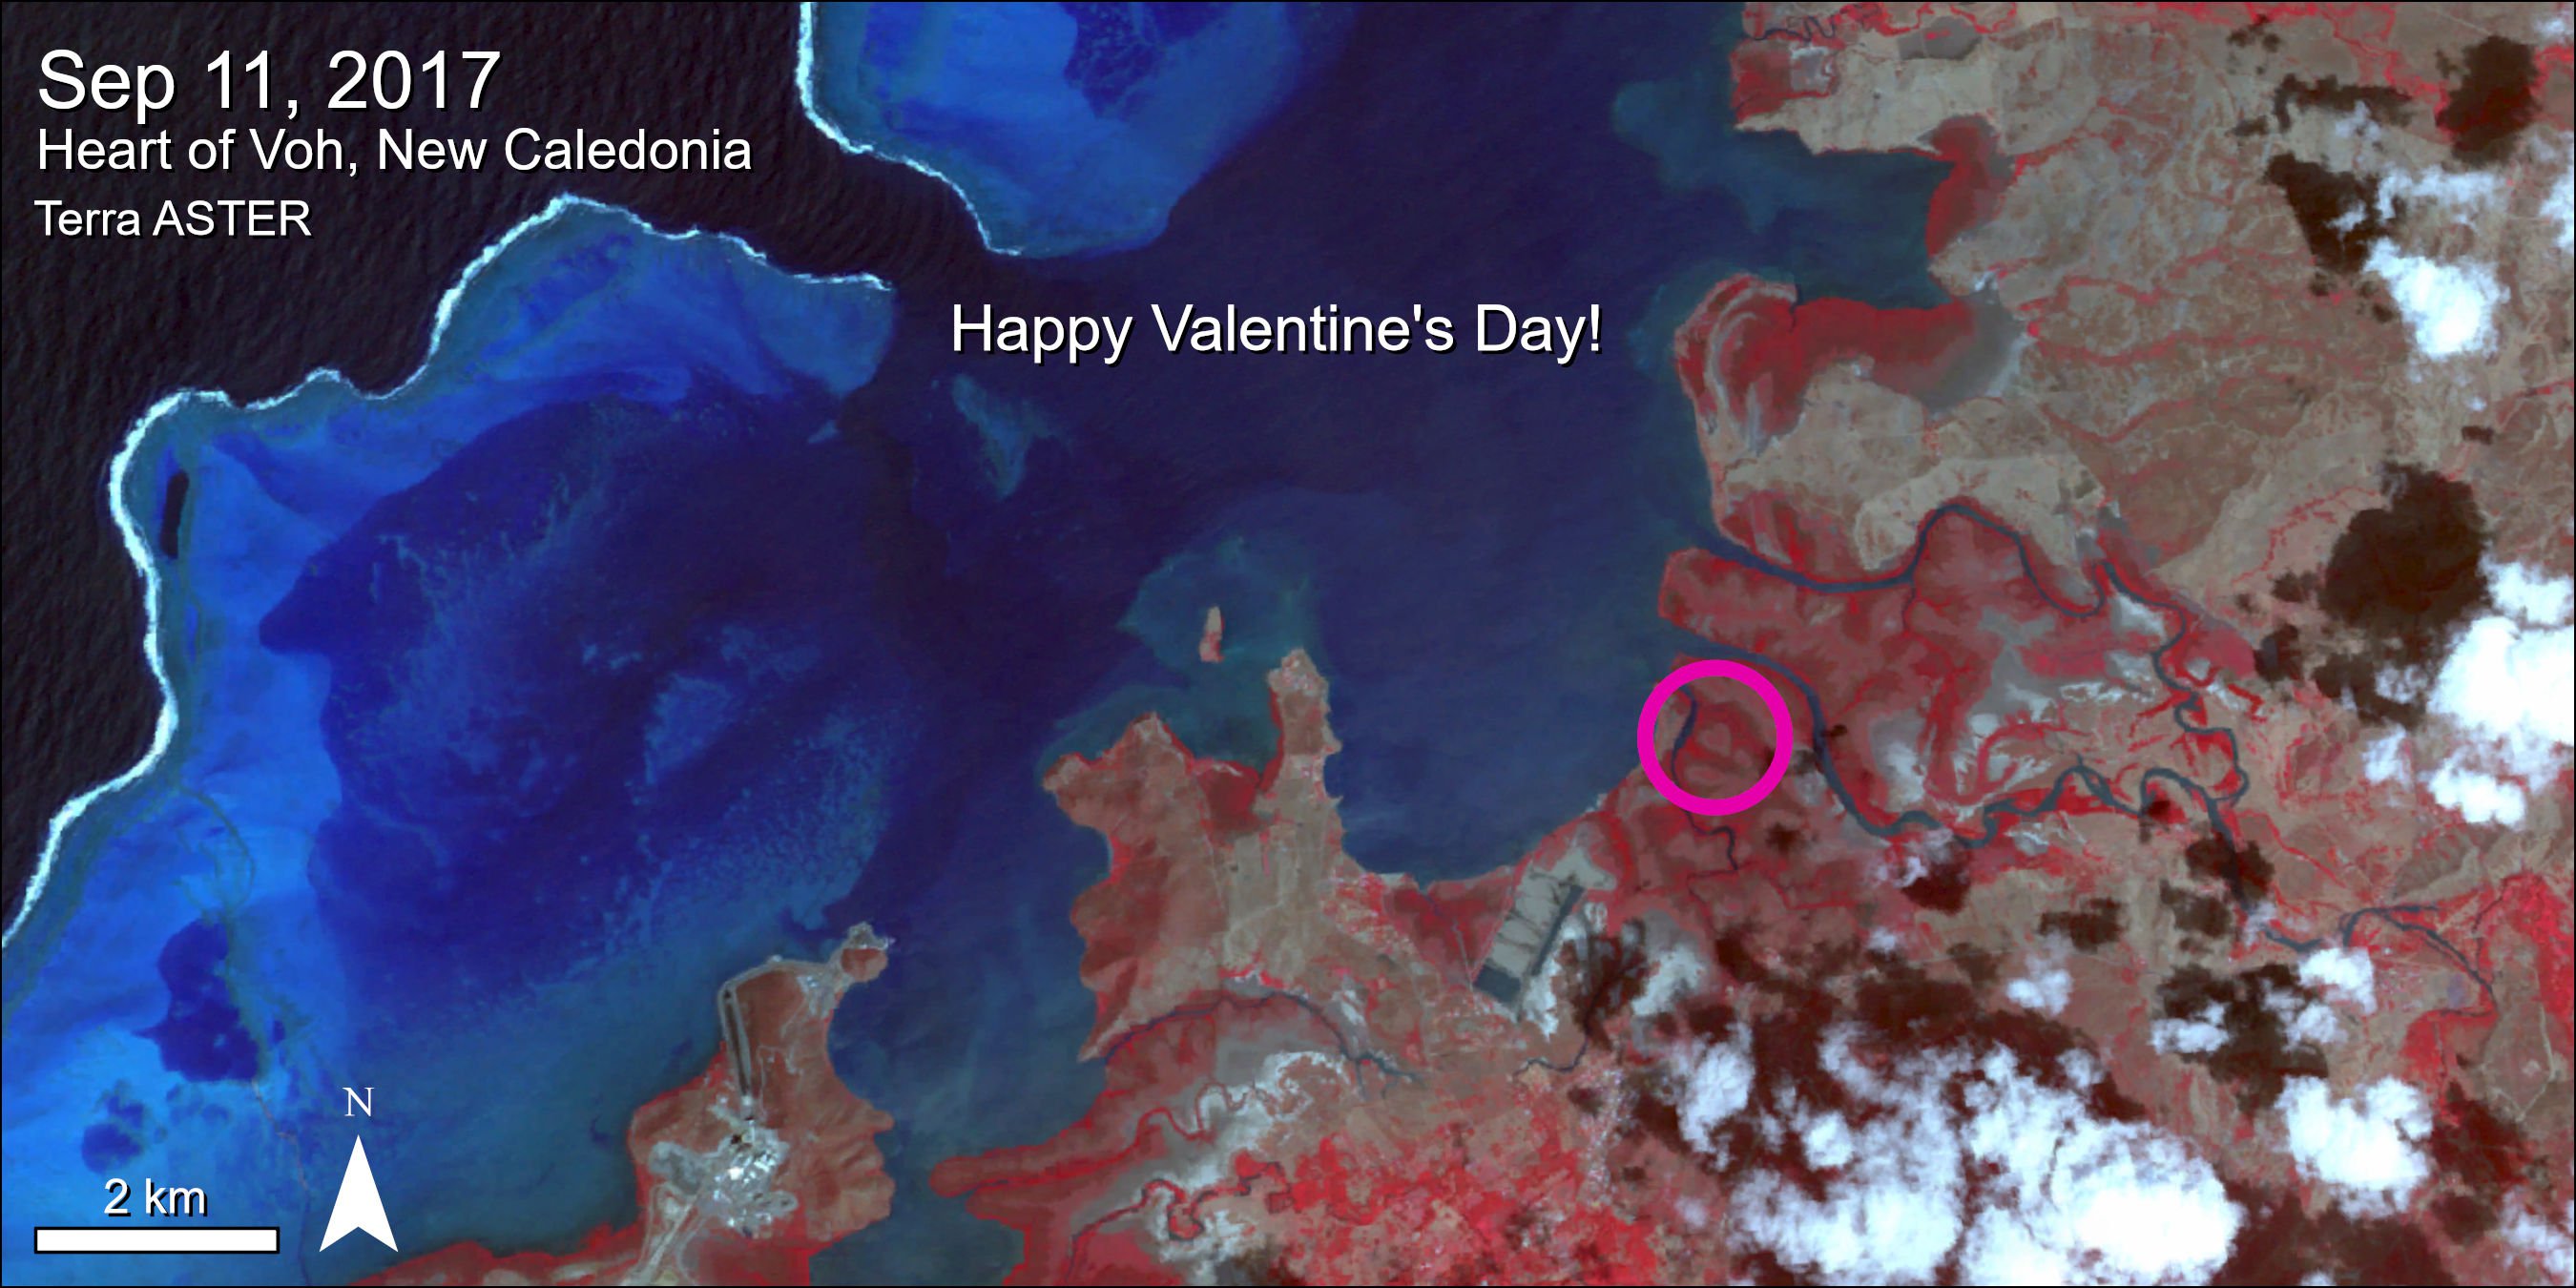
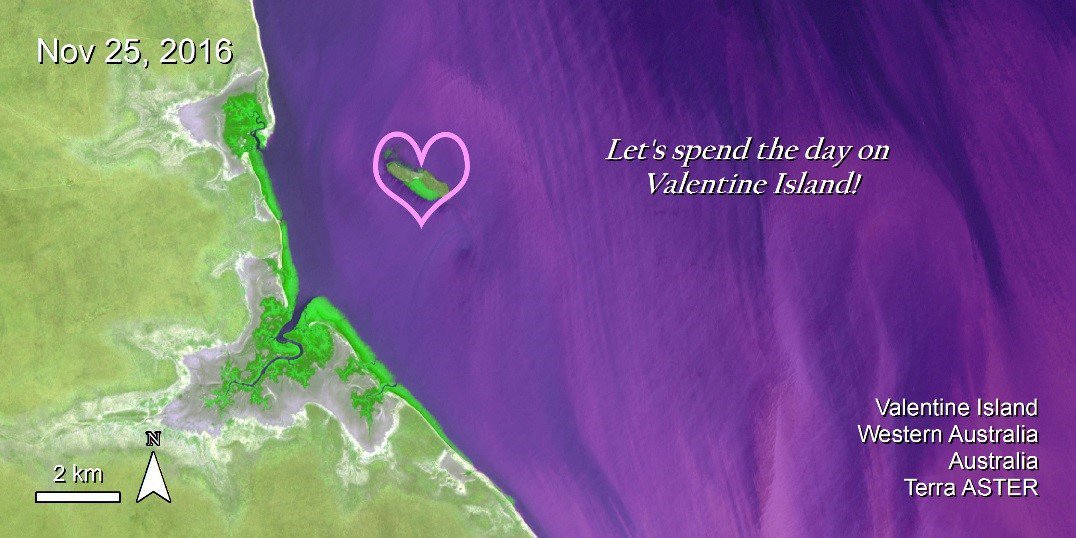
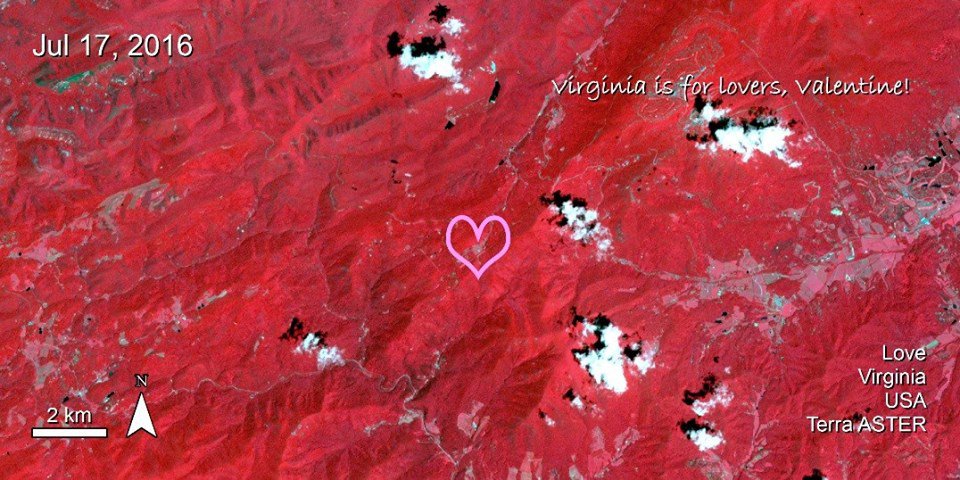
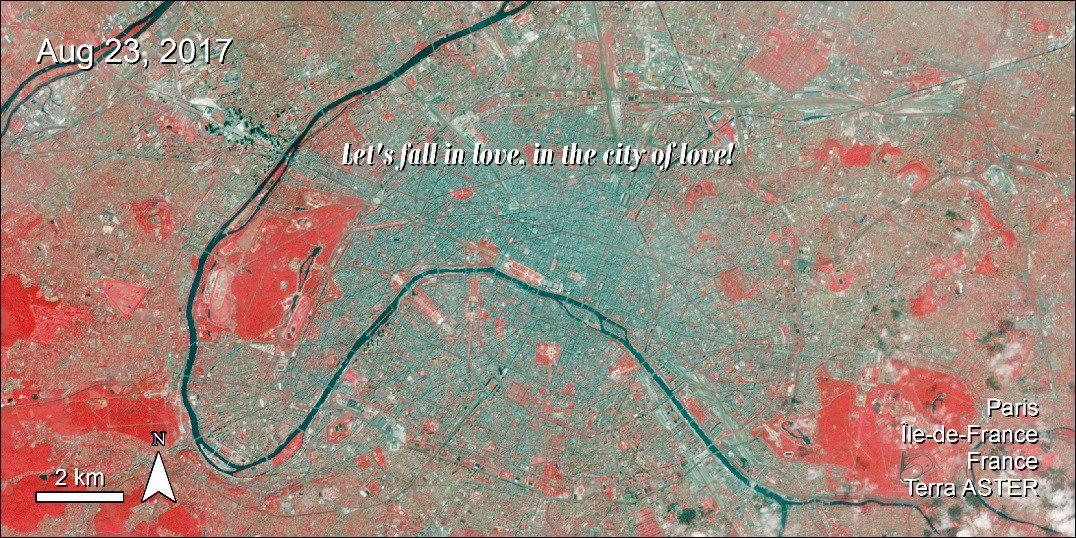
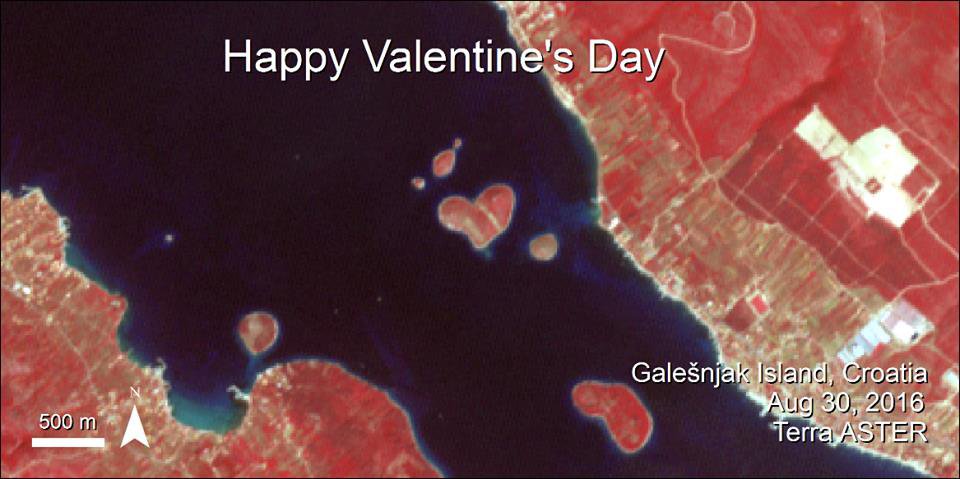
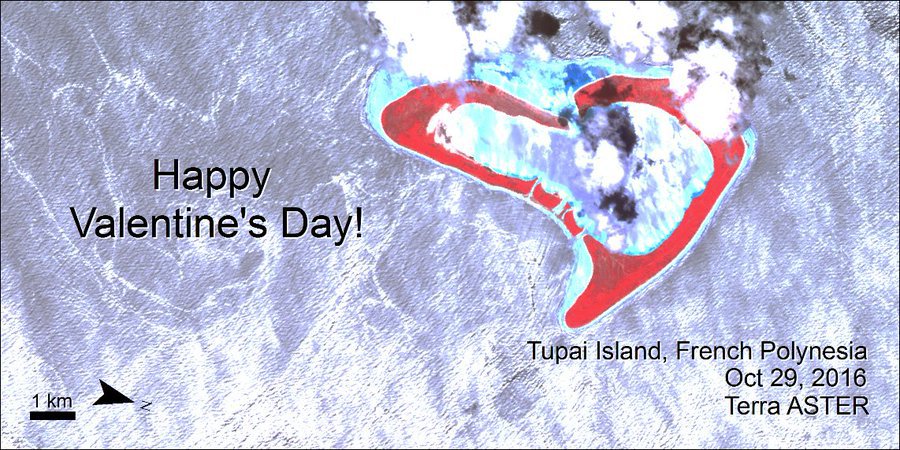
Happy Valentine's Day from the NASA Earthdata Team! Share this #remotesensing #valentine with your favorite science fan.
Posted by NASA Earthdata on Tuesday, February 14, 2017
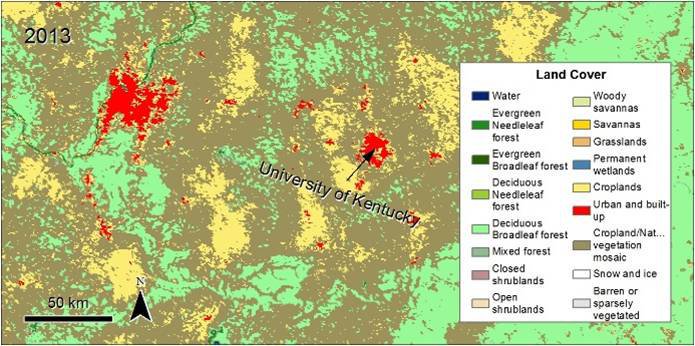
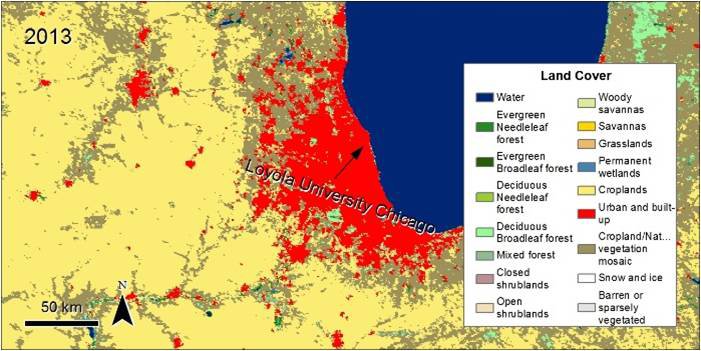
There are several answers to this week's "Are you a Super Sleuth? Take the Earth imagery challenge". This Terra Moderate...
Posted by NASA Earthdata on Friday, December 9, 2016
#NASA Terra MODIS EVI data shows changes in #vegetation for Minneapolis, MN in 2016. #Data at NASA LP DAAC, https://t.co/EMkEZWYHRm pic.twitter.com/M99tEzb2mb
— NASAEarthdata (@NASAEarthData) February 8, 2017
The Terra ASTER satellite sensor captured the area surrounding the epicenter of a magnitude 7.8 earthquake that struck New Zealand on November 14, 2016. This ASTER image from November 19, 2016 shows the eastern coast of the South Island of New Zealand from Herbert Peak near Christchurch through Pegasus Bay and the town of Culverden, where the epicenter was located, to the town of Kaikoura. This region continued to experience many earthquakes and aftershocks throughout November.
Posted by NASA Earthdata on Thursday, December 8, 2016