As summer draws near in the United States, it is important to consider the threatening weather that accompanies this season. For instance, the Central Plains region experiences frequent hail storms during the summer months. On August 18, 2011, a hail storm occurred near the meeting corners of Nebraska, Iowa, and Missouri, causing extensive damage to row crops in the area (Molthan and others 2013). Two substantial hail scars from this storm near the towns of Maryville, Missouri and Clarinda, Iowa are evident in imagery from the Moderate Resolution Imaging Spectroradiometer (MODIS) sensors on board the Terra and Aqua satellites. Vegetation Indices can be derived from data collected by the MODIS sensor, which provide spatiotemporal information on vegetation health, or quality, through measurements such as the Normalized Difference Vegetation Index (NDVI) and Enhanced Vegetation Index (EVI). Additionally, MODIS Leaf Area Index (LAI) data products provide spatiotemporal information of the quantity of leaf cover and vegetation. The slider images below show changes in vegetation before and after the hail storm using the Combined Terra and Aqua MODIS LAI data product (MCD15A3H).
In storm analysis, it is not only important to understand vegetation cover change before and after a storm, but also the seasonal variations that can influence vegetation regrowth, as Bell and others (2016) discuss with a similar storm in June 2014. Remote sensing imagery, such as the MODIS vegetation products can demonstrate these changes over time (Huang and others 2004). Vegetation growth in this region begins to slow down as crops mature and senesce in late August, which must be considered in the analysis of MODIS data values surrounding the August 18, 2011 hail storm.
The Application for Extracting and Exploring Analysis Ready Samples (AppEEARS) is used to obtain and plot time series data values for MODIS Vegetation Indices, and LAI data products. AppEEARS allows users to extract data based upon a specific geographic, temporal, and data product selection. AppEEARS also allows users to compare data values between two data products in the image at the bottom of this page. For the 2011 hail storm, the graph below shows a decrease in EVI and LAI for a location within the extent of the hail scars. AppEEARS provides summary statistics which allow users to select the best data for their study without downloading and processing large amounts of remotely sensed imagery such as the MODIS data used in this study.
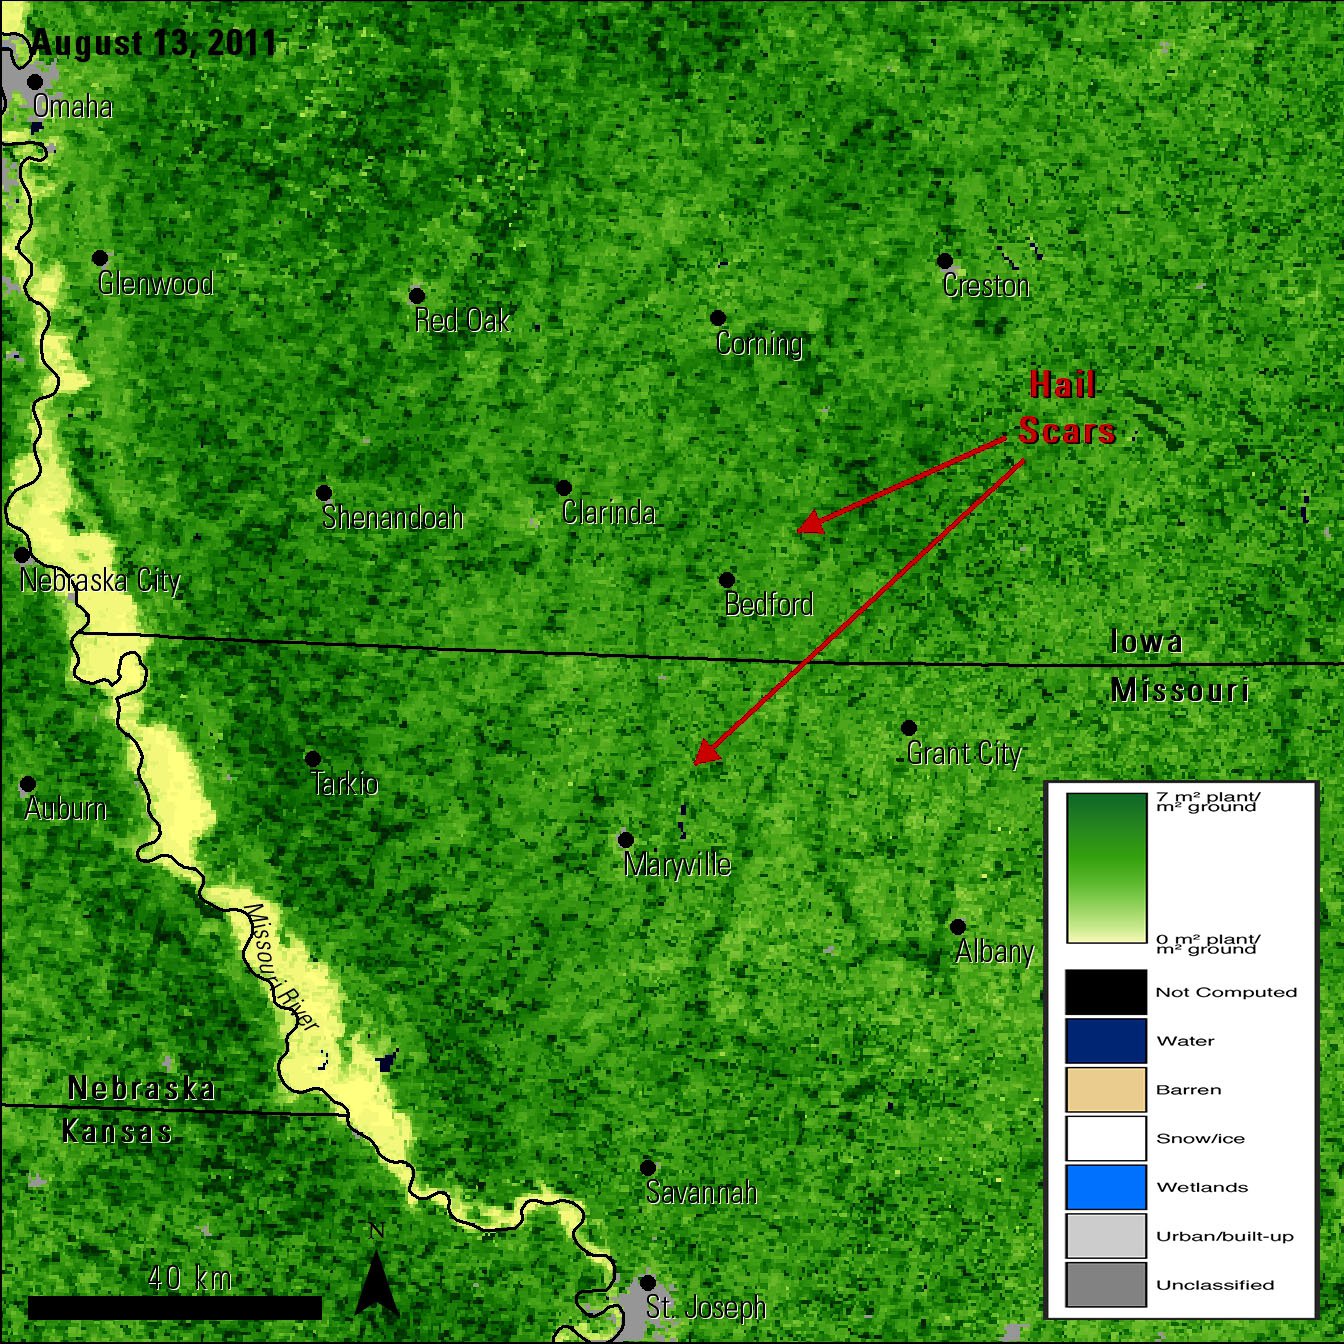
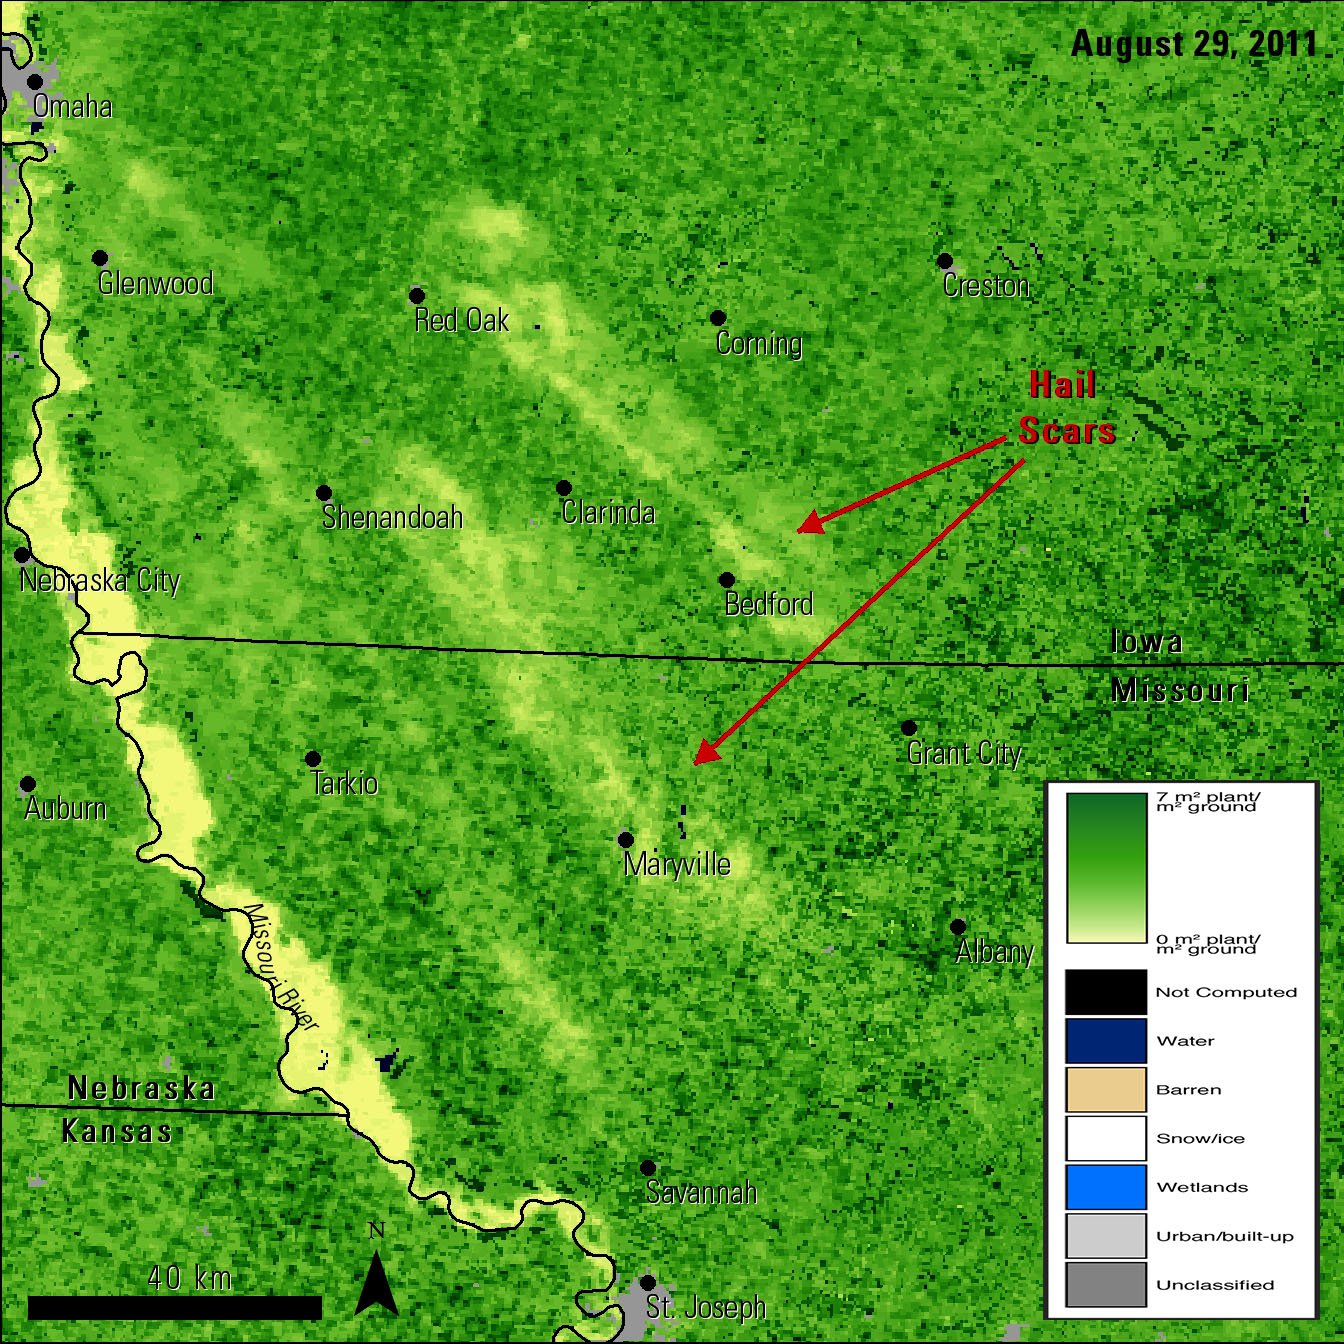
These Terra and Aqua Combined MODIS LAI 4-day composite images show the vegetation cover change before and after the hail storm.
Granule IDs:
MCD15A3H.A2011225.h10v04.006.2015221080730
MCD15A3H.A2011241.h10v04.006.2015221121612
Information about the MCD15A3H data product, and how to access data, can be found here.
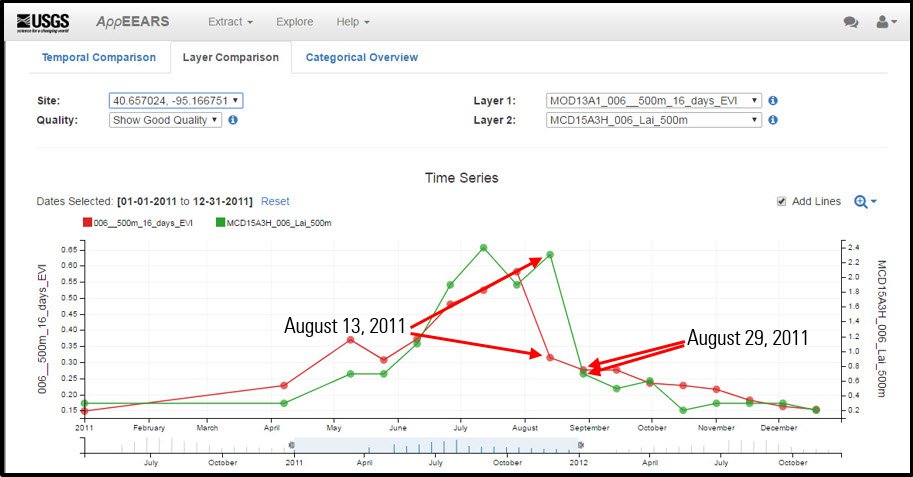
This “Layer Comparison” Graph in AppEEARS shows decreases in EVI (red) and LAI (green) after the hail storm occurred on August 18, 2011.
This “Layer Comparison” Graph in AppEEARS shows decreases in EVI (red) and LAI (green) after the hail storm occurred on August 18, 2011.
References:
Bell, J. R., and A. L. Molthan, 2016, Evaluation of approaches to identifying hail damage to crop vegetation using satellite imagery: J. Operational Meteor, v. 4 no. 11, p. 142-159
Molthan, A. L., J. E. Burks, K. M. McGrath, and F. J. LaFontaine, 2013, Multi-sensor examination of hail damage swaths for near real-time applications and assessment: J. Operational Meteor, v. 1 no. 13, p. 144-156
Material written by Cory Alden1
1 Innovate!, Inc., contractor to the U.S. Geological Survey, Earth Resources Observation and Science (EROS) Center, Sioux Falls, South Dakota, USA. Work performed under USGS contract G15PD00766 for LP DAAC2.
2 LP DAAC Work performed under NASA contract NNG14HH33I.