Data products from the Land Processes (LP) Distributed Active Archive Center (DAAC) are used in many different applications. They play an important role in modeling, help to detect changes to the landscape, and are a way to assess ecosystem variables, to name a few. A few of those applications, published between April and June 2016, are highlighted below. A more exhaustive, albeit not complete, list can be accessed via the LP DAAC Publications webpage.
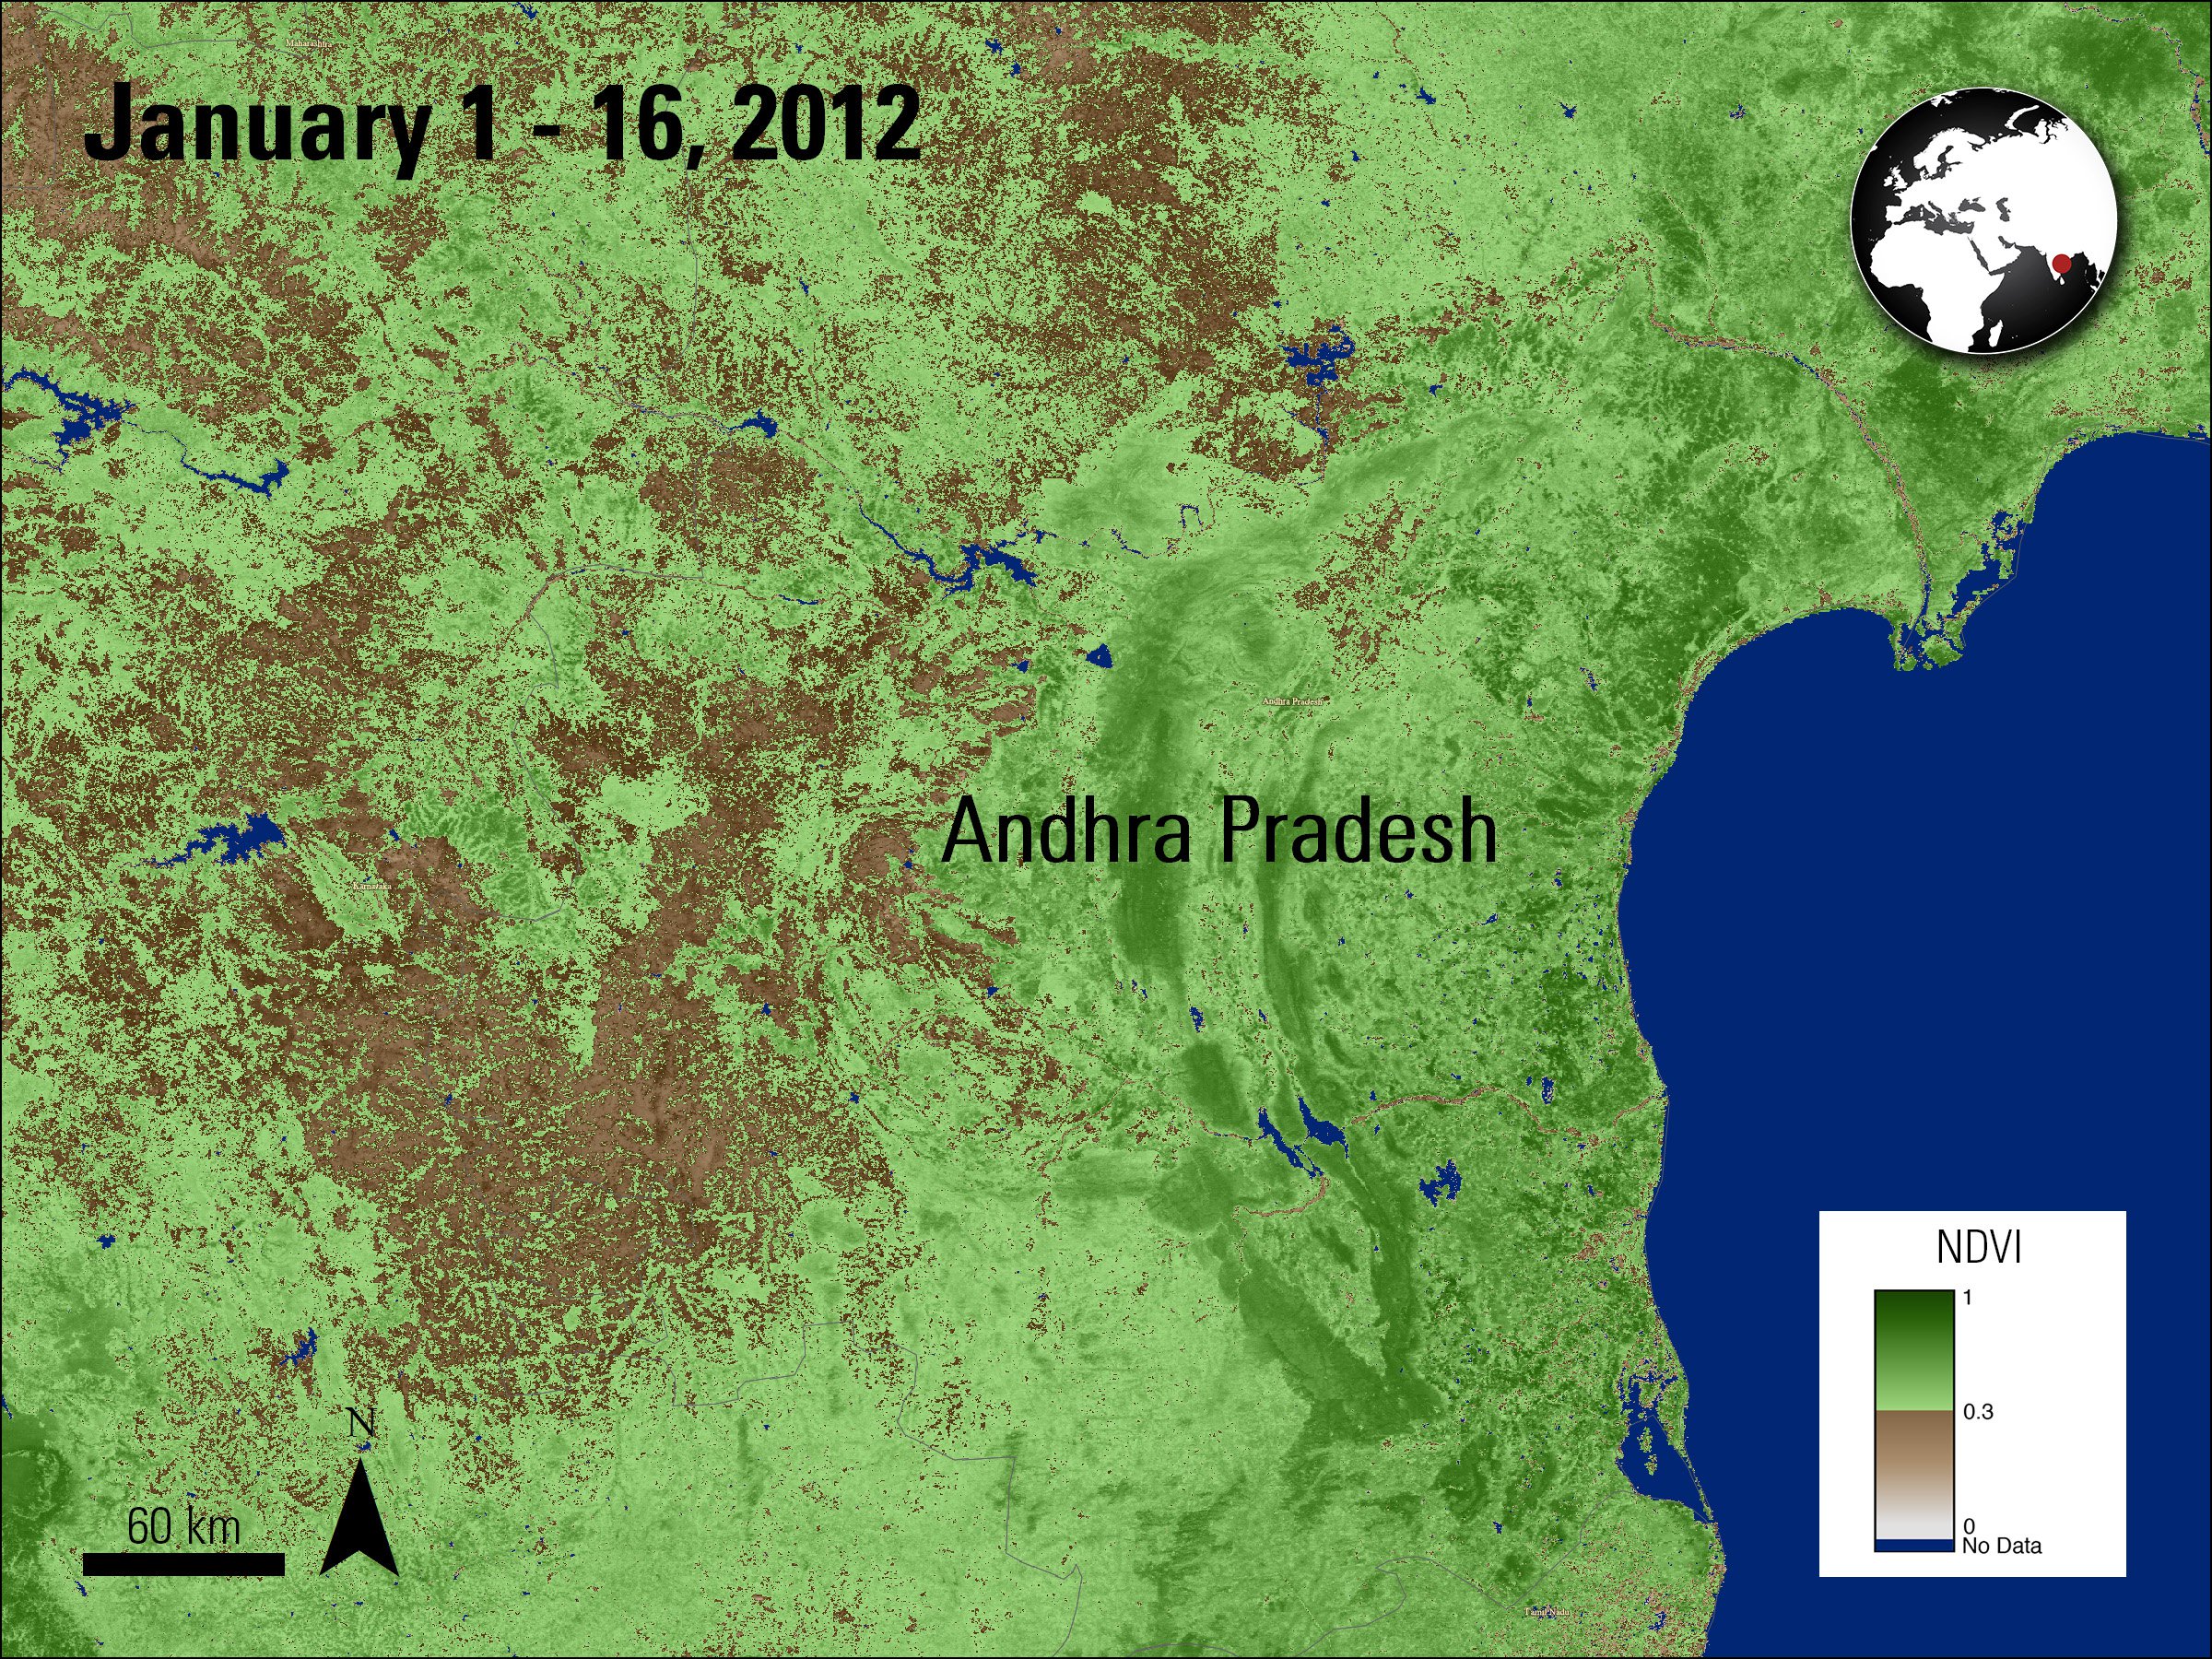
A Terra MODIS NDVI image of the state of Andhra Pradesh, India. NDVI is a measurement of the greenness of an area. A peak in NDVI was observed by the authors during the months of December and January.
Granule ID:
MOD13Q1.A2012001.h25v07.006.2015236171008
A Terra MODIS NDVI image of the state of Andhra Pradesh, India. NDVI is a measurement of the greenness of an area. A peak in NDVI was observed by the authors during the months of December and January.
Granule ID:
MOD13Q1.A2012001.h25v07.006.2015236171008
Gumma, M., Deevi, K., Mohammed, I., Varshney, R., Guar, P., and Whitbread A., 2016, Satellite imagery and household survey for tracking chickpea adoption in Andhra Pradesh, India: International Journal of Remote Sensing, v. 37, no. 8, p. 1955-1972. [Also available at http://dx.doi.org/10.1080/01431161.2016.1165889].
The Moderate Resolution Imaging Spectroradiometer (MODIS) instrument can be used to study agriculture around the world. Gumma and others (2016) use Terra MODIS Normalized Difference Vegetation Index (NDVI) (MOD13Q1) data, combined with ground survey and household survey data, to map land use and land cover in the Andhra Pradesh state of India. The authors use these data to study chickpea crops throughout the state during different times of the year from 2001 to 2012. In the study, the NDVI data are classified using an ISOCLASS cluster k-means classification, and then a time-series is created for each of the classes. Based on the MODIS data, the authors identify 10 land use and land cover classes in the area, including rain-fed-chickpea. The authors find a significant increase in chickpea growth during the study period in the four Andhra Pradesh districts of Kurnool, Anantapur, Kadapa, and Prakasam. The authors conclude that MODIS data are useful not only to identify crop land use during specific growing seasons, but also to monitor the changes in land use over time and space.
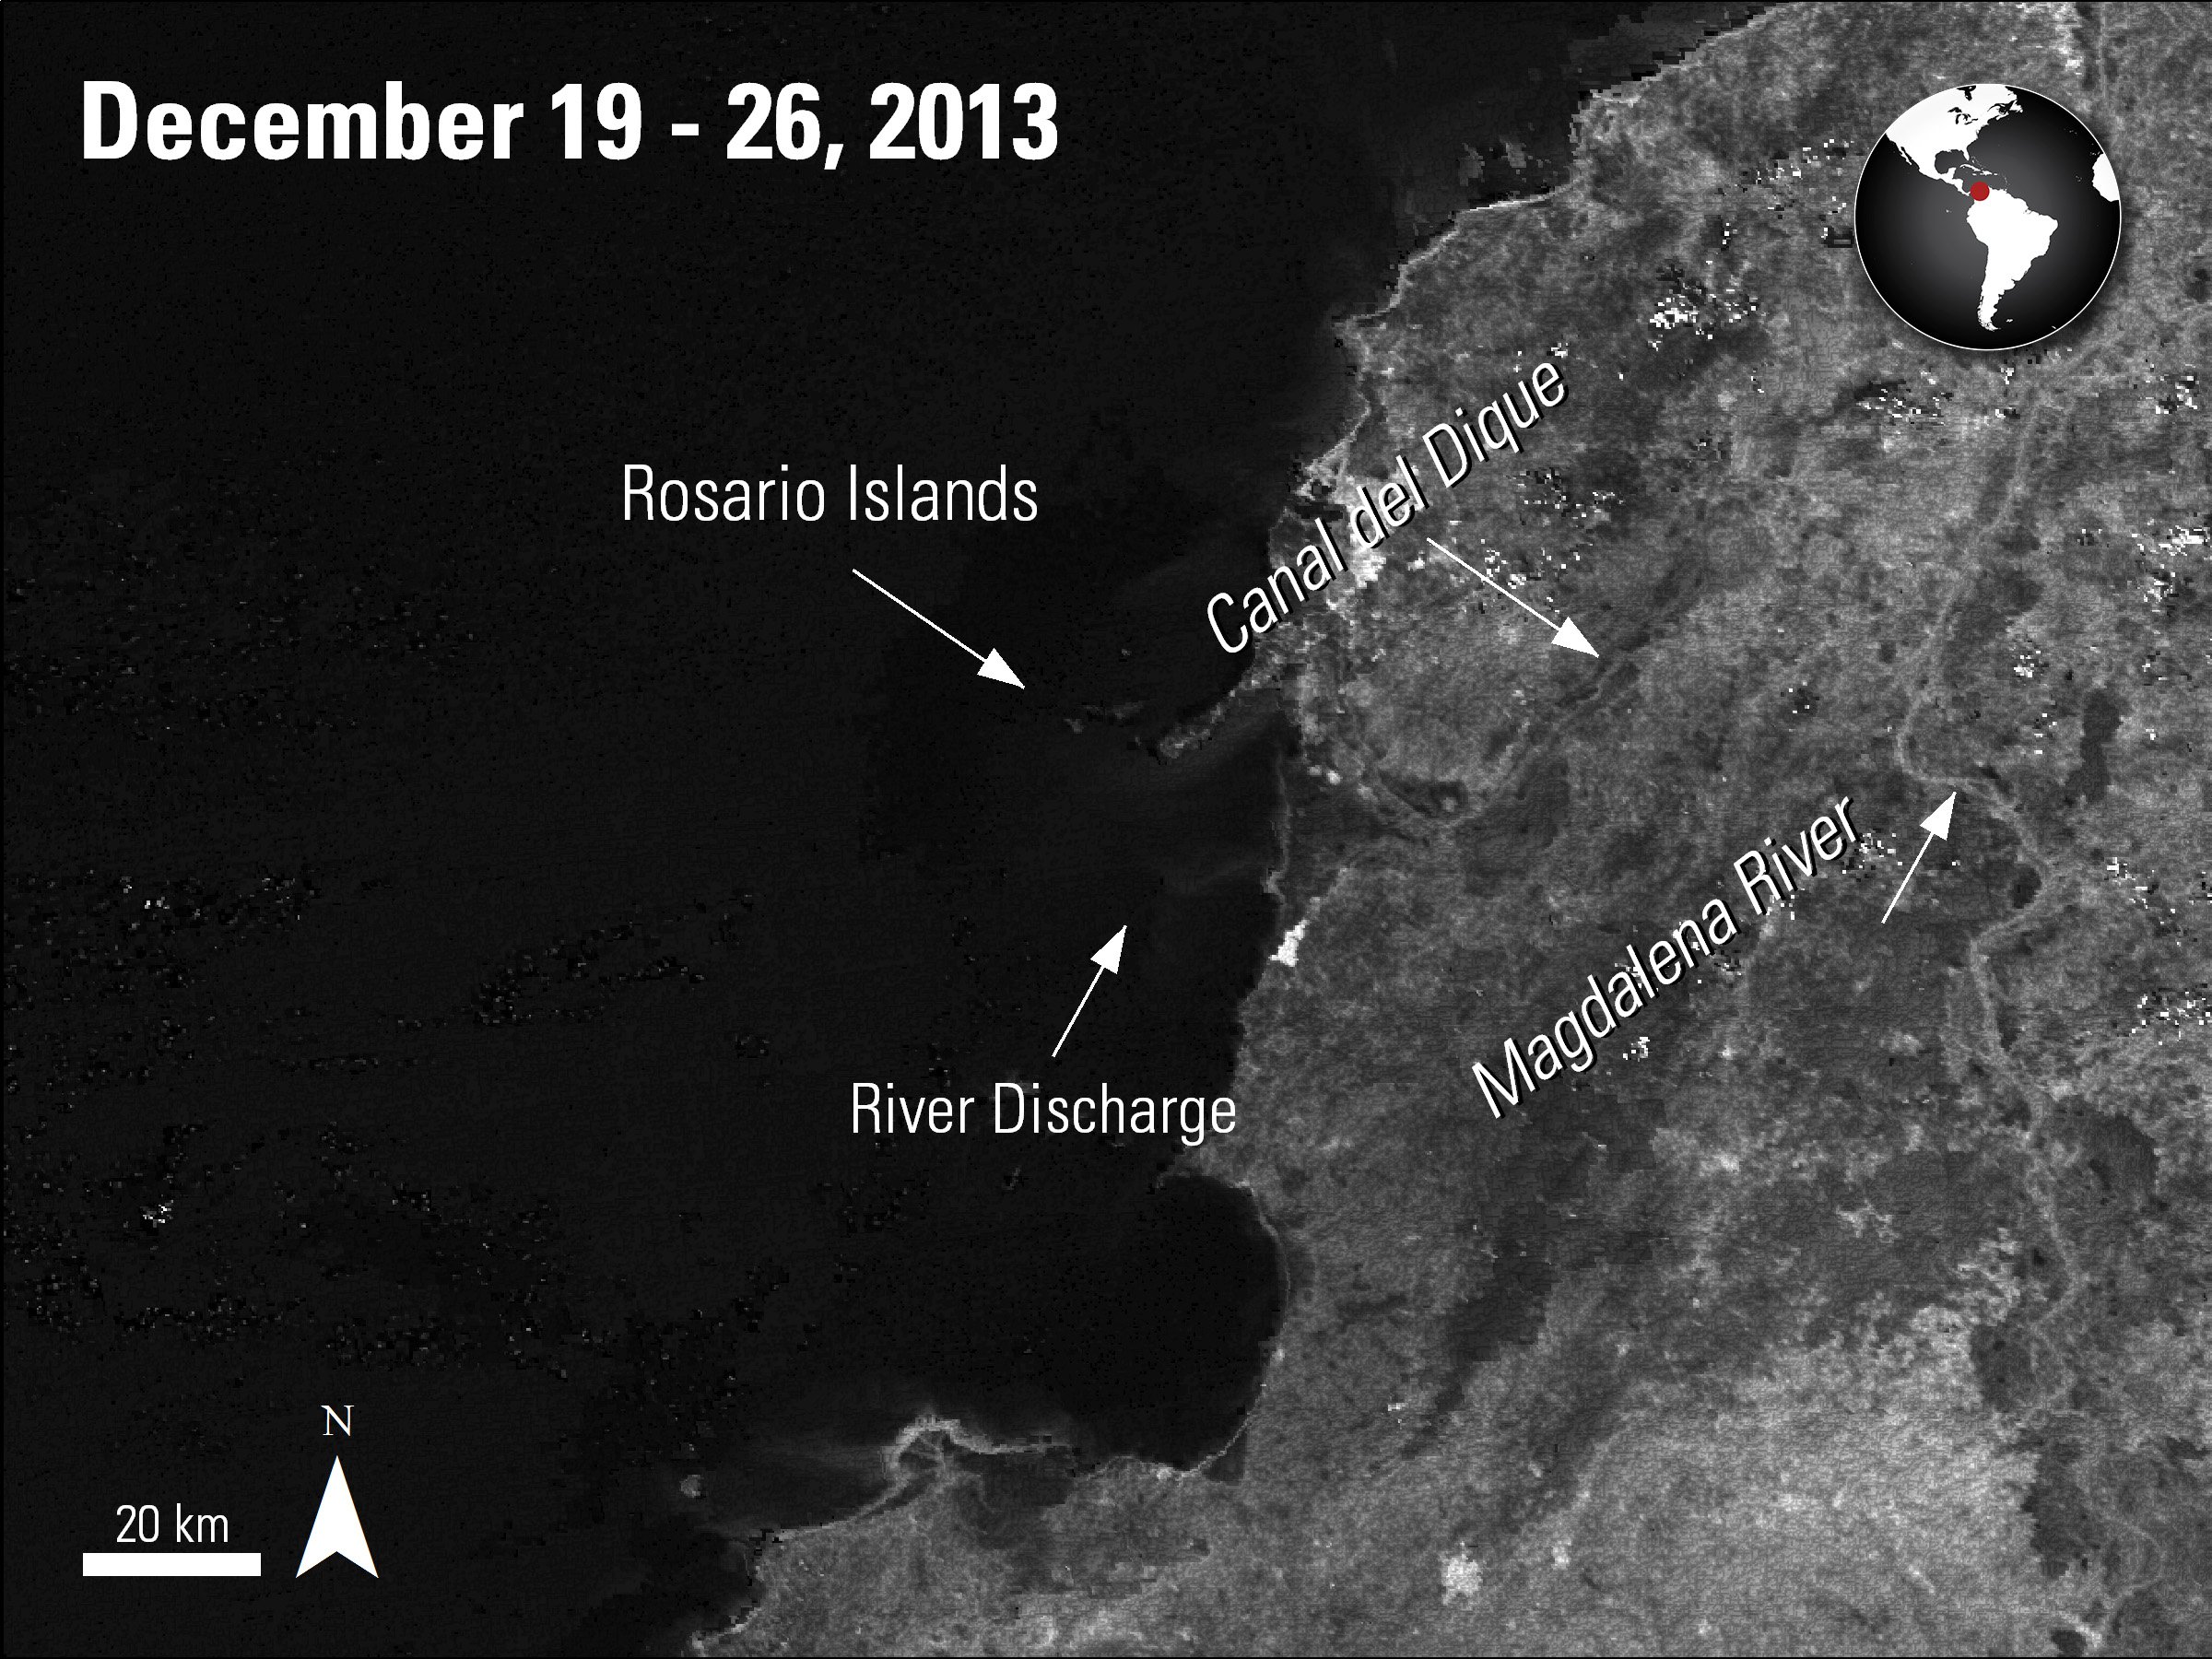
An image of Band 1 from a MODIS 8-day surface reflectance data showing a sediment plume discharged from the Magdalena River near the Rosario Islands.
Granule IDs:
MYD09Q1.A2013353.h10v07.006.2015271162050
MYD09Q1.A2013353.h10v08.006.2015271161914
An image of Band 1 from a MODIS 8-day surface reflectance data showing a sediment plume discharged from the Magdalena River near the Rosario Islands.
Granule IDs:
MYD09Q1.A2013353.h10v07.006.2015271162050
MYD09Q1.A2013353.h10v08.006.2015271161914
Restrepo, J., Park, E., Aquino, S., and Latrubesse, E., 2016, Coral reefs chronically exposed to river sediment plumes in the southwestern Caribbean—Rosario Islands, Colombia: Science of the Total Environment, v. 553, p. 316-329. [Also available at http://dx.doi.org/10.1016/j.scitotenv.2016.02.140].
Coral reefs are fragile ecosystems that can be harmed by any changes to the environment around them. Over the past 20 years, the translucency of water has decreased in Central America and northern South America. Some believe that the protected coral reefs around the Rosario Islands National Park, located off the coast of Colombia, could be impacted by sedimentation from the Magdalena River and its distributary channel, the Canal del Dique. Restrepo and others (2016) use the Terra and Aqua MODIS daily surface reflectance (MOD09GQ and MYD09GQ) and 8-day surface reflectance (MOD09Q1 and MYD09Q1) data from 2000 to 2013, in addition to water discharge and suspended sediment load data, to observe the sediment distribution changes that are being emptied into the coral reef waters near the Rosario Islands. The authors use Band 1 from the 8-day surface reflectance data to map surface sediment plumes and estimate Total Suspended Sediments (TSS) concentrations. Their results indicate that over the last decade there has been a constant flux of water and sediment plumes from the Magdalena River. The authors identify this flux as one of the main stressors that negatively impacts the coral reefs in the region.
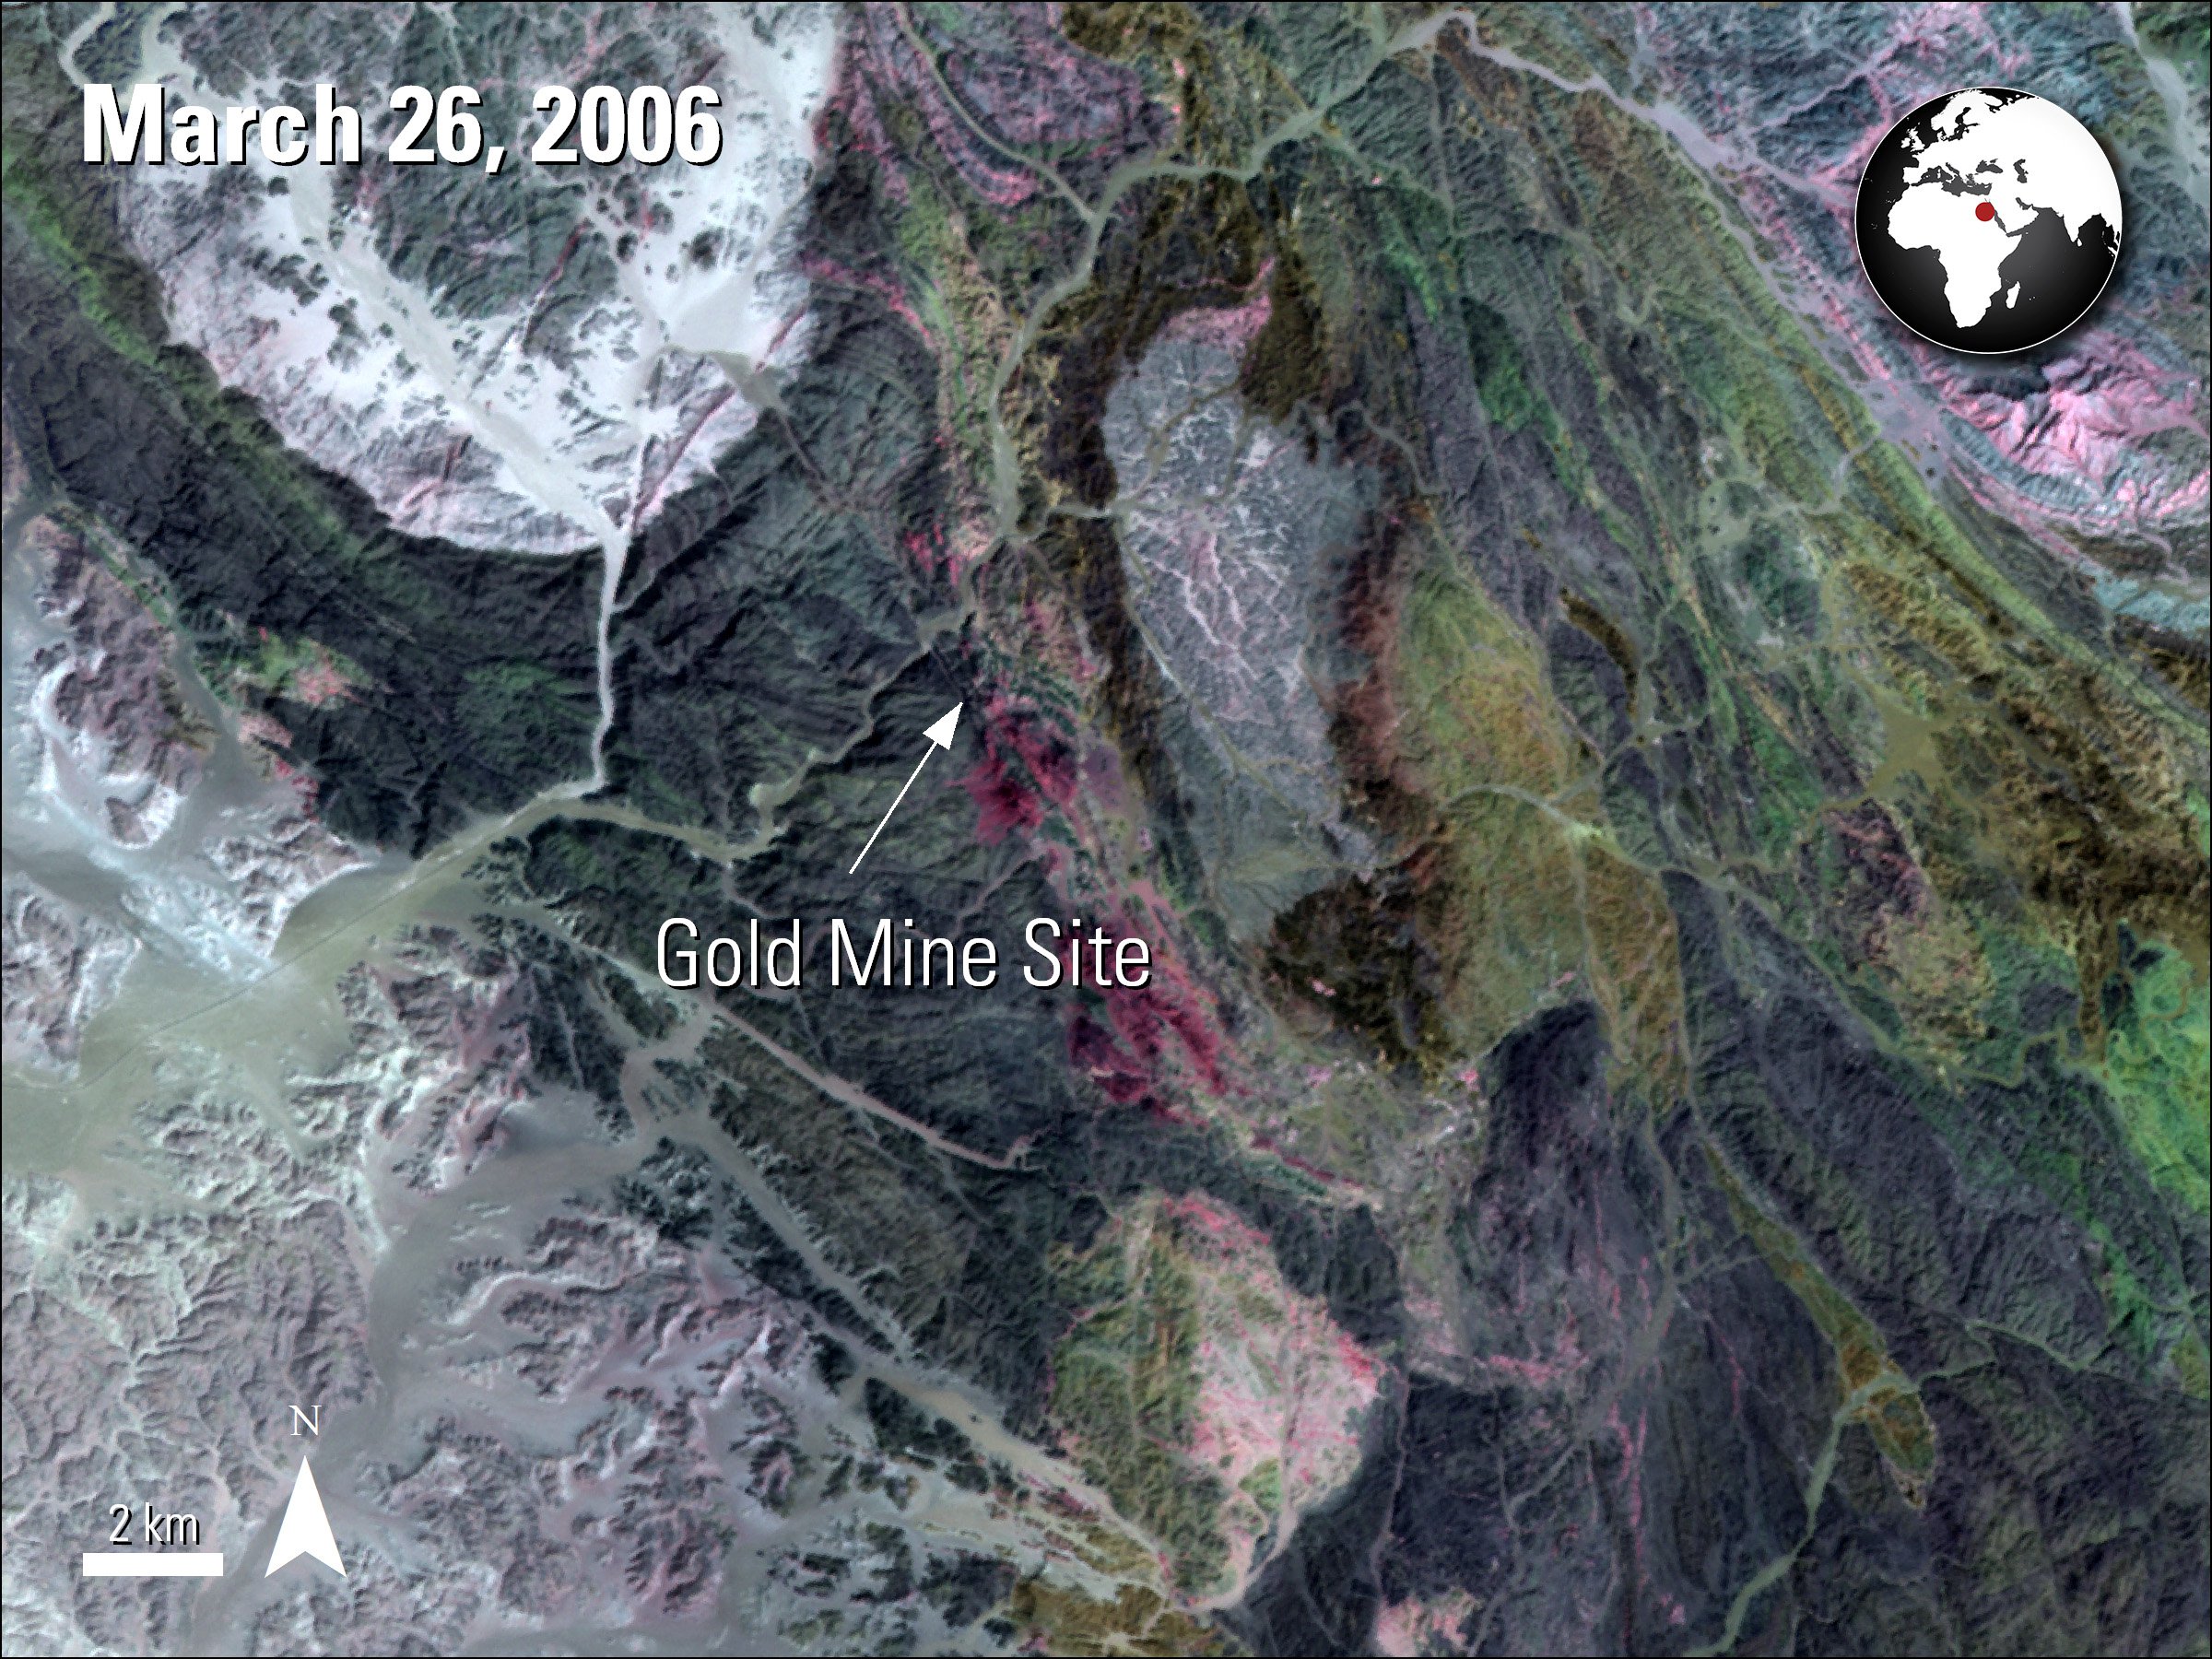
An ASTER reflectance image of the Central Eastern Desert in Egypt showing the SWIR band combination 4-6-8. One example of a potential gold mine site is labeled. This site was identified by the authors’ study and confirmed by GPS.
Granule ID:
AST_07_00303262006083536_20160707081117_11646
An ASTER reflectance image of the Central Eastern Desert in Egypt showing the SWIR band combination 4-6-8. One example of a potential gold mine site is labeled. This site was identified by the authors’ study and confirmed by GPS.
Granule ID:
AST_07_00303262006083536_20160707081117_11646
Hasan, E., Fagin, T., Alfy, Z., and Hong, Y., 2016, Spectral Angle Mapper and aeromagnetic data integration for gold-associated alteration zone mapping—A case study for the Central Eastern Desert Egypt: International Journal of Remote Sensing, v. 37, no. 8, p. 1762-1776. [Also available at http://dx.doi.org/10.1080/01431161.2016.1165887].
Since Predynastic times (3500 BCE), Egyptian miners have been extracting gold from the Central Eastern Desert (CED) in Egypt. Today, researchers are using Terra’s Advanced Spaceborne Thermal Emission and Reflectance Radiometer (ASTER) and Landsat 7 Enhanced Thematic Mapper Plus (ETM+) data to create maps of potential gold mineralization sites. In this study Hasan and others (2016) use the Visible and Near Infrared (VNIR) and Shortwave Infrared (SWIR) bands of the ASTER and ETM+ sensors, along with the spectral curves data of five main alteration minerals from the USGS Spectral Library, to create five Spectral Angle Mapper (SAM) alteration layers using the SAM classification technique. These layers identify alteration types in the region. Using these data in combination with aeromagnetic maps, the authors are able to identify new mineral sites in the CED. The authors use GIS software to create potential gold mineralization site maps and then confirm their results based on GPS readings of existing mineralization sites. This research, and the resulting maps, can be used for future gold exploration and mining activities in the area.
Material written by Danielle Golon1
1 Innovate!, Inc., contractor to the U.S. Geological Survey, Earth Resources Observation and Science (EROS) Center, Sioux Falls, South Dakota, USA. Work performed under USGS contract G15PD00766 for LP DAAC2.
2 LP DAAC Work performed under NASA contract NNG14HH33I.