Data products distributed by the Land Processes Distributed Active Archive Center (LP DAAC) are used in many different Earth science applications. LP DAAC data products play an important role in modeling, detecting changes to the landscape, and assessing ecosystem variables, to name a few. Three of those applications, published between January and March 2020, are highlighted below. A more comprehensive list is available on the LP DAAC Publications webpage.
Yunus, A.P., Fan, X., Tang, X., Jie, D., Xu, Q., and Huang, R., 2020, Decadal vegetation succession from MODIS reveals the spatio-temporal evolution of post-seismic landsliding after the 2008 Wenchuan earthquake: Remote Sensing of Environment, v. 236, art. no. 111541. [Also available at https://doi.org/10.1016/j.rse.2019.111476.]
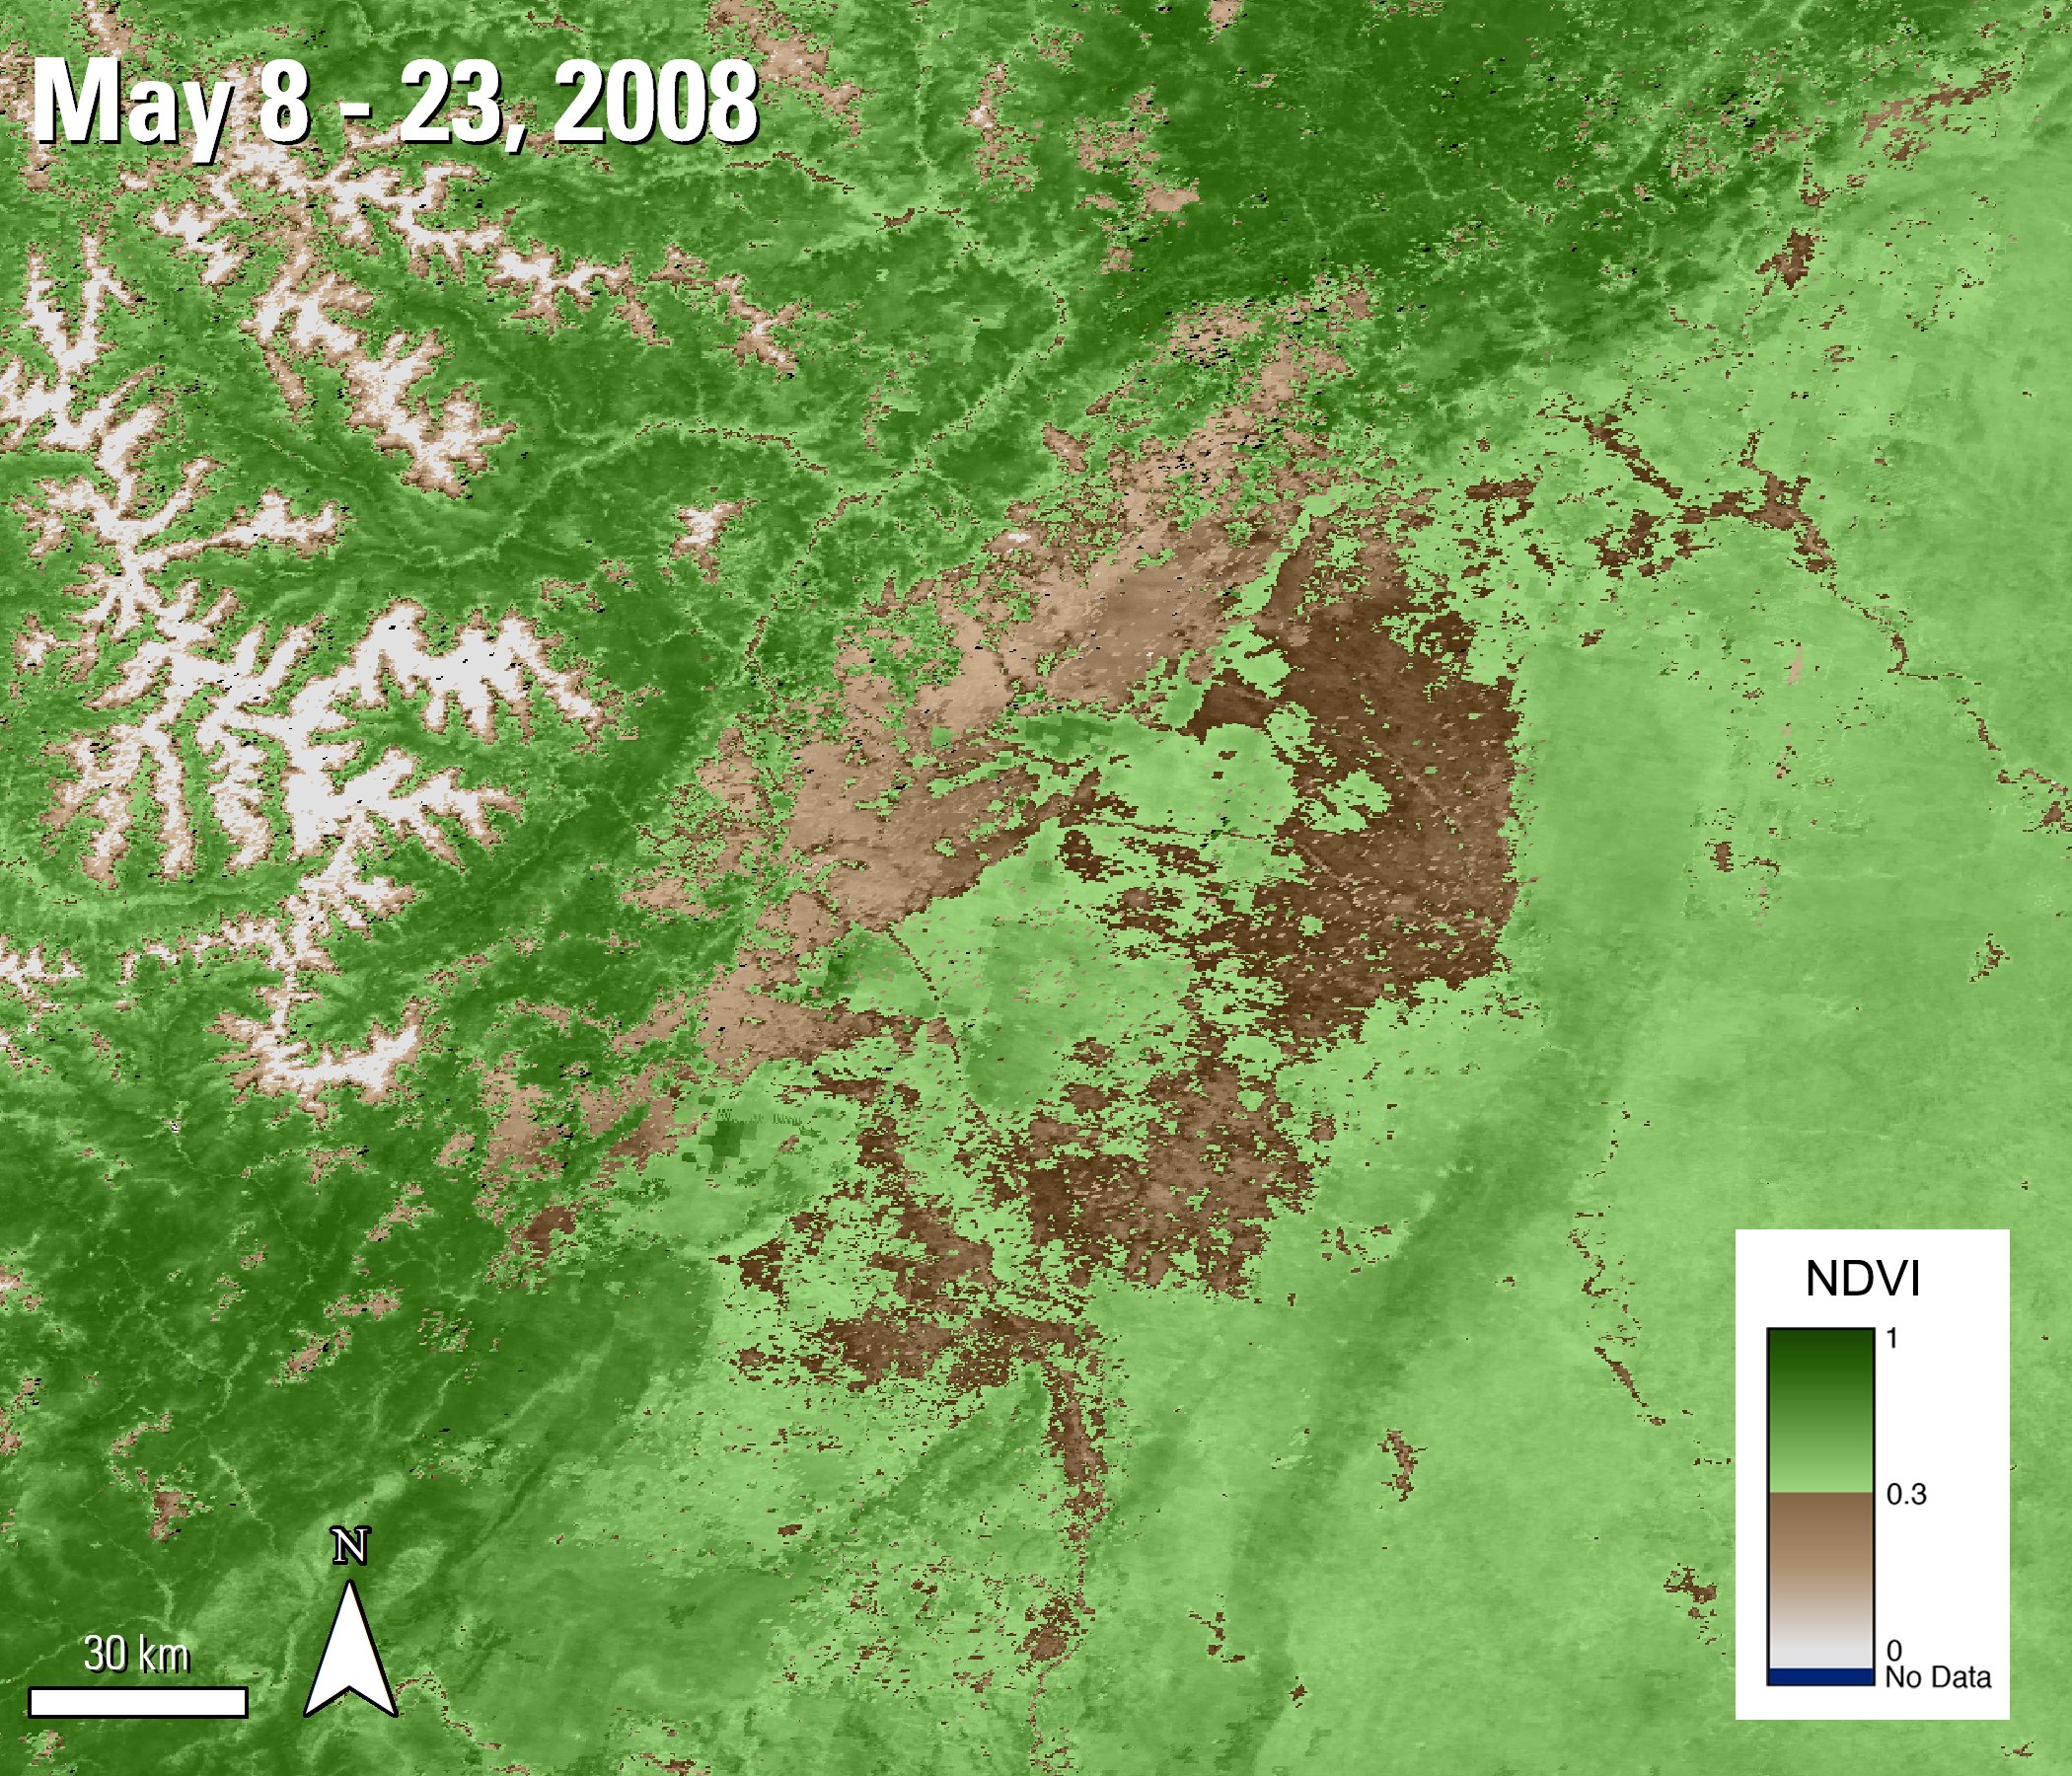
Terra MODIS 16-day NDVI data over the study area from Yunus and others (2020). The data in this scene was captured and composited during the Wenchuan earthquake. The area in the center of the image with shades of brown, indicating lower NDVI values, is near the epicenter of the earthquake.
Granule IDs:
MOD13Q1.A2008129.h26v05.006.2015175092228
MOD13Q1.A2008129.h26v06.006.2015175090917
MOD13Q1.A2008129.h27v05.006.2015175090632
MOD13Q1.A2008129.h27v06.006.2015175090631
Data citation:
Didan, K.. MOD13Q1 MODIS/Terra Vegetation Indices 16-Day L3 Global 250m SIN Grid V006. 2015, distributed by NASA EOSDIS Land Processes DAAC, https://doi.org/10.5067/MODIS/MOD13Q1.006
Strong earthquakes can lead to disturbances on the land, particularly in mountainous areas, that later can lead to landslides during heavy rainfalls years after the earthquake occurred. In this paper, Yunus and others (2020) set out to study post-seismic landslides related to the 2008 Wenchuan earthquake in the Sichuan province of China near Chengdu using 16-day Normalized Difference Vegetation Index data from Terra MODIS (MOD13Q1). This earthquake took place on May 12, 2008. The researchers are using NDVI data from 2000 – 2018 to observe the area prior to the earthquake and then quantify the vegetation recovery after 2008. The authors specifically chose to use the Terra MODIS NDVI data due to the abundance of cloud-free images that are available. A recovery rate (VRR) function is used to quantify the rate of regrowth in the area. The authors found that 83 percent of the vegetation on the co-seismic landslides recovered within a decade after the earthquake. Prior to the earthquake, NDVI values in landslide areas ranged from 0.60 - 0.69, averaging at 0.65. After the earthquake these values dropped to .40. The values slowly increased to .44 by 2010, with a positive trend of the vegetation returning to pre-earthquake values around 2016. Based on the NDVI recovery trend in their research, the authors believe the area may take 18 years for landslides in the area to return to pre-earthquake level.
Yunus and others (2020) used the Application for Extracting and Exploring Analysis Ready Samples (AρρEEARS) to download data for their research project. AppEEARS is an application that can be used to perform data access and transformation processes, including subsetting data spatially, temporally, and by layer. Users can run requests via a point extraction or via an area extraction to mosaic their data to their study area. Visit AppEEARS to learn more.
Batbaatar, J., Gillespie, A.R., Sletten, R.S., Mushkin, A., Amit, R., Liaudat, D.T., Liu, L., and Petrie, G., 2020, Toward the detection of permafrost using land-surface temperature mapping: Remote Sensing, v. 12, no. 4, art. no. 695, at https://doi.org/10.3390/rs12040695.
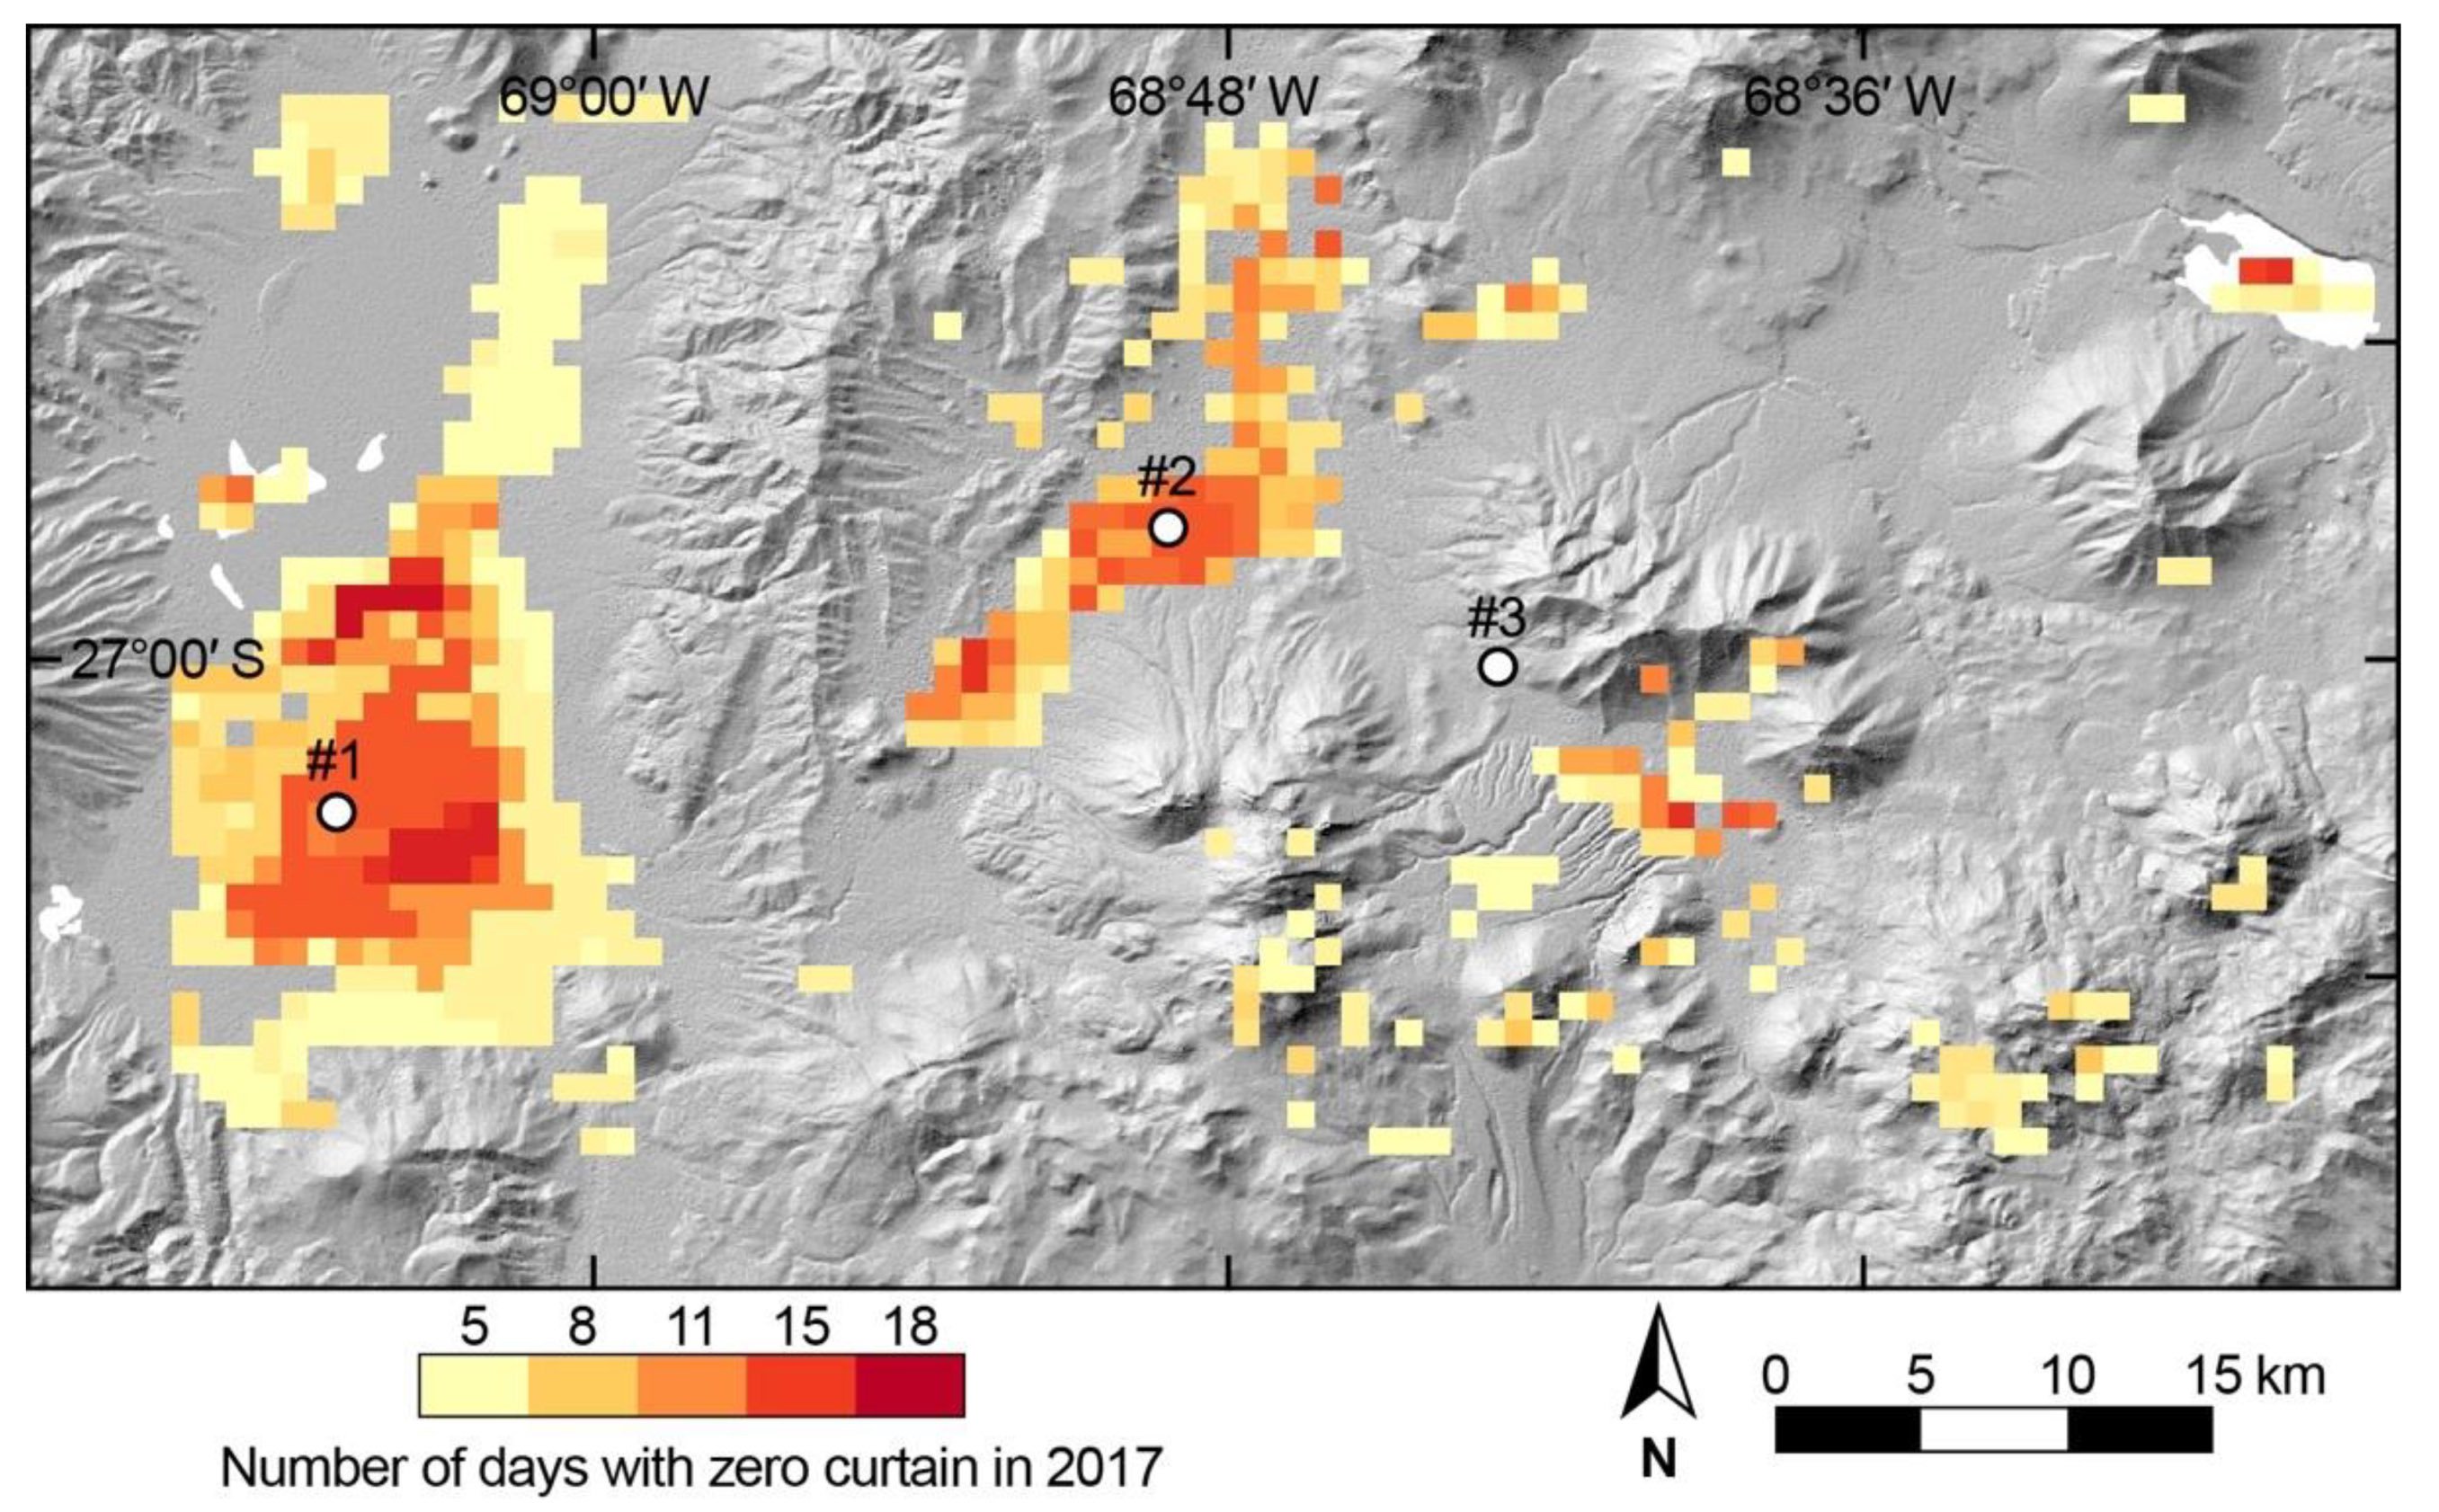
An image from Batbaatar and others (2020). This image shows the number of days with zero curtains during the thaw season of 2017 based on LST data from the Aqua MODIS sensor.
An image from Batbaatar and others (2020). This image shows the number of days with zero curtains during the thaw season of 2017 based on LST data from the Aqua MODIS sensor.
Permafrost, or the sub-surface ground that stays below freezing for more than two years, according to Batbaatar and others (2020), accounts for 1/4th of the land surface of the Earth. Permafrost is currently melting due to the warming of the Earth. This impacts infrastructure above the permafrost, releases carbon into the atmosphere, and can even alter the availability of water in regions. One way to possibly detect if permafrost is in a region is to identify if a “zero curtain” exists: moist frozen soils remain at a ~0°C (32°F) isothermic temperature during seasonal freeze and thaw. This paper investigates whether remote sensing data can be used to detect and map the zero curtain as a precursor to identifying and mapping permafrost. The authors use daily Aqua MODIS land surface temperature (LST) (MYD11A1) data from 2003 to 2017 to identify the zero curtain in three test sites in the Atacama Andes near the Ojos del Salado volcano along the border of Chile and Argentina. Terra ASTER surface kinetic temperature (AST_08) and registered radiance at sensor (AST_L1B) are also used to evaluate the changes on the surface and temperature of the land in a single MODIS pixel. The authors developed an algorithm to be used with MATLAB to analyze and test the MODIS data to indicate if there was an occurrence of zero curtain or not. Two maps were created showing thawing and freezing seasons during the study period based on results from a Threshold Window algorithm. A significant difference between thawing and freezing seasons was found based on the number of pixels where zero curtains were detected. The authors also found that the areas with zero curtains during the freezing season remained constant throughout the study, while areas with zero curtains during the thaw season increased throughout the study. However, in many cases throughout the test sites and study period, zero curtains were observed during only one season. The authors validated their findings with in-situ measurements and found the MODIS LST values agreed with the in-situ data during the warmer seasons. Based on their algorithm and results, the authors believe zero curtains can be consistently identified using the MODIS data, which will allow future researchers to identify and monitor ice-rich permafrost. In the future, the authors believe a data fusion between the Aqua MODIS LST data and Terra ASTER or ECOSTRESS data can be accomplished in order to map pixels at a finer resolution, allowing their threshold window algorithm to account for small-scale changes in the land surface and topography.
Hewson, R., Mshiu, E., Hecker, C., Van Der Werff, H., Alkema, D., and Van Der Meer, F., 2020, The application of day and night time ASTER satellite imagery for geothermal and mineral mapping in East Africa: International Journal of Applied Earth Observation and Geoinformation, v. 85, art. no. 101991. [Also available at https://doi.org/10.1016/j.jag.2019.101991.]
Images from Hewson and others (2020).
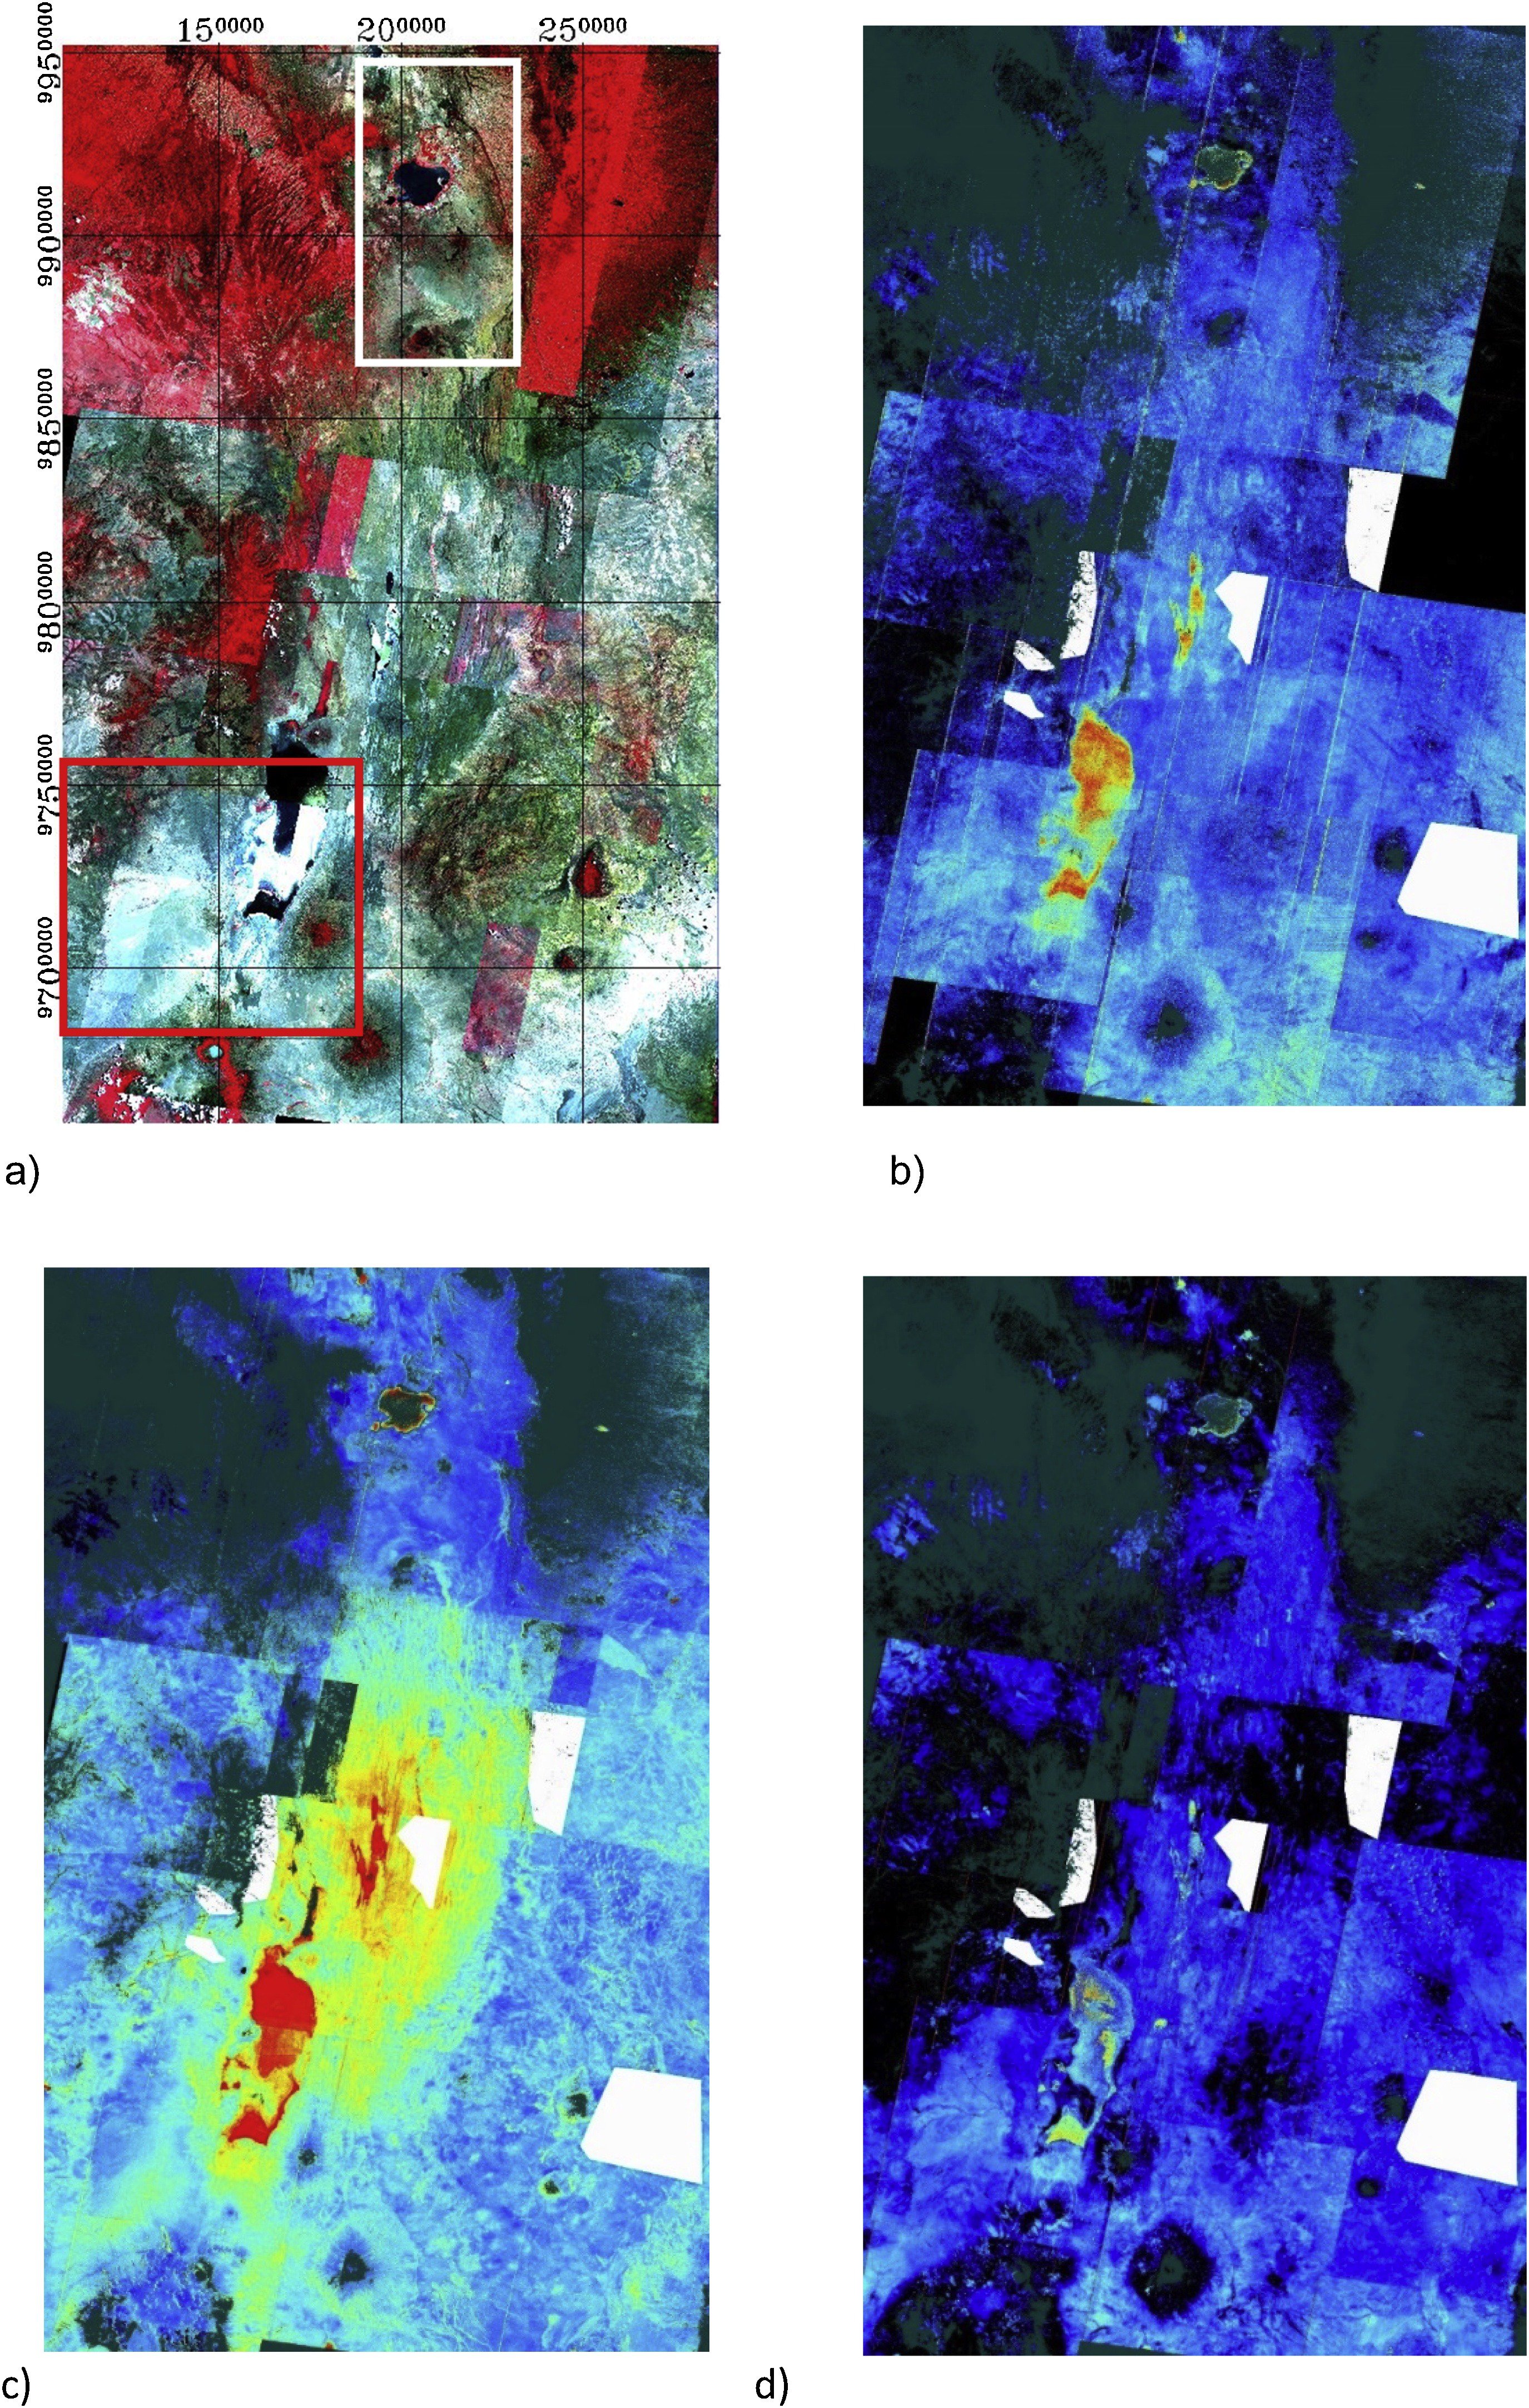
Figure a) shows the study area using the mosaicked ASTER data with the band combination 3, 2, and 1. Two study sites are highlighted: the Kenyan geothermal fields (white box) and Lake Natron (red box).
Figure b) highlights opal content in the study area using band ratio values 0.95-1.1.
Figure c) highlights MgOH-carbonate in the study area using a band ratio values 0.95-1.1 2.1-2.8.
Figure d) highlights ferrous iron in the study area using band ratio values .05-1.10.75-1.2
Images from Hewson and others (2020).
Figure a) shows the study area using the mosaicked ASTER data with the band combination 3, 2, and 1. Two study sites are highlighted: the Kenyan geothermal fields (white box) and Lake Natron (red box).
Figure b) highlights opal content in the study area using band ratio values 0.95-1.1.
Figure c) highlights MgOH-carbonate in the study area using a band ratio values 0.95-1.1 2.1-2.8.
Figure d) highlights ferrous iron in the study area using band ratio values .05-1.10.75-1.2
Hewson and others (2020) examine mapping minerals in the East African Rift system along the border of Tanzania and Kenya using data from the Terra ASTER satellite sensor. The authors specifically chose to use the Terra ASTER surface reflectance visible and near infrared (VNIR) and crosstalk corrected shortwave infrared (SWIR) data product (AST_07XT) to map mineral composition because the XT product minimizes the reflected light interference between the SWIR array detectors that could impact data from this region. In this paper the authors highlight several band combinations and calculations that can be used to detect iron oxides, vegetation cover, changes in clay compositions, and more using the crosstalk corrected product. The Terra ASTER surface kinetic temperature (AST_08) data product was used to map thermal anomalies that can be indicators of different types of minerals in the area, including argillic clays, calcite, and silica. Using the data, the authors found occurrences of trona, opaline silica, and argillic clays, among other minerals, within their study area. The results from the study showed that Terra ASTER data can be used to differentiate surface composition and temperatures to map minerals. However, the authors note it is important to have a basic geological understanding of the study area to complete a full identification analysis from the ASTER image processing to reduce any ambiguous results. The authors believe their method provides a cost-effective, large-scale mapping technique that can complement current in-situ geophysical and geochemical techniques. In the future, the researchers believe the research should be expanded to include more field site observations and sampling for later spectral and X-ray diffraction mineral analysis.
Material written by Danielle Golon1
1 Innovate!, Inc., contractor to the U.S. Geological Survey, Earth Resources Observation and Science (EROS) Center, Sioux Falls, South Dakota, USA. Work performed under USGS contract G15PC00012 for LP DAAC2.
2 LP DAAC work performed under NASA contract NNG14HH33I.