(Author's Note 2/25/2022: At the time of publishing these references were available online, some resources may no longer be available.)
Data products distributed by the Land Processes (LP) Distributed Active Archive Center (DAAC) are used in many different applications. They play an important role in modeling, helping to detect changes to the landscape, and assessing ecosystem variables, to name a few. Three of those applications, published between July and September 2017, are highlighted below. A more exhaustive, albeit not complete, list can be accessed via the LP DAAC Publications webpage.
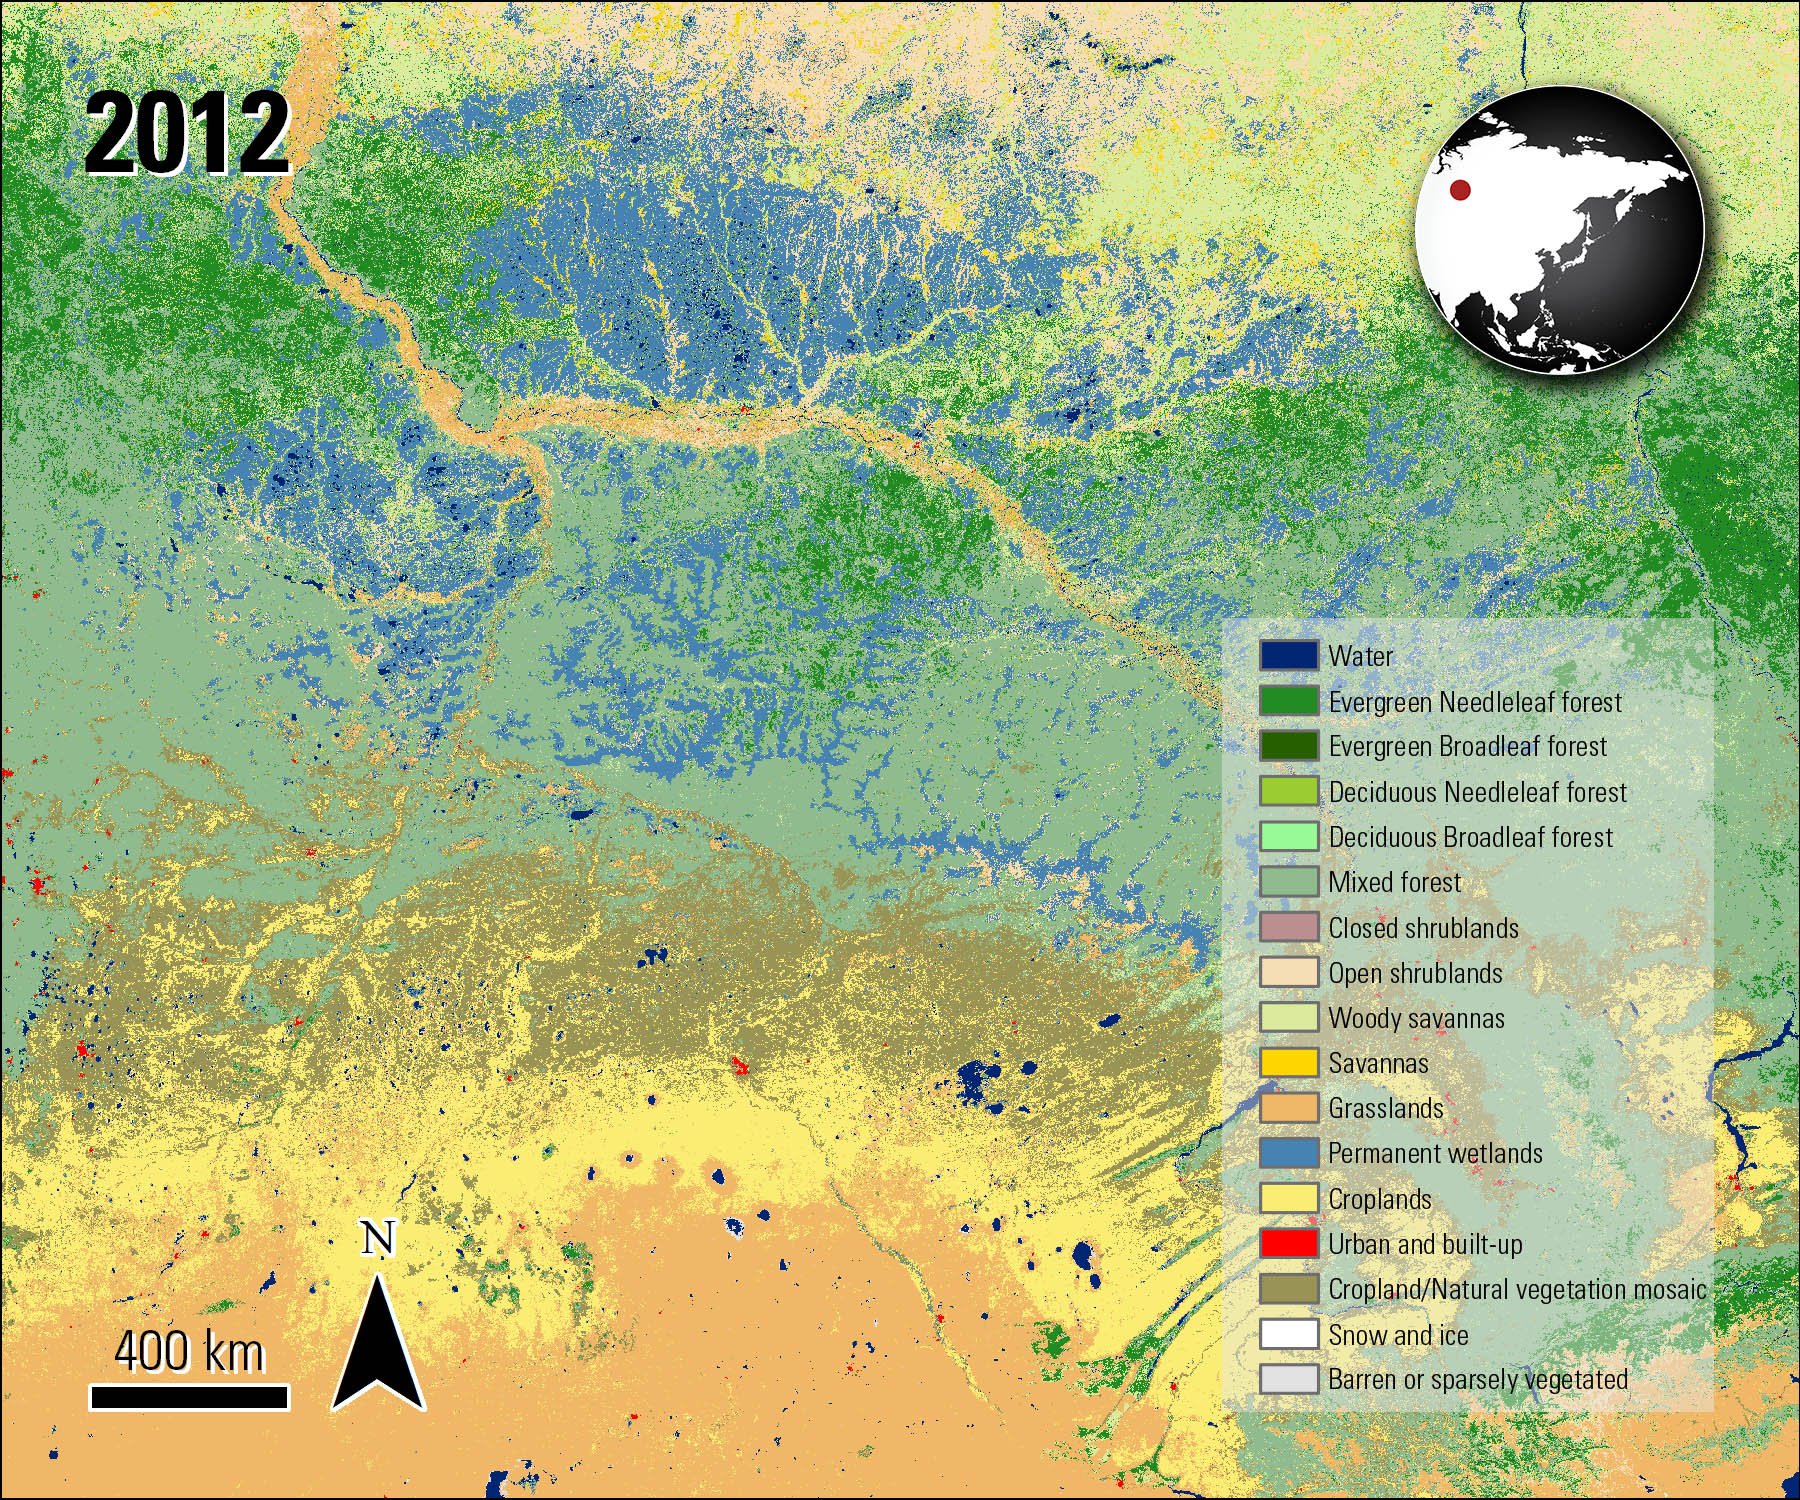
A portion of the study area from He and others (2017) is shown in this MODIS Land Cover image from 2012. In this image you can see some of the evergreen forest (green) near the top of the image and some of the deciduous forest (dark green) toward the bottom.
Granule IDs:
MCD12Q1.A2012001.h24v04.051.2014288202436
MCD12Q1.A2012001.h21v03.051.2014288201909
MCD12Q1.A2012001.h21v02.051.2014288201906
MCD12Q1.A2012001.h22v02.051.2014288202054
MCD12Q1.A2012001.h22v03.051.2014288202106
MCD12Q1.A2012001.h23v04.051.2014288202306
MCD12Q1.A2012001.h20v02.051.2014288201706
MCD12Q1.A2012001.h23v03.051.2014288202253
He, Y., Huang, J., Shugart, HH., Guan, X., Wang, B., and Yu, K., 2017, Unexpected Evergreen Expansion in the Siberian Forest under Warming Hiatus: Journal of Climate, v. 30, no. 14, p. 1114–1136. [Also available at https://doi.org/10.1175/JCLI-D-16-0196.1].
In this paper, He and others (2017) examine changes in the Siberian Forest using several Moderate Resolution Imaging Spectroradiometer (MODIS) data products and other data sources. Overall, the forest has been experiencing a warming period over the past several decades. However, during recent winters the forest has experienced a significant cooling period, which was 10 times cooler than what all of the Northern Hemisphere experienced at the same time. The forest is seeing an increase in evergreen conifers due to the warming period; however, evergreen conifers typically do not fare well during the colder winters. The temperatures can cause damage to the trees and increase the mortality of younger evergreens in the forest. The authors use the MODIS Land Cover data product (MCD12Q1) for 2001 to 2012 to examine how these trees respond to temperature cooling in the forest. Over the study period, the amount of evergreen conifer forest area has increased and expanded by 10 percent, in contrast to the deciduous conifer forest, which decreased by 40 percent. The authors use the MODIS Burned Area Product (MCD45A1) and the Global Fire Emissions Database to examine if fire is the cause of the transition from deciduous to evergreen forest. The results show that fires did not occur near the regions of evergreen or deciduous forests within the Siberian Forest. The authors decided to further investigate using the land cover map after fires were determined to not be the cause of the transition. They determined that the new evergreen forests began to occupy buffer areas in forests that were previously home to mixed forests and woody savannas. The authors then use the Terra MODIS Vegetation Continuous Fields (VCF) (MOD44B) data product to confirm this conclusion. In the future, the authors recommend using albedo data to possibly help distinguish the extent of evergreen and deciduous conifer forests. The authors note that while the winter cooling period was extreme, it was still warmer than the previous cooling hiatus of 1940 to 1960. They believe a severe increase in evergreen conifers is possible in the future with this increase in warmth during the normal cooling hiatus, combined with a projected global surface temperature rise of 4 – 10°C (7.2– 18°F) in the area. However, further research on fire, permafrost, and drought in the region would need to be examined to create a future projection of the forest composition.
Note: In this study, the authors use the MODIS Land Cover Version 5.1 data product. The Version 6 product has since been released.
Boundary source:
Global Administrative Unit Layers (GAUL) dataset, implemented by FAO within the CountrySTAT and Agricultural Market Information System (AMIS) projects
Granule IDs:
MOD09A1.A2011217.h18v08.2015221113527
MOD09A1.A2011217.h19v07.2015221113508
MOD09A1.A2011217.h18v06.2015221113015
MOD09A1.A2011217.h19v06.2015221113015
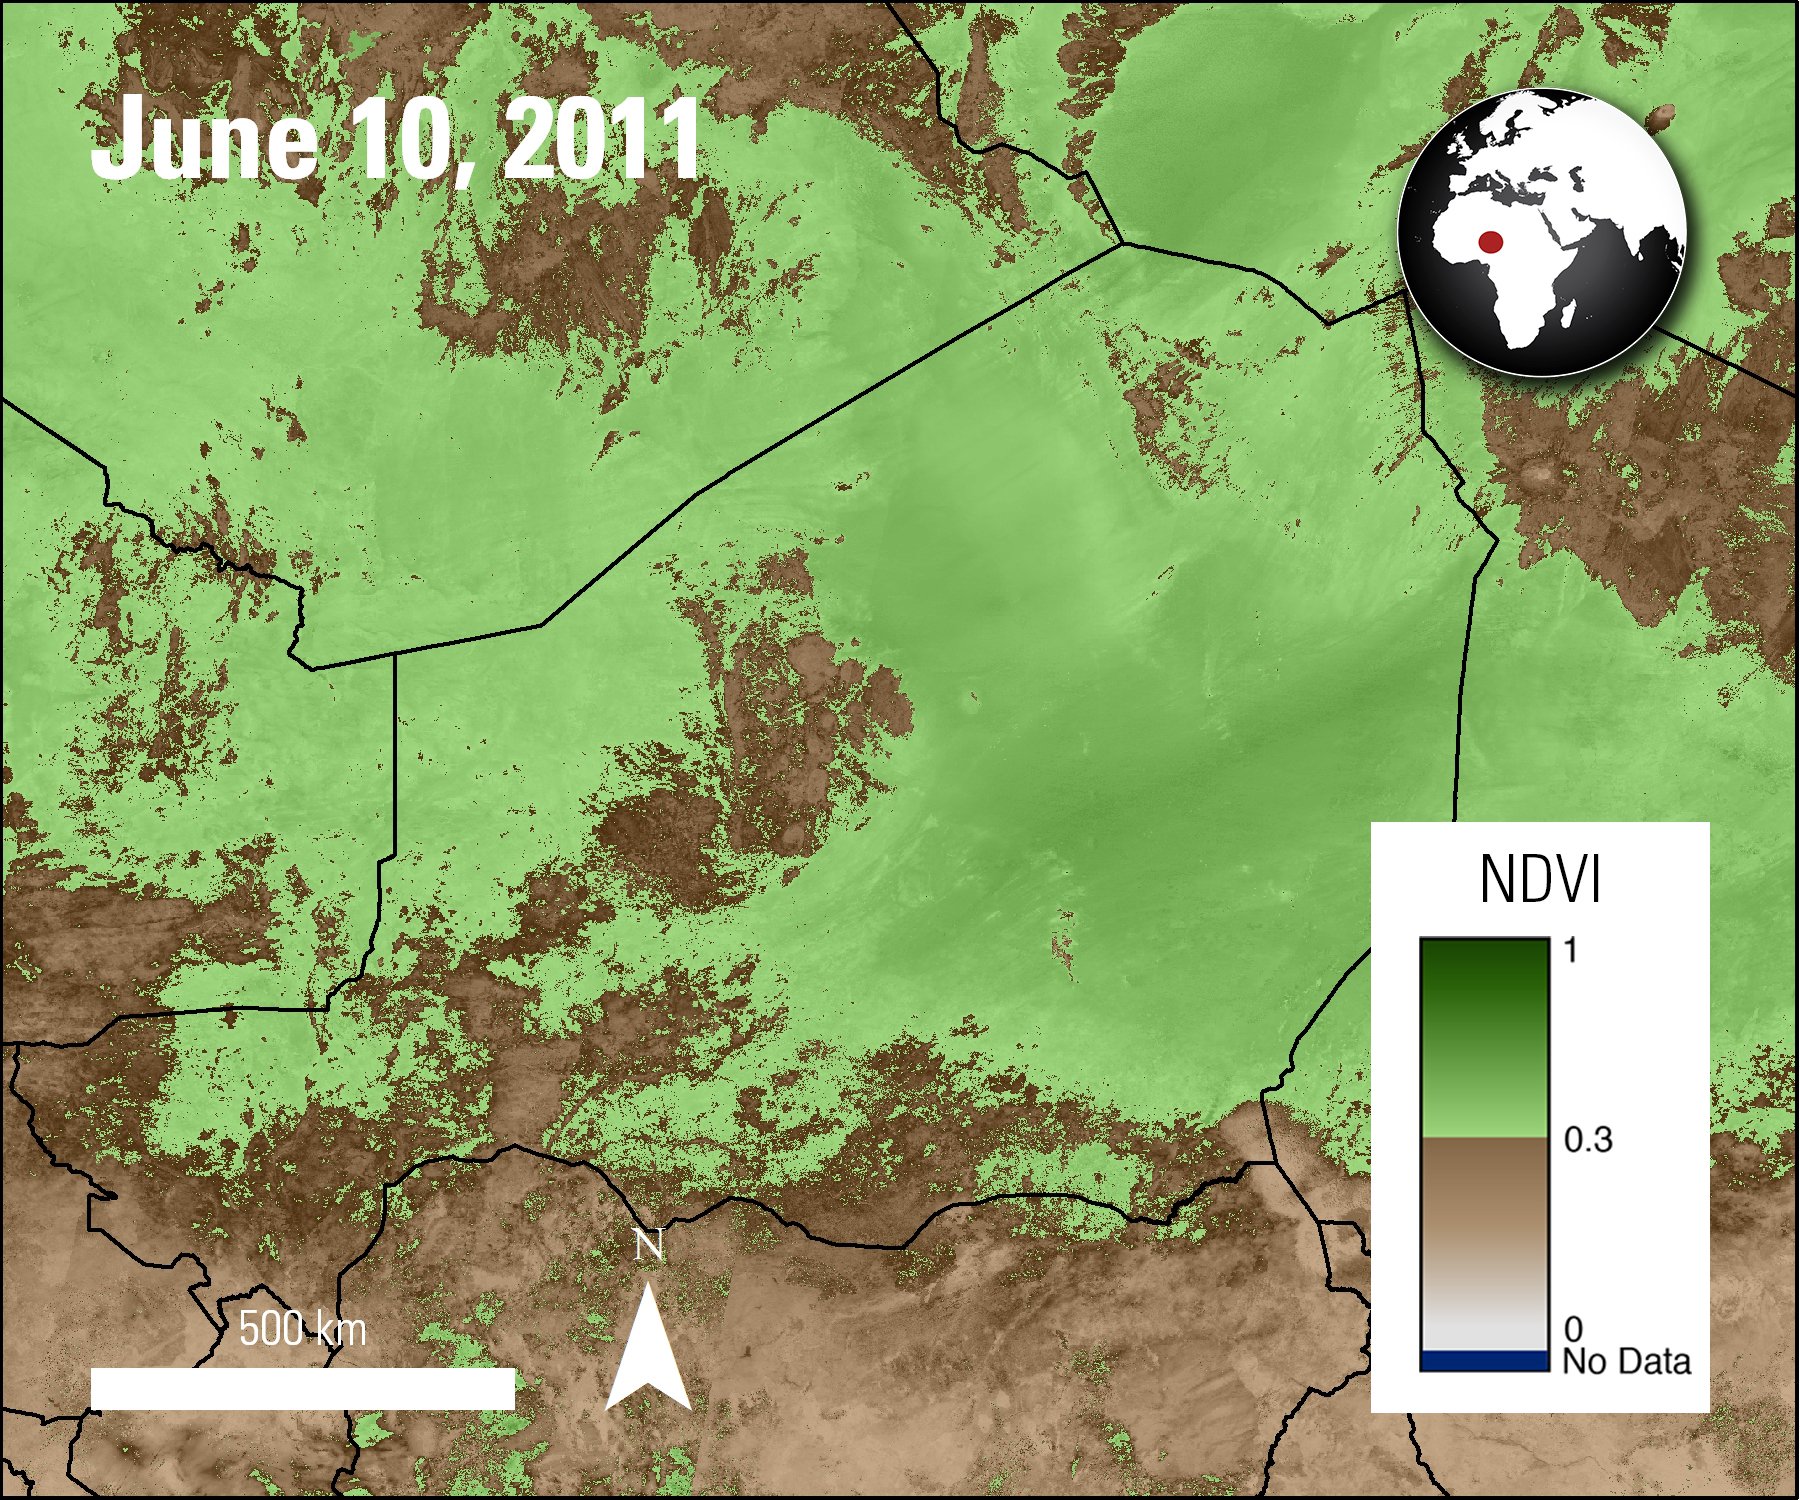
Winkler, Karina, Ursula Gessner, and Volker Hochschild, 2017, Identifying droughts affecting agriculture in Africa based on remote sensing time series between 2000-2016—Rainfall anomalies and vegetation condition in the context of ENSO: Remote Sensing v 9, no. 831. [Also available at https://doi.org/10.3390/rs9080831 ].
Winkler and others (2017) use MODIS Surface Reflectance Data (MOD09A1) to observe large-scale droughts across Africa from 2000-2016. Field data, which provide records of climatological variables such as rainfall and temperature, have many geographic and temporal gaps. However, MODIS data, which provide daily, global coverage, can help to bridge these gaps. MODIS Surface Reflectance and other remotely sensed data are used in this paper to calculate Normalized Difference Vegetation Index (NDVI) and other vegetation indices that help show how agricultural crop growth was stunted from these droughts. For instance, in 2011, many areas of Somalia experienced drought conditions that lasted longer than 60% of their usual growing season, leading to decreases in agricultural yields. Frequent observation periods from MODIS data help the authors show how many of these droughts occur during a specific stage of the El Niño Southern Oscillation (ENSO), with some droughts occurring in both its El Niño and La Niña stage. Africa spans the Northern and Southern Hemisphere and is home to a vast array of climate zones. MODIS and other large scale geographic data help the authors to show how regions with shorter growing seasons and limited water supply, are more impacted by droughts than other regions. The authors conclude that the use of multiple remote sensing data, including MODIS data, will continue to help show how precipitation patterns and vegetation growth is impacted during each stage of ENSO, and other drought-causing events.
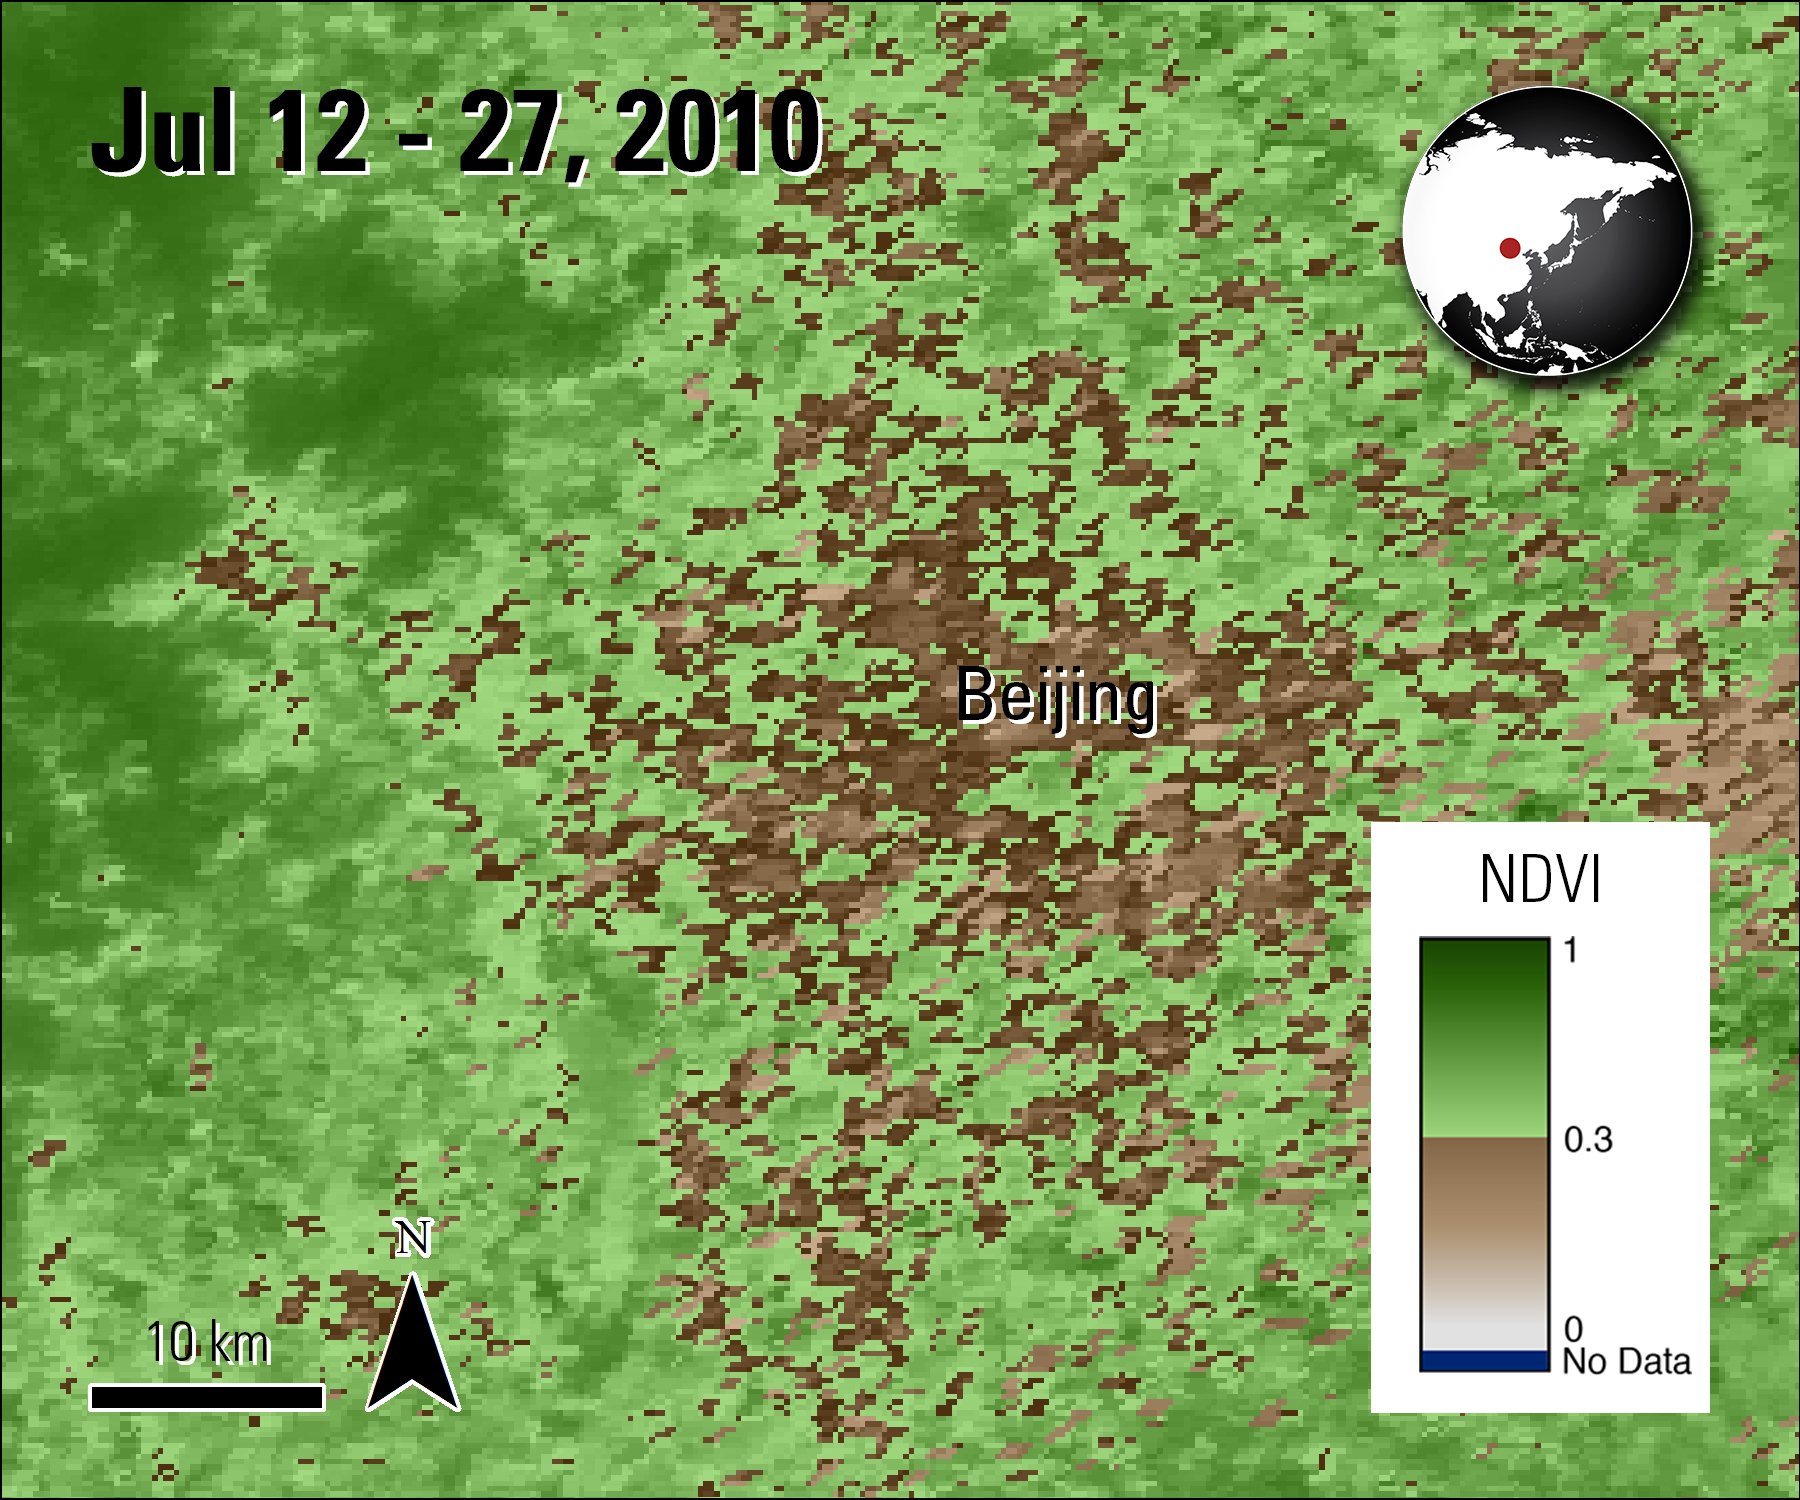
A Terra MODIS NDVI image of Beijing, China, and the surrounding area during the study period.
Granule IDs:
MOD13Q1.A2010193.h26v05.006.2015209100212
MOD13Q1.A2010193.h26v04.006.2015209104934
DOI:
10.5067/MODIS/MOD13Q1.006
A Terra MODIS NDVI image of Beijing, China, and the surrounding area during the study period.
Granule IDs:
MOD13Q1.A2010193.h26v05.006.2015209100212
MOD13Q1.A2010193.h26v04.006.2015209104934
DOI:
10.5067/MODIS/MOD13Q1.006
Dong, S., Hong, L., and Sun, D., 2017, Fractal feature analysis and information extraction of woodlands based on MODIS NDVI time series: Sustainability, v. 9, no. 30, p. 1114–1136. [Also available at http://dx.doi.org/10.3390/su9071215].
Dong and others (2017) set out to create an extraction method based on fractal features that was both low-cost and high-precision for extracting large woodland areas in Beijing, China, from MODIS Normalized Difference Vegetation Index (NDVI) (MOD13Q1) data during 2010. The authors specifically look at the variation in NDVI over the time series. The authors use a blanket method to compute the upper and lower fractal signs for each pixel in the NDVI data. They also extracted the spatial distributions of the woodlands using the Iterative Self-Organizing Data Analysis (ISODATA) technique. The extracted results were then assessed for accuracy using a confusion matrix and error coefficient. The authors find the overall accuracy to be 90.54 percent, the kappa coefficient to be 0.74, and the error coefficient to be 8.17 percent. Based on their results, the authors state that this extraction method is effective for extracting information, pattern recognition, and image classification of woodlands. The authors believe the extraction method created in this study achieved what they set out to do: create an efficient and quick way to extract information on woodlands from low spatial resolution remote sensing data. This method is currently being used to extract data about woodlands, which is then used to evaluate the effects of several Chinese government reforestation projects. In the future, the authors believe this study can provide decision-making woodland management and sustainable use teams with essential information to understand current conditions of the woodlands and to study woodland expansion.
Authors note: Since the time of publication the MCD45A1 product has been replaced with the MCD64A1 product.
Material written by Danielle Golon1 and Cory Alden1
1 Innovate!, Inc., contractor to the U.S. Geological Survey, Earth Resources Observation and Science (EROS) Center, Sioux Falls, South Dakota, USA. Work performed under USGS contract G15PC00012 for LP DAAC2.
2 LP DAAC Work performed under NASA contract G15PD00467.