Data products distributed by the Land Processes (LP) Distributed Active Archive Center (DAAC) are used in many different applications. They play an important role in modeling, help to detect changes to the landscape, and are a way to assess ecosystem variables, to name a few. Three of those applications, published between July and September 2020, are highlighted below. A more exhaustive, albeit not complete, list can be accessed via the LP DAAC Publications webpage.
Wanyama, D., Moore, N.J., and Dahlin, K.M., 2020, Persistent vegetation greening and browning trends related to natural and human activities in the Mount Elgon ecosystem: Remote Sensing, v. 12, no. 13, art. no. 2113, at https://doi.org/10.3390/rs12132113
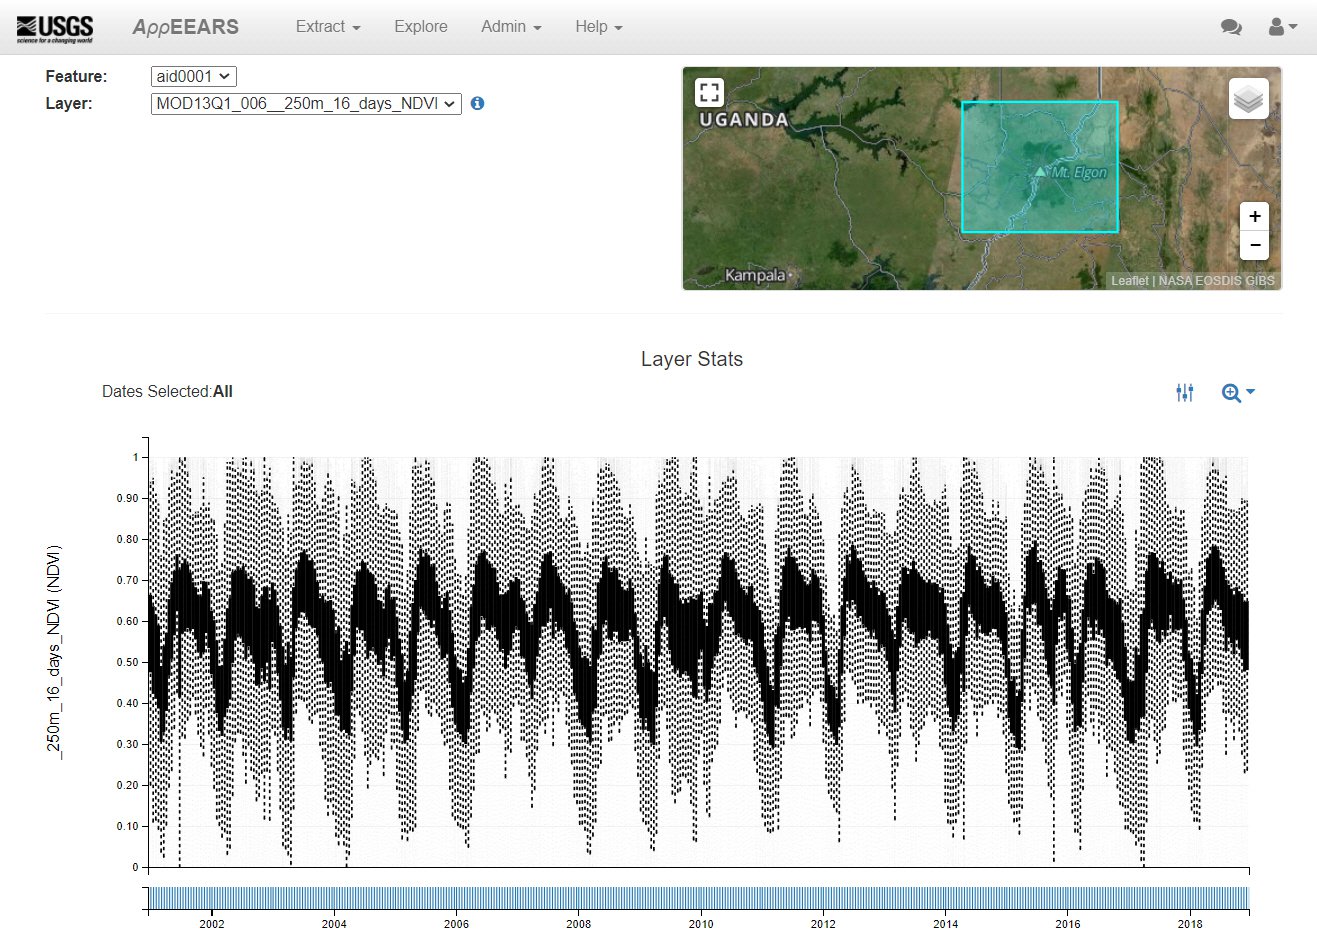
AppEEARS View Area Sample page (AppEEARS Team, 2020) showing a boxplot time series of Terra MODIS NDVI over Mt. Elgon from 2001–2018, the same subset used in Wanyama and others (2020).
Data and Tool Citation
AppEEARS Team, 2020, Application for Extracting and Exploring Analysis Ready Samples (AppEEARS), Ver. 2.48: NASA EOSDIS Land Processes DAAC, accessed November 4, 2020, at https://appeears.earthdatacloud.nasa.gov/.
Didan, K., 2015, MOD13Q1 MODIS/Terra Vegetation Indices 16-Day L3 Global 250m SIN Grid V006: NASA EOSDIS Land Processes DAAC, accessed October 28, 2020, at https://doi.org/10.5067/MODIS/MOD13Q1.006.
Expanding populations lead to a higher demand for food and natural resources, which drive agricultural and other land cover/land use changes (LCLUC) in many regions of the world. In regions with high interannual climate variability and a dependence on rainfed agriculture, this can be a recipe for severe food insecurity. There is a need to better understand the long term impacts of climate change and shorter term impacts of anthropogenic activities (i.e. LCLUC) on vegetation trends (greening/browning) to inform policy decisions that can help conserve the environment and improve communities that depend on it. The Mt. Elgon ecosystem (MEE) straddles the border between Uganda and Kenya and was recently studied by Wanyama and others (2020) to characterize greening/browning trends in vegetation on a multi-temporal scale from 2001–2018.
The researchers investigated spatio-temporal patterns in the Normalized Difference Vegetation Index (NDVI) from the Terra Moderate Resolution Imaging Spectroradiometer (MODIS) Vegetation Indices 250 meter (m) 16-day composited product (MOD13Q1.006) at multi-temporal scales (10-day, 16-day, and seasonal) using an integration of Mann-Kendall, Sen’s slope, and the Breaks for Additive Season and Trend (bfast) algorithms. They included precipitation data from the Climate Hazards Group Infrared Precipitation with Stations data product to disentangle human-driven vs. natural vegetation changes. Combined Terra and Aqua MODIS Annual Land Cover Type (MCD12Q1.006) data from 2018 was also used to classify land cover types in the region. The MODIS NDVI data were extracted using NASA’s Application for Extracting and Exploring Analysis Ready Samples (AppEEARS). The authors describe performing a quality assessment of the MODIS NDVI data using the quality layer to exclude poor quality pixels from the analysis.
After applying the integrated Mann-Kendall, Sen’s slope, and bfast algorithms on the time series, the authors found that vegetation in the MEE is highly variable, with greening and browning being observed at all time scales. Using multiple algorithms helped detect different changes. The Mann-Kendall and Sen’s slope approach revealed major changes related to forest gain/loss, while the bfast approach observed more subtle changes, including vegetation degradation. The authors found that certain changes could be attributed to natural (precipitation) and anthropogenic (particularly vegetation to cropland LCLUC) factors. This work characterizes MEE vegetation dynamics, which can inform policy decisions that will both help conserve the environment and protect the livelihoods of the communities dependent on this region for agriculture.
Marino, E., Yebra, M., Guillén-Climent, M., Algeet, N., Tomé, J.L., Madrigal, J., Guijarro, M., and Hernando, C., 2020, Investigating Live Fuel Moisture Content estimation in fire-prone shrubland from remote sensing using empirical modelling and RTM simulations: Remote Sensing, v. 12, no. 14, art. no. 2251, at https://doi.org/10.3390/rs12142251.
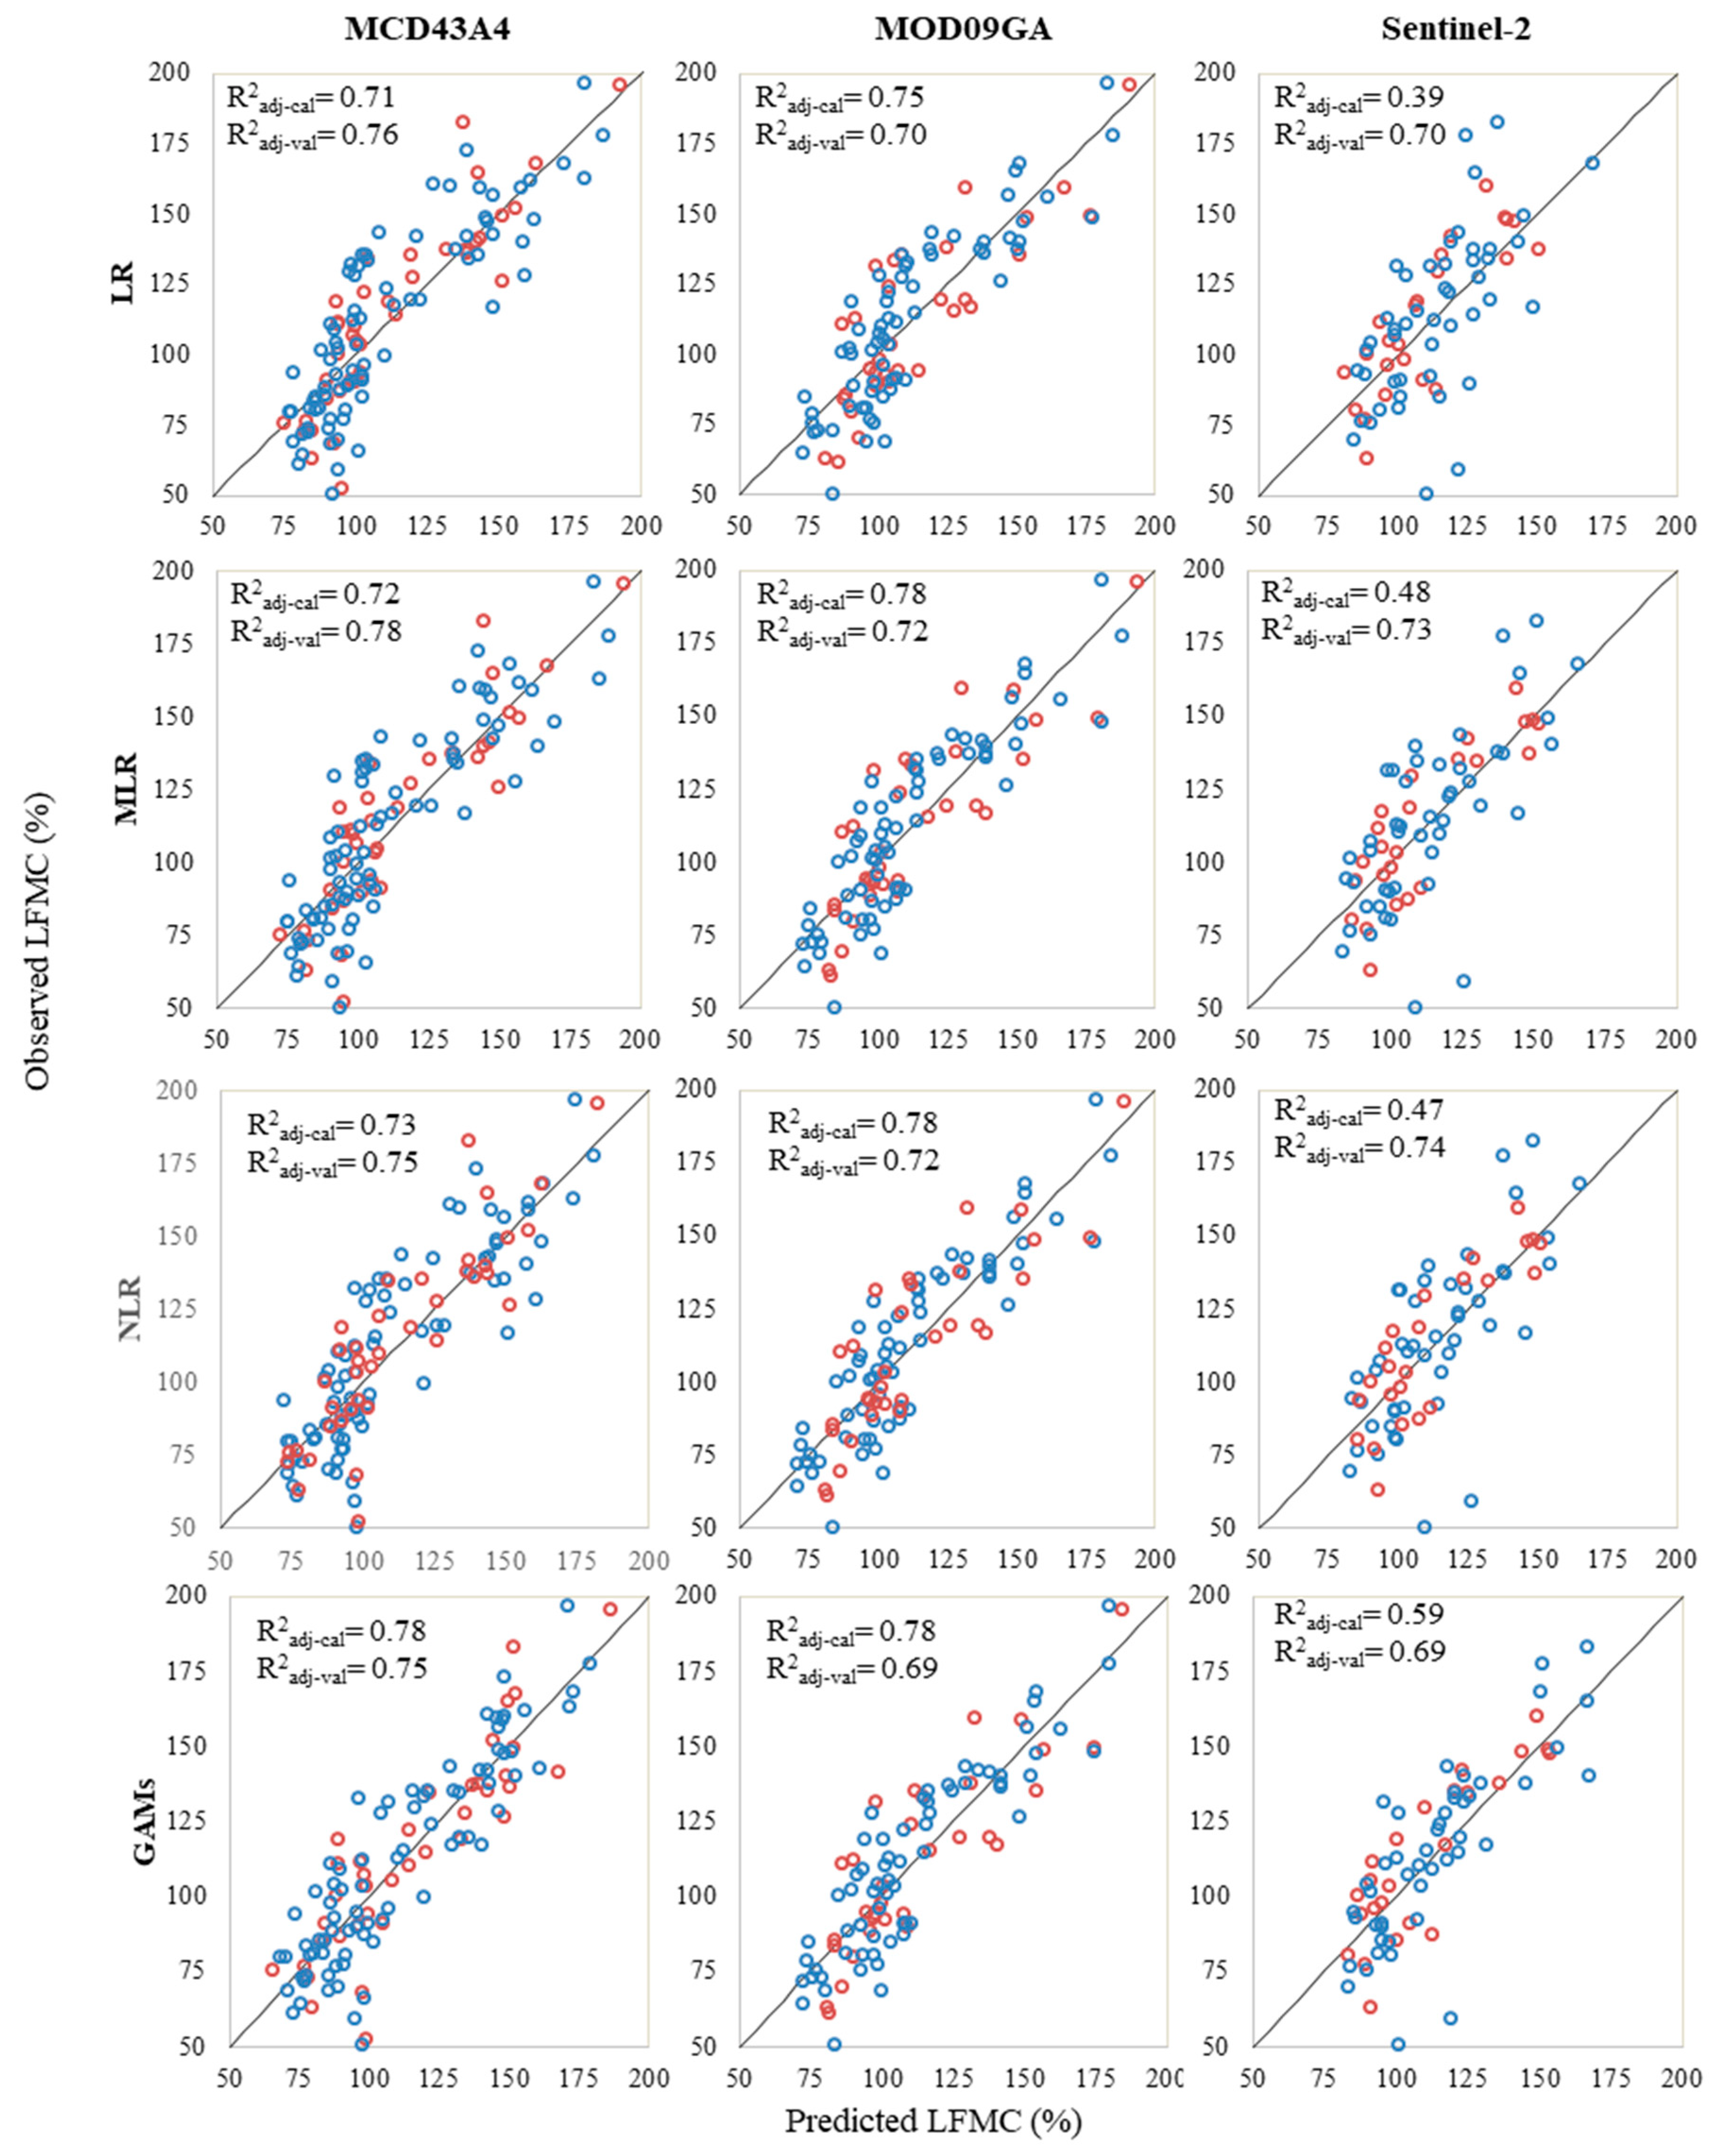
Graphs from Marino and others (2020) showing plots of observed Live Fuel Moisture Content (LFMC) vs. predicted LFMC using the empirical models for each sensor dataset. Blue circles relate to calibration data and the red circles refer to validation data.
Graphs from Marino and others (2020) showing plots of observed Live Fuel Moisture Content (LFMC) vs. predicted LFMC using the empirical models for each sensor dataset. Blue circles relate to calibration data and the red circles refer to validation data.
Fuel characteristics such as vegetation moisture content substantially impact wildfire activity. Live Fuel Moisture Content (LFMC) is a key indicator of the flammability of vegetation, fire behavior, severity, and is an important parameter of wildfire models. Accurately estimating LFMC improves operational fire management activities for prevention and suppression of wildfire in addition to emergency responses. A common strategy for assessing wildfire risk is to launch field campaigns that survey fire-prone plant species (indicator species); however, these campaigns are expensive and time-consuming. Marino and others (2020) investigated the potential for using remotely sensed data to estimate LFMC for large-scale fire risk assessments in the Madrid region in Central Spain.
The researchers utilized the Combined Terra and Aqua Moderate Resolution Imaging Spectroradiometer (MODIS) Nadir Bidirectional Reflectance Distribution Function (BRDF)-Adjusted Reflectance (NBAR) Daily L3 Global 500m product (MCD43A4.006), Terra MODIS Surface Reflectance L2G 500m/1000m product (MOD09GA.006), and Sentinel-2 Multi-Spectral Instrument (MSI) top of the atmosphere reflectance to calibrate models for the estimation of LFMC. Spectral indices (SI), including Normalized Difference Vegetation Index (NDVI), Enhanced Vegetation Index (EVI), Normalized Difference Infrared Index (NDII), and Normalized Difference Water Index (NDWI) were derived using the MODIS and Sentinel-2 data and used to calibrate the models. Reference data for the study area was gathered from 143 field samples where Cistus ladanifer, an indicator species, was used to determine the LFMC (the percentage of water content of vegetation on a dry-weight basis).
Multiple types of empirical models were leveraged, including linear regression (LR), multivariate linear regression (MLR), non-linear regression (NLR), and general additive models with splines (GAMs), to estimate LFMC from the derived SI. LFMC is also estimated using a radiative transfer model (RTM), and LFMC estimations from empirical and physically-based approaches were compared. LFMC derived from field observations were usually highest in the spring season and lowest in the summer season. Besides the seasonal differences, annual variations were also observed, potentially due to different weather conditions (temperature and precipitation). The results showed a high correlation between most of the remote sensing-derived SI and LFMC data. GAM had the best model fit while NLR had better results in model validation. The remotely sensed approaches generally overestimated the minimum LFMC; however, the authors believe their methods are promising, cost-effective, and provide valuable information for operational wildfire risk management.
Gang, C., Pan, S., Tian, H., Wang, Z., Xu, R., Bian, Z., Pan, N., Yao, Y., and Shi, H., 2020, Satellite observations of forest resilience to hurricanes along the northern Gulf of Mexico: Forest Ecology and Management, v. 472, art. no. 118243. [Also available at https://doi.org/10.1016/j.foreco.2020.118243.]
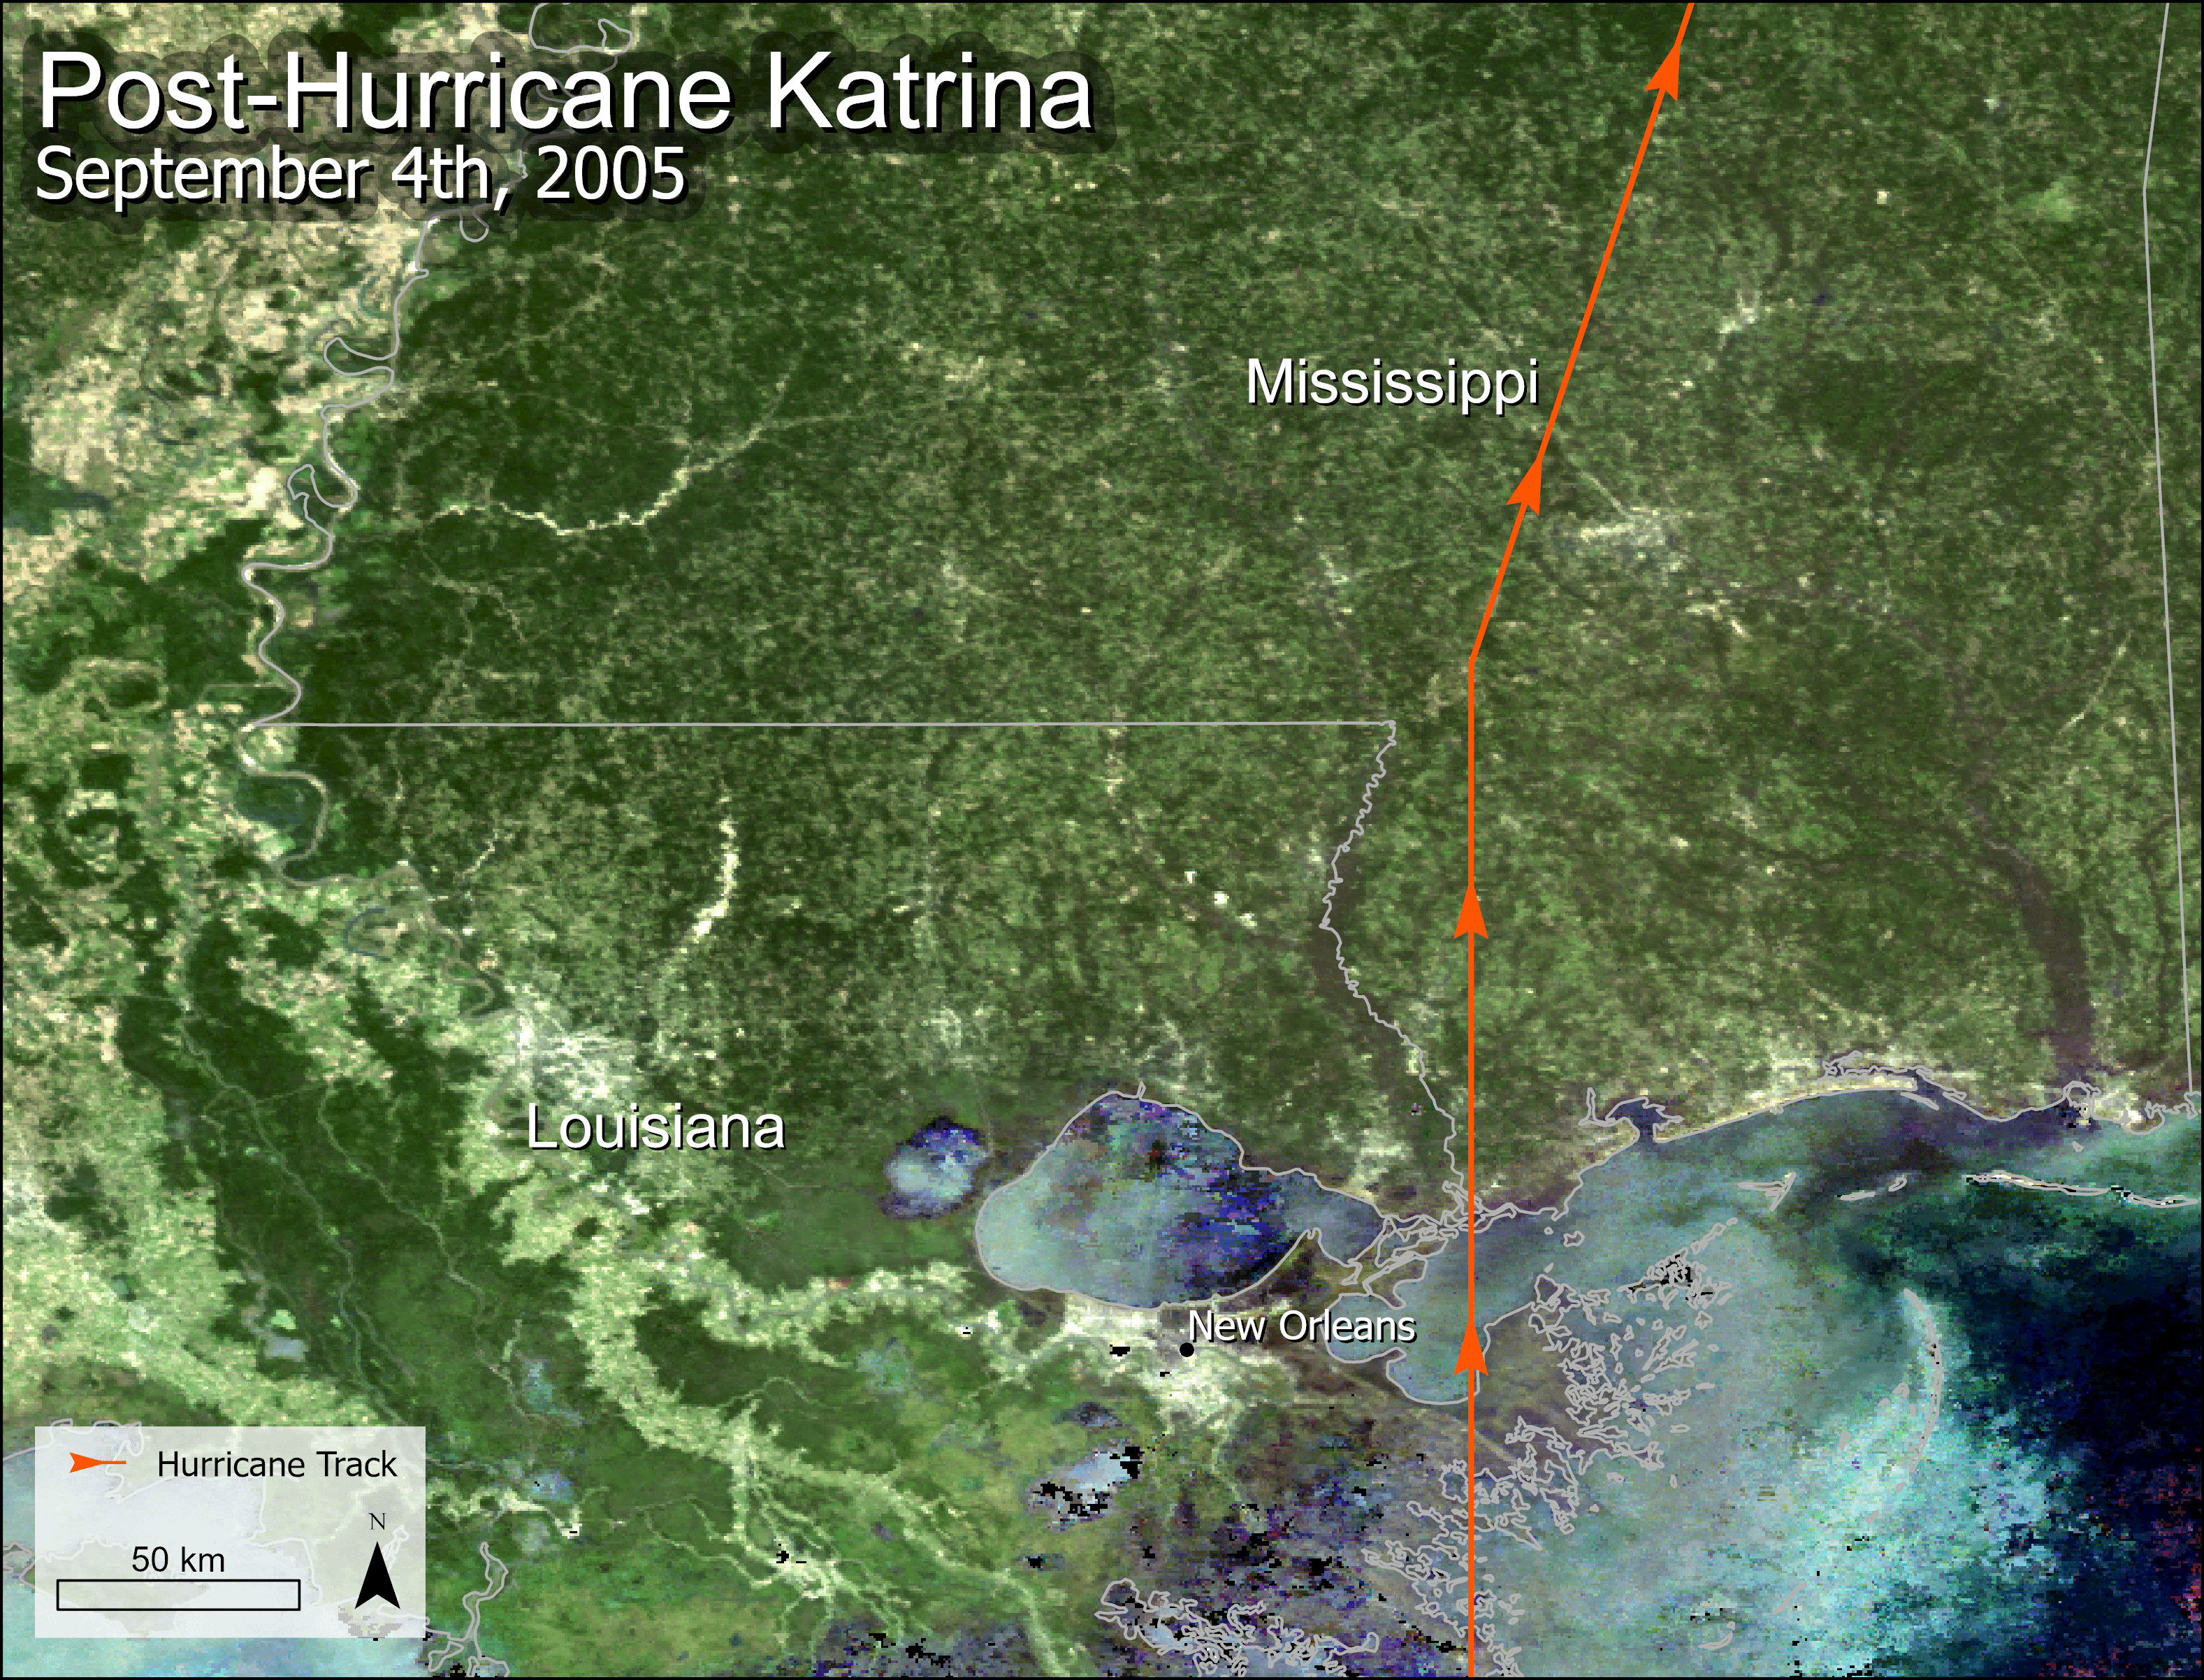
Combined Terra and Aqua MODIS BRDF-Adjusted Reflectance (NBAR) band 1-4-3 (true color composite) image on September 4, 2005. Orange colored line indicates the track of Hurricane Katrina (Landsea and Franklin, 2013), which made landfall on August 29, 2005, in Louisiana, USA (Grita, 2015). Combined Terra and Aqua MODIS (MCD43A4.006) data accessed via AppEEARS (AppEEARS Team, 2020) on November 4, 2020.
Granule IDs: (Author's note: MODIS Version 6 data have since been decommissioned. Users are encouraged to use the Version 6.1 equivalent product.)
MCD43A4.A2005247.h10v05.006.2016131210950
MCD43A4.A2005247.h10v06.006.2016131113002
Data and Tool Citation
AppEEARS Team, 2020, Application for Extracting and Exploring Analysis Ready Samples (AppEEARS), Ver. 2.48: NASA EOSDIS Land Processes DAAC, accessed November 4, 2020, at https://appeears.earthdatacloud.nasa.gov/ .
Grita, F., 2015, Global Administrative Unit Layers (GAUL): FAO GeoNetwork dataset, accessed December 19, 2014, at http://www.fao.org/geonetwork/srv/en/metadata.show?id=12691.
Schaaf, C., and Wang, Z., 2015, MCD43A4 MODIS/Terra+Aqua BRDF/Albedo Nadir BRDF Adjusted Ref Daily L3 Global - 500m V006: NASA EOSDIS Land Processes DAAC, accessed November 5, 2020, at https://doi.org/10.5067/MODIS/MCD43A4.006.
When hurricanes make landfall, they endanger not only human made structures but also natural terrestrial systems. Impacts on natural systems like forests can be extensive, with damage ranging from defoliated trees and broken branches to the complete uprooting of trees. These impacts can have wide ranging detrimental implications for forest ecosystems. Understanding how forests change and respond after a hurricane is important for not only protecting and restoring the critical ecosystem services forests provide, but also in understanding how hurricane disturbances impact carbon, nitrogen, and water cycles in forest ecosystems. In this one recent study from Gang and others (2020), hurricanes that made landfall from 2001–2015 along the northern Gulf of Mexico were evaluated to determine how resilient forests are to hurricanes, and how forests recovered post-hurricane.
The authors identified thirteen hurricane tracks for which they gathered hurricane (location, wind speed, and category), forest type (evergreen forests and woody wetlands), and drought data. The researchers also derived multiple ecological indicators and used these along with the gathered data to evaluate the resilience and recovery of impacted forests. The ecological indicators were derived using the Combined Terra and Aqua MODIS Nadir Bidirectional Reflectance Distribution Function (BRDF)-Adjusted Reflectance (NBAR) Daily L3 Global 500m product (MCD43A4.006) and were used to determine the forest canopy state before and after the disturbance. These indicators included Vegetation Indices (VIs) like the Enhanced Vegetation Index (EVI) and Normalized Difference Infrared Index (NDII), among others.
The resilience of forests to hurricanes following the disturbance was determined by comparing forest types and their post-hurricane state against the pre-hurricane state. This was done in two ways: by comparing VI-based statistics (VI statistics) just before and just after the storm, and by comparing the post-hurricane VI statistics to the average of the VI statistics for all the previous years. The researchers found that among the VIs compared, NDII, a VI calculation based on the Short-Wave Infrared (SWIR) and Near-Infrared (NIR) spectral bands, was better when determining the magnitude of resilience following a hurricane. The researchers also found that wind speed was a critical component in forest damage during a hurricane and that woody wetlands were more resilient than other forest types observed in the study. Finally, post-hurricane recovery of forest canopy was variable depending on a number of factors, including the strength of the storm (stronger winds result in more damage), time since the last storm in the same area (having successive storms slows down recovery), and whether forest recovery is taking place during a drought (shown to extend the recovery period). This study brings science closer to understanding how forest ecosystems respond following a hurricane disturbance and will aid in the development of post-hurricane recovery models.
Data and Tool Citation
AppEEARS Team, 2020, Application for Extracting and Exploring Analysis Ready Samples (AppEEARS), Ver. 2.48: NASA EOSDIS Land Processes DAAC, accessed November 4, 2020, at https://appeears.earthdatacloud.nasa.gov/.
Didan, K., 2015, MOD13Q1 MODIS/Terra Vegetation Indices 16-Day L3 Global 250m SIN Grid V006: NASA EOSDIS Land Processes DAAC, accessed October 28, 2020, at https://doi.org/10.5067/MODIS/MOD13Q1.006.
Friedl, M., and Sulla-Menashe, D., 2019, MCD12Q1 MODIS/Terra+Aqua Land Cover Type Yearly L3 Global 500m SIN Grid V006: NASA EOSDIS Land Processes DAAC, accessed October 28, 2020, at https://doi.org/10.5067/MODIS/MCD12Q1.006.
Grita, F., 2015, Global Administrative Unit Layers (GAUL): FAO GeoNetwork dataset, accessed December 19, 2014, at http://www.fao.org/geonetwork/srv/en/metadata.show?id=12691.
Landsea, C.W., and Franklin, J.L., 2013, Atlantic hurricane database uncertainty and presentation of a new database format: Monthly Weather Review, v. 141, no. 10, p. 3576–3592. [Also available at https://doi.org/10.1175/mwr-d-12-00254.1.]
Schaaf, C., and Wang, Z., 2015, MCD43A4 MODIS/Terra+Aqua BRDF/Albedo Nadir BRDF Adjusted Ref Daily L3 Global - 500m V006: NASA EOSDIS Land Processes DAAC, accessed November 5, 2020, at https://doi.org/10.5067/MODIS/MCD43A4.006.
Vermote, E., and Wolfe, R., 2015, MOD09GA MODIS/Terra Surface Reflectance Daily L2G Global 1kmand 500m SIN Grid V006: NASA EOSDIS Land Processes DAAC, accessed November 6, 2020, at https://doi.org/10.5067/MODIS/MOD09GA.006.
Material written by: Cole Krehbiel1, Mahsa Jami1, and Aaron Friesz1
1KBR, Inc. contractor to the U.S. Geological Survey, Earth Resources Observation and Science (EROS) Center, Sioux Falls, South Dakota, USA. Work performed under USGS contract G15PC00012 for the LP DAAC2
2LP DAAC work performed under NASA contract NNG14HH33I.