Data products from the Land Processes (LP) Distributed Active Archive Center (DAAC) are used in many different applications. They play an important role in modeling, help to detect changes to the landscape, and are a way to assess ecosystem variables, to name a few. A few of those applications, published between October and December 2015, are highlighted below. A more exhaustive, albeit not complete, list can be accessed via the LP DAAC Publications webpage.
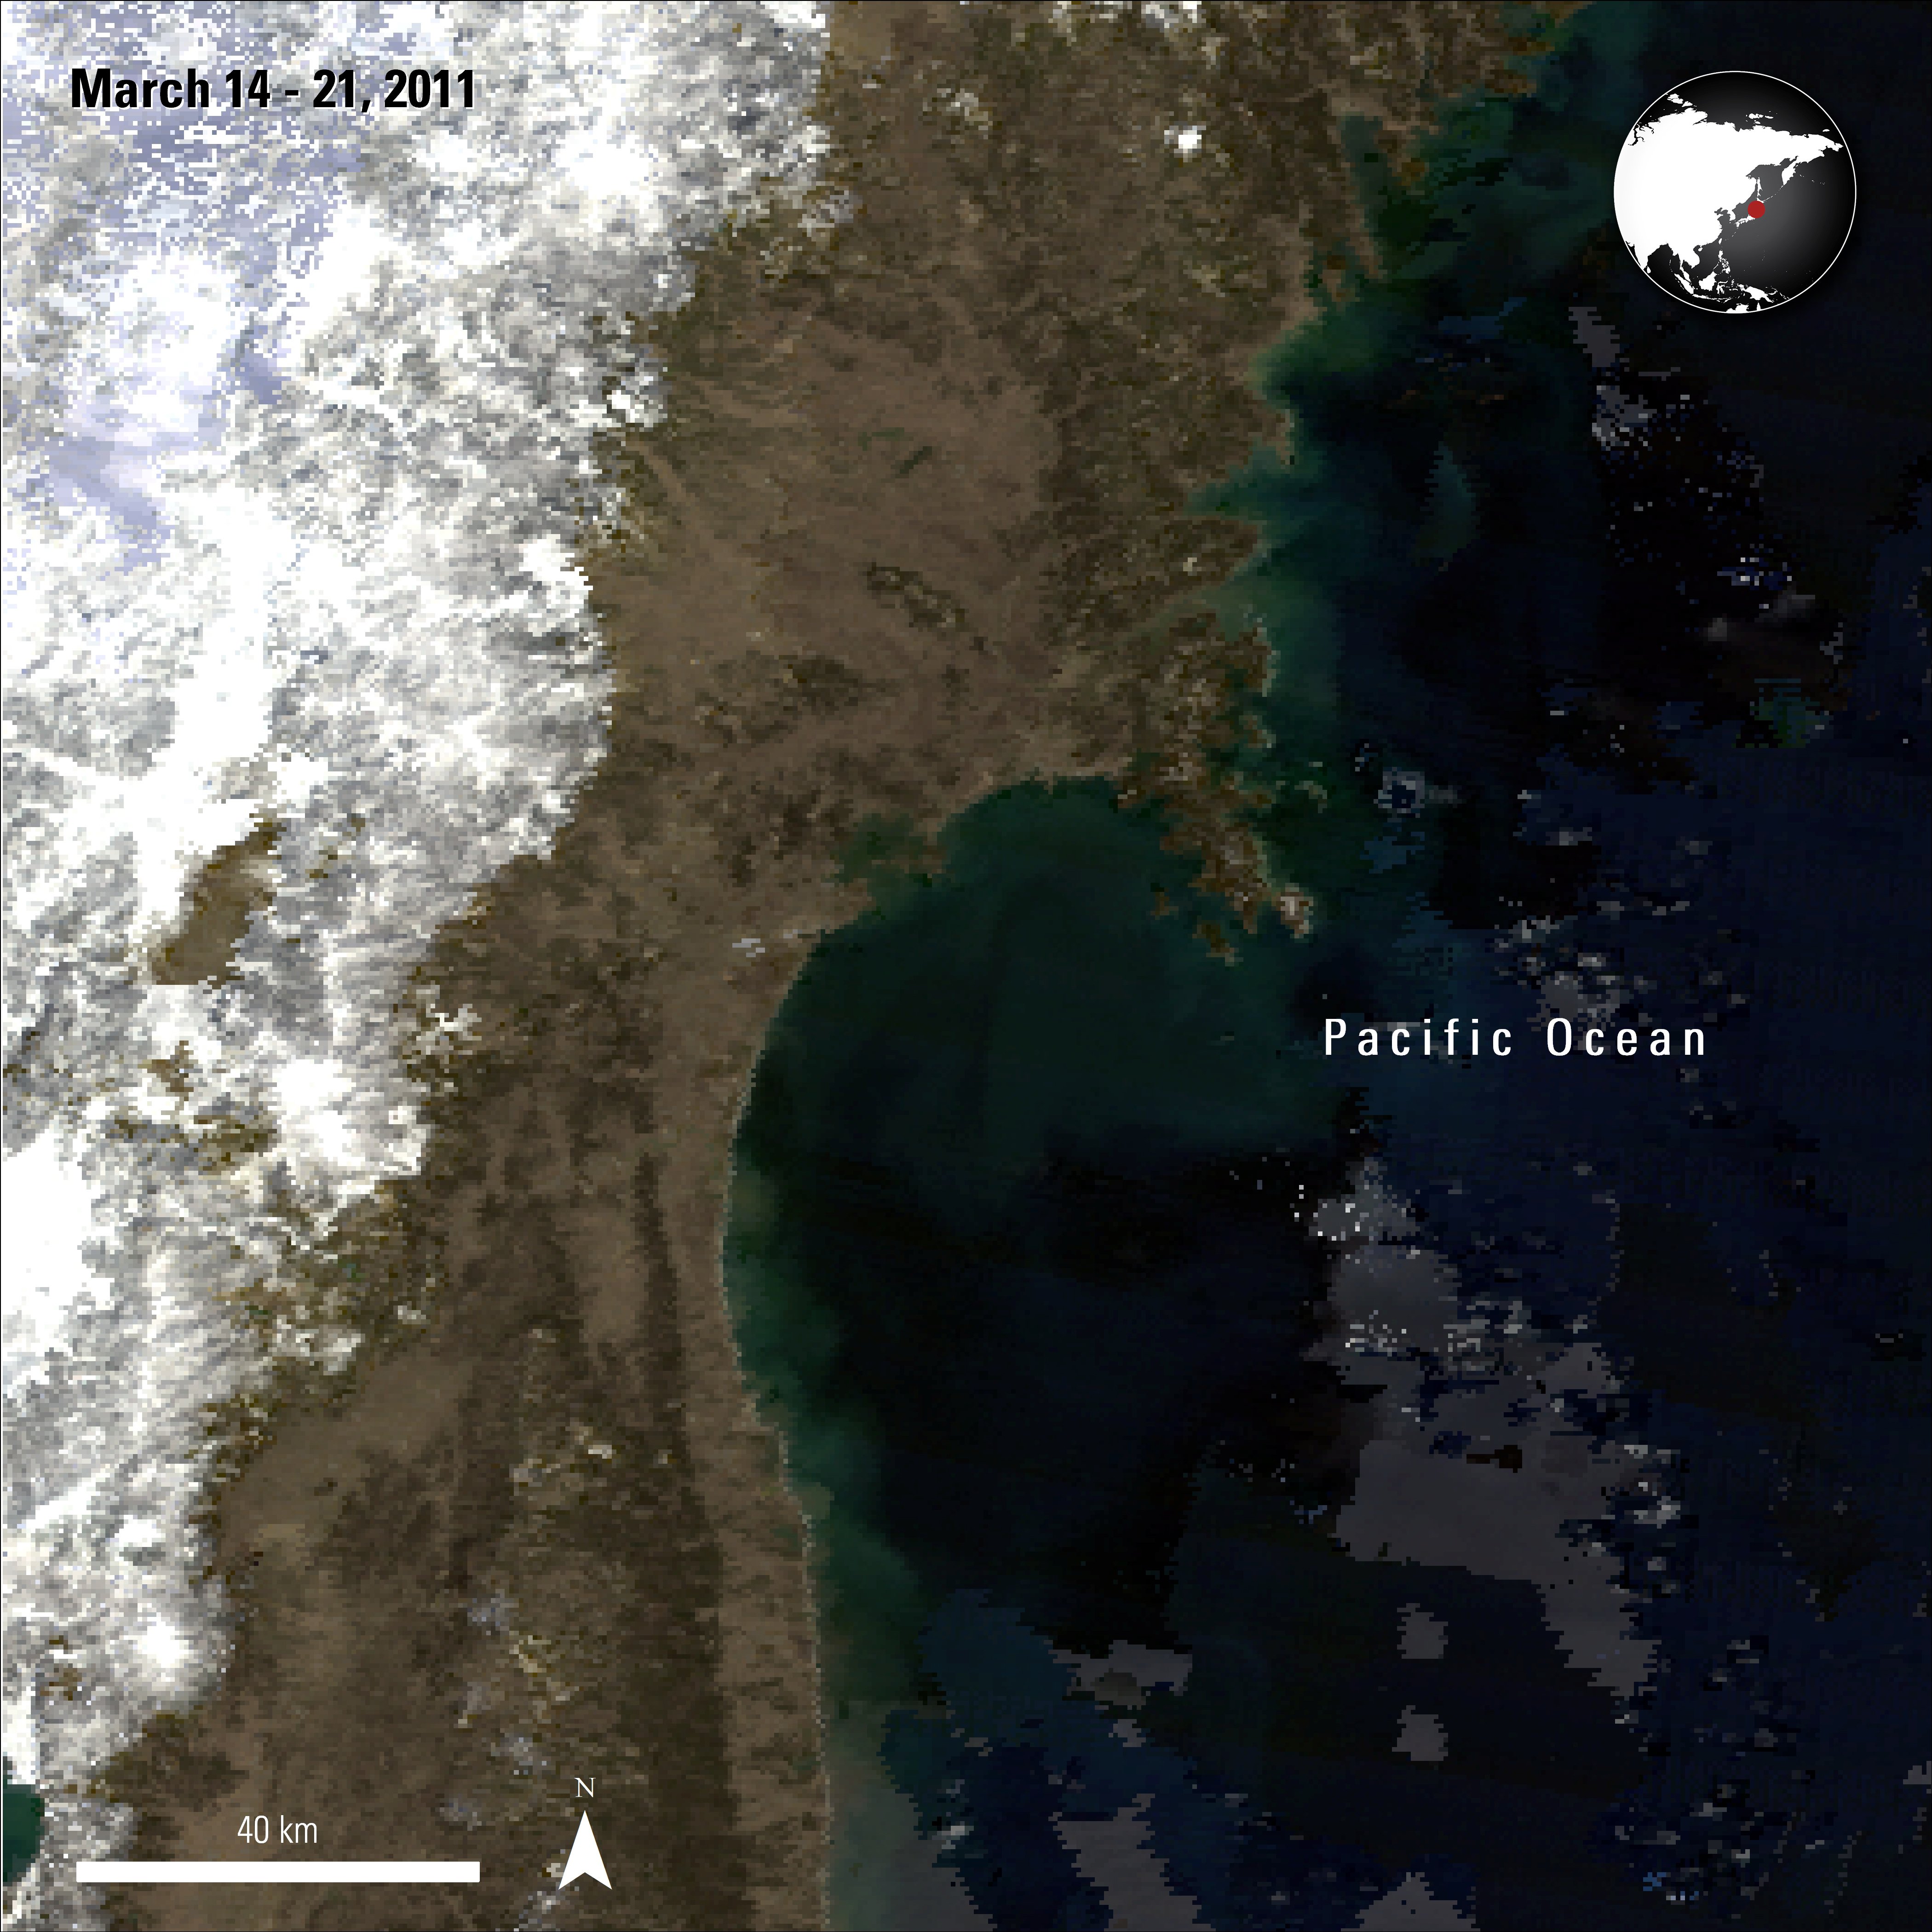
A Terra/Aqua MODIS composite true-color surface reflectance image of the study area approximately three days after the tsunami to about a week later.
A Terra/Aqua MODIS composite true-color surface reflectance image of the study area approximately three days after the tsunami to about a week later.
Chen, C., Son, N., Chen, C., Cho, K., Hsiao, Y., Chiang, S., and Chang, L., 2015, Assessing rice crop damage and restoration using remote sensing in tsunami-affected areas, Japan: Journal of Applied Remote Sensing, v. 9, no. 1, [Also available at http://dx.doi.org/10.1117/1.JRS.9.096002].
On March 11, 2011, an offshore, magnitude 9 earthquake caused a tsunami that inundated much of Japan’s coastline. To analyze the impact on inland rice crop fields in regions south of Miyagi from before and after the tsunami, the authors of this study created a time-series enhanced vegetation index 2 (EVI2) data using Moderate Resolution Imaging Spectroradiometer (MODIS) surface reflectance data (MOD09Q1 and MOD09A1). Additionally, the authors used the Advanced Spaceborne Thermal Emission and Reflection Radiometer (ASTER) Global Digital Elevation Model (GDEM) (ASTGTM), Landsat imagery, land use and tsunami-affected maps, and government statistics to analyze the EVI2 data created. The study reports that the tsunami affected approximately 17,550 hectares of rice crops. Some of these areas were restored in the year after the tsunami; however restoration efforts appeared to slow in 2012, most likely due to a government mandate to not replant in the vicinity of the Fukushima Daiichi nuclear power plant. Identifying the amount and extent of damaged and restored rice crop can help land and agricultural planners understand the impacts of the tsunami.
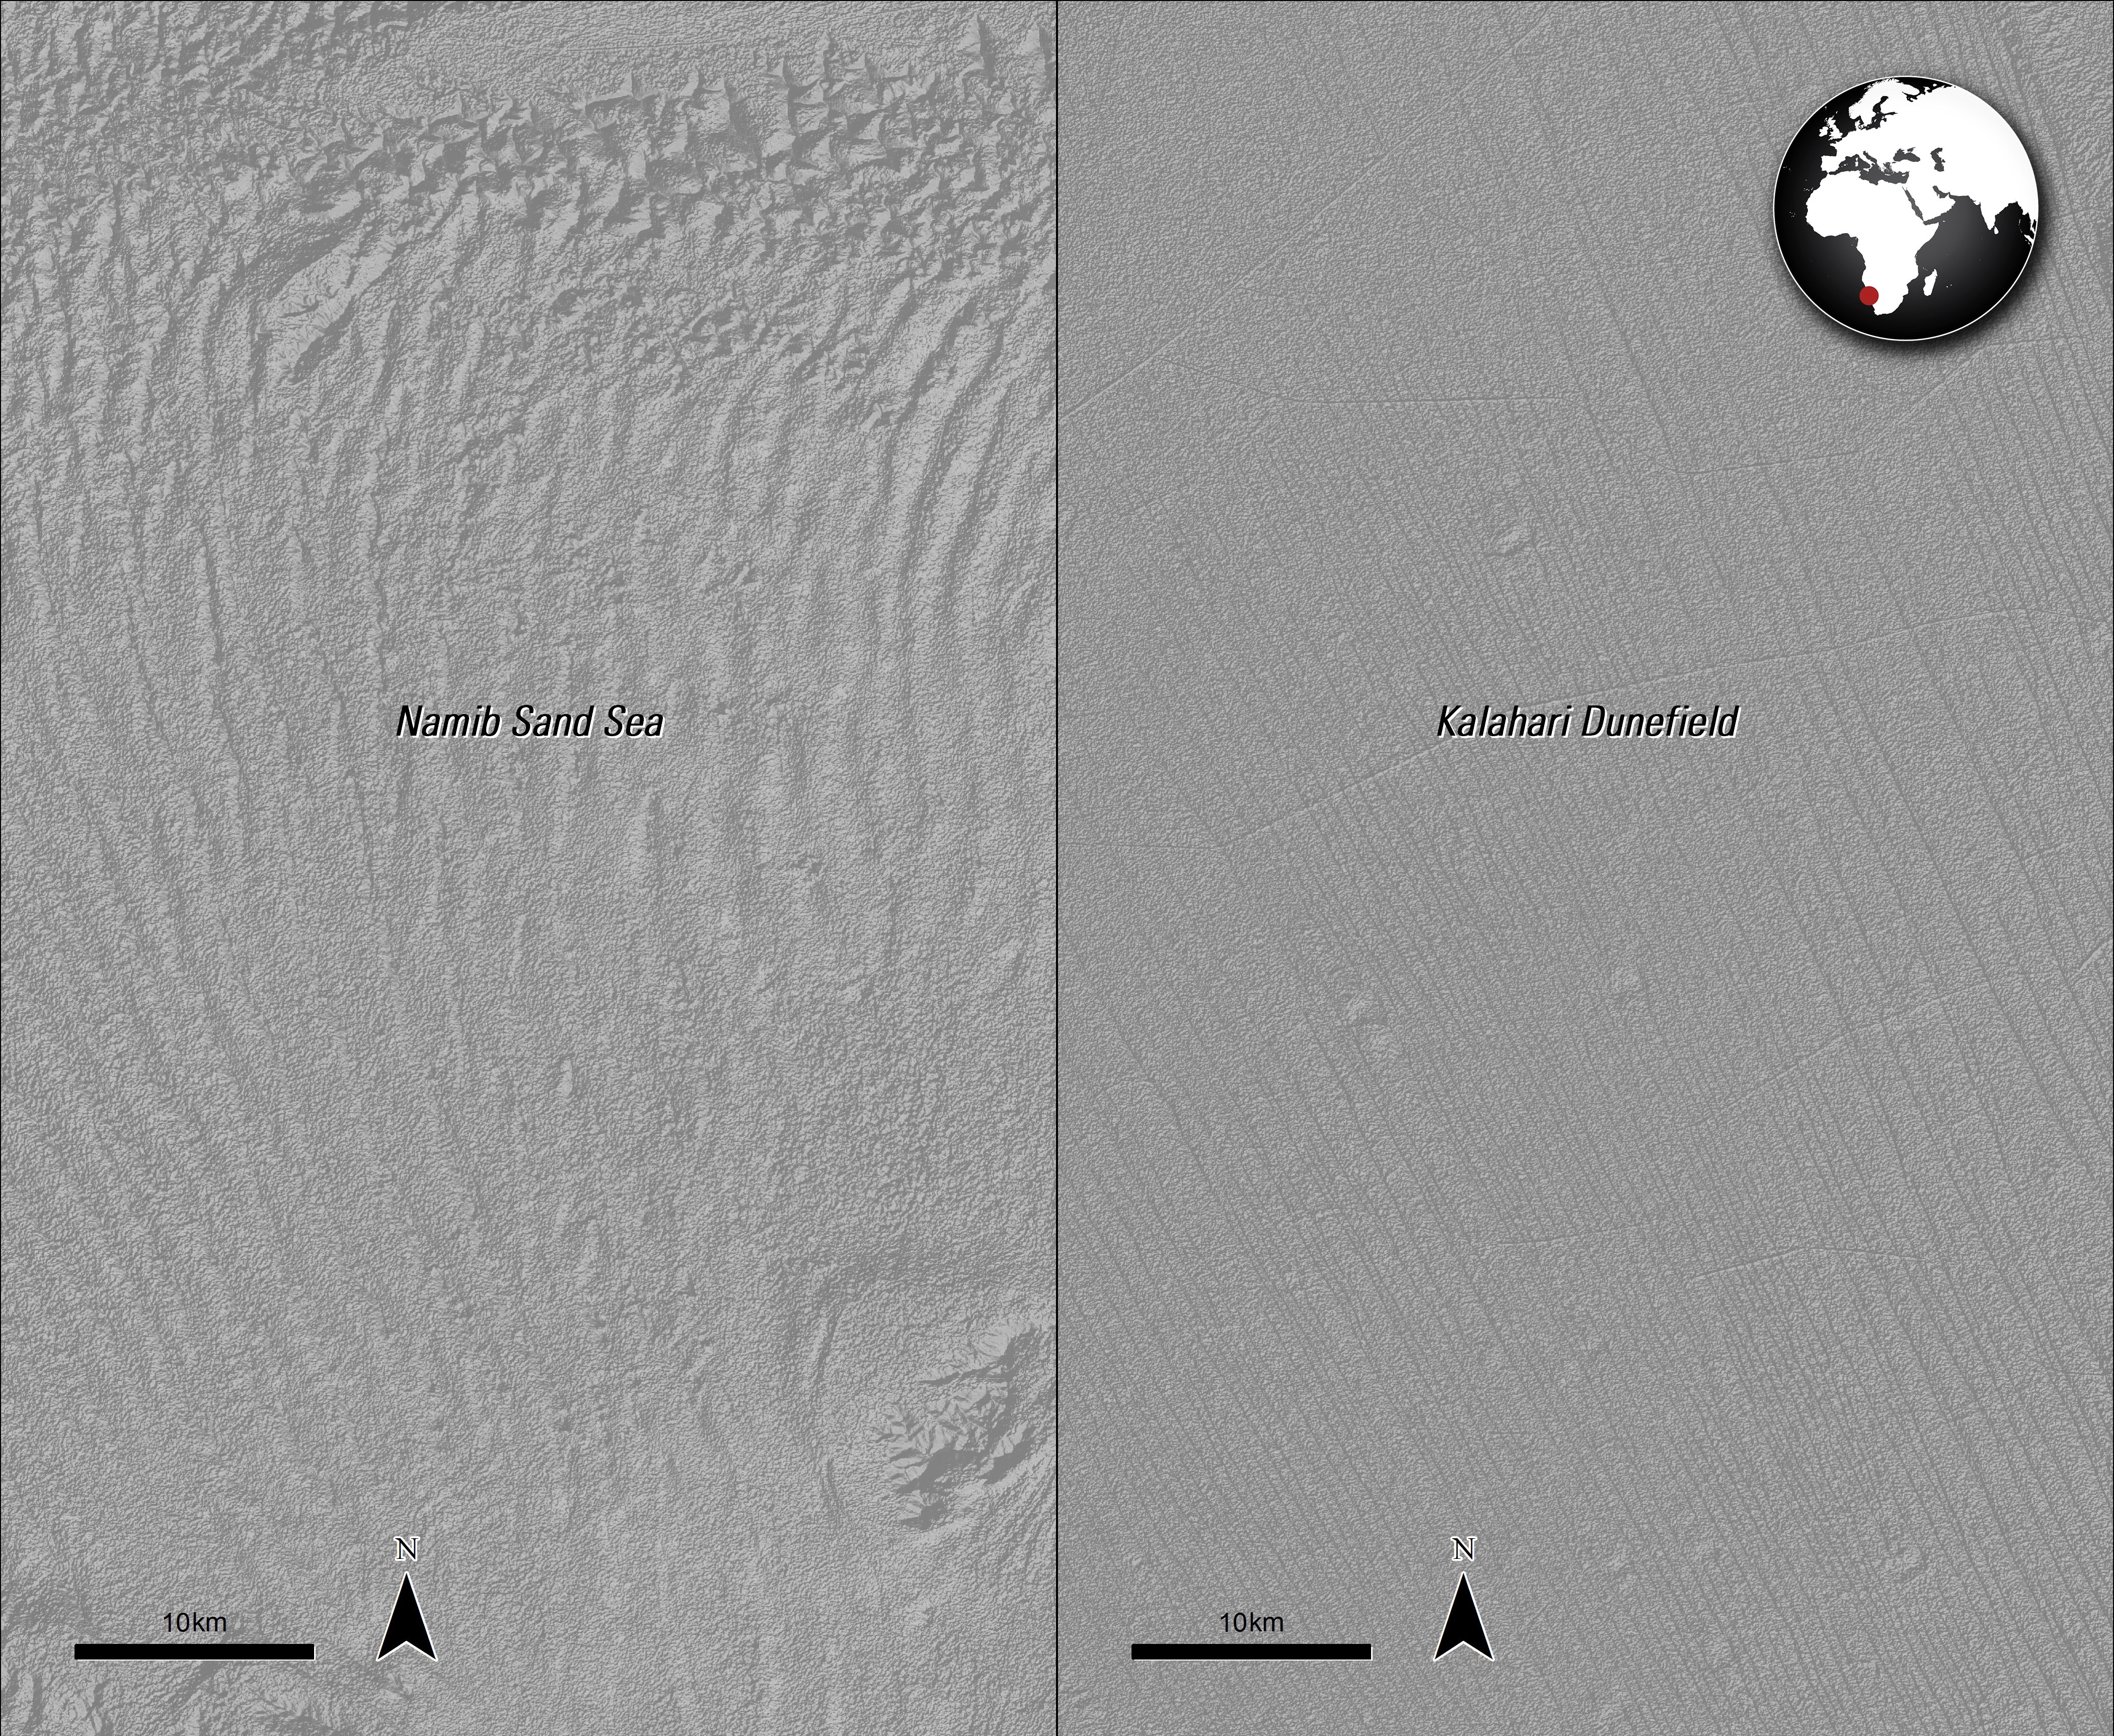
ASTER GDEM, a product of NASA and Japan’s Ministry of Economy, Trade, and Industry (METI), was used to compare sand dune height and dune spacing patterns of two deserts in Namibia.
Granule IDs:
ASTGTM2_S24E018_dem
ASTGTM2_S25E015_dem
ASTGTM2_S25E018_dem
ASTGTM2_S26E015_dem
ASTER GDEM, a product of NASA and Japan’s Ministry of Economy, Trade, and Industry (METI), was used to compare sand dune height and dune spacing patterns of two deserts in Namibia.
Granule IDs:
ASTGTM2_S24E018_dem
ASTGTM2_S25E015_dem
ASTGTM2_S25E018_dem
ASTGTM2_S26E015_dem
White, K., Bullard, J., Livingstone, I., & Moran, L., 2015, A morphometric comparison of the Namib and southwest Kalahari dunefields using ASTER GDEM data: Aeolian Research, vo. 19, part A, 87-95. [Also available at http://www.sciencedirect.com/science/article/pii/S1875963715000877]
Remote sensing data may be used to analyze sand dune characteristics of vast sand seas. This study compares the height and spacing of simple linear sand dunes found in two regions of Namibia; the actively moving dunes in the Namib Sand Sea and the fixed dunes in the Kalahari dunefield. The study first determined that ASTER GDEM produces comparable measurements of sand dune height and cross sectional area compared to in-field Differential Global Positioning System (DGPS) surveys. Next, the study uses ASTER GDEM to analyze patterns of dune height and spacing for both study areas. The results of the study show that the spacing of sand dunes in the two study areas is similar; however, the Kalahari dunes are generally shorter than the dunes of the Namib Sand Sea. The authors found that by utilizing ASTER GDEM data to analyze sand dune height and spacing across an entire dunefield, they discovered different patterns and relationships than those reported in previous studies.
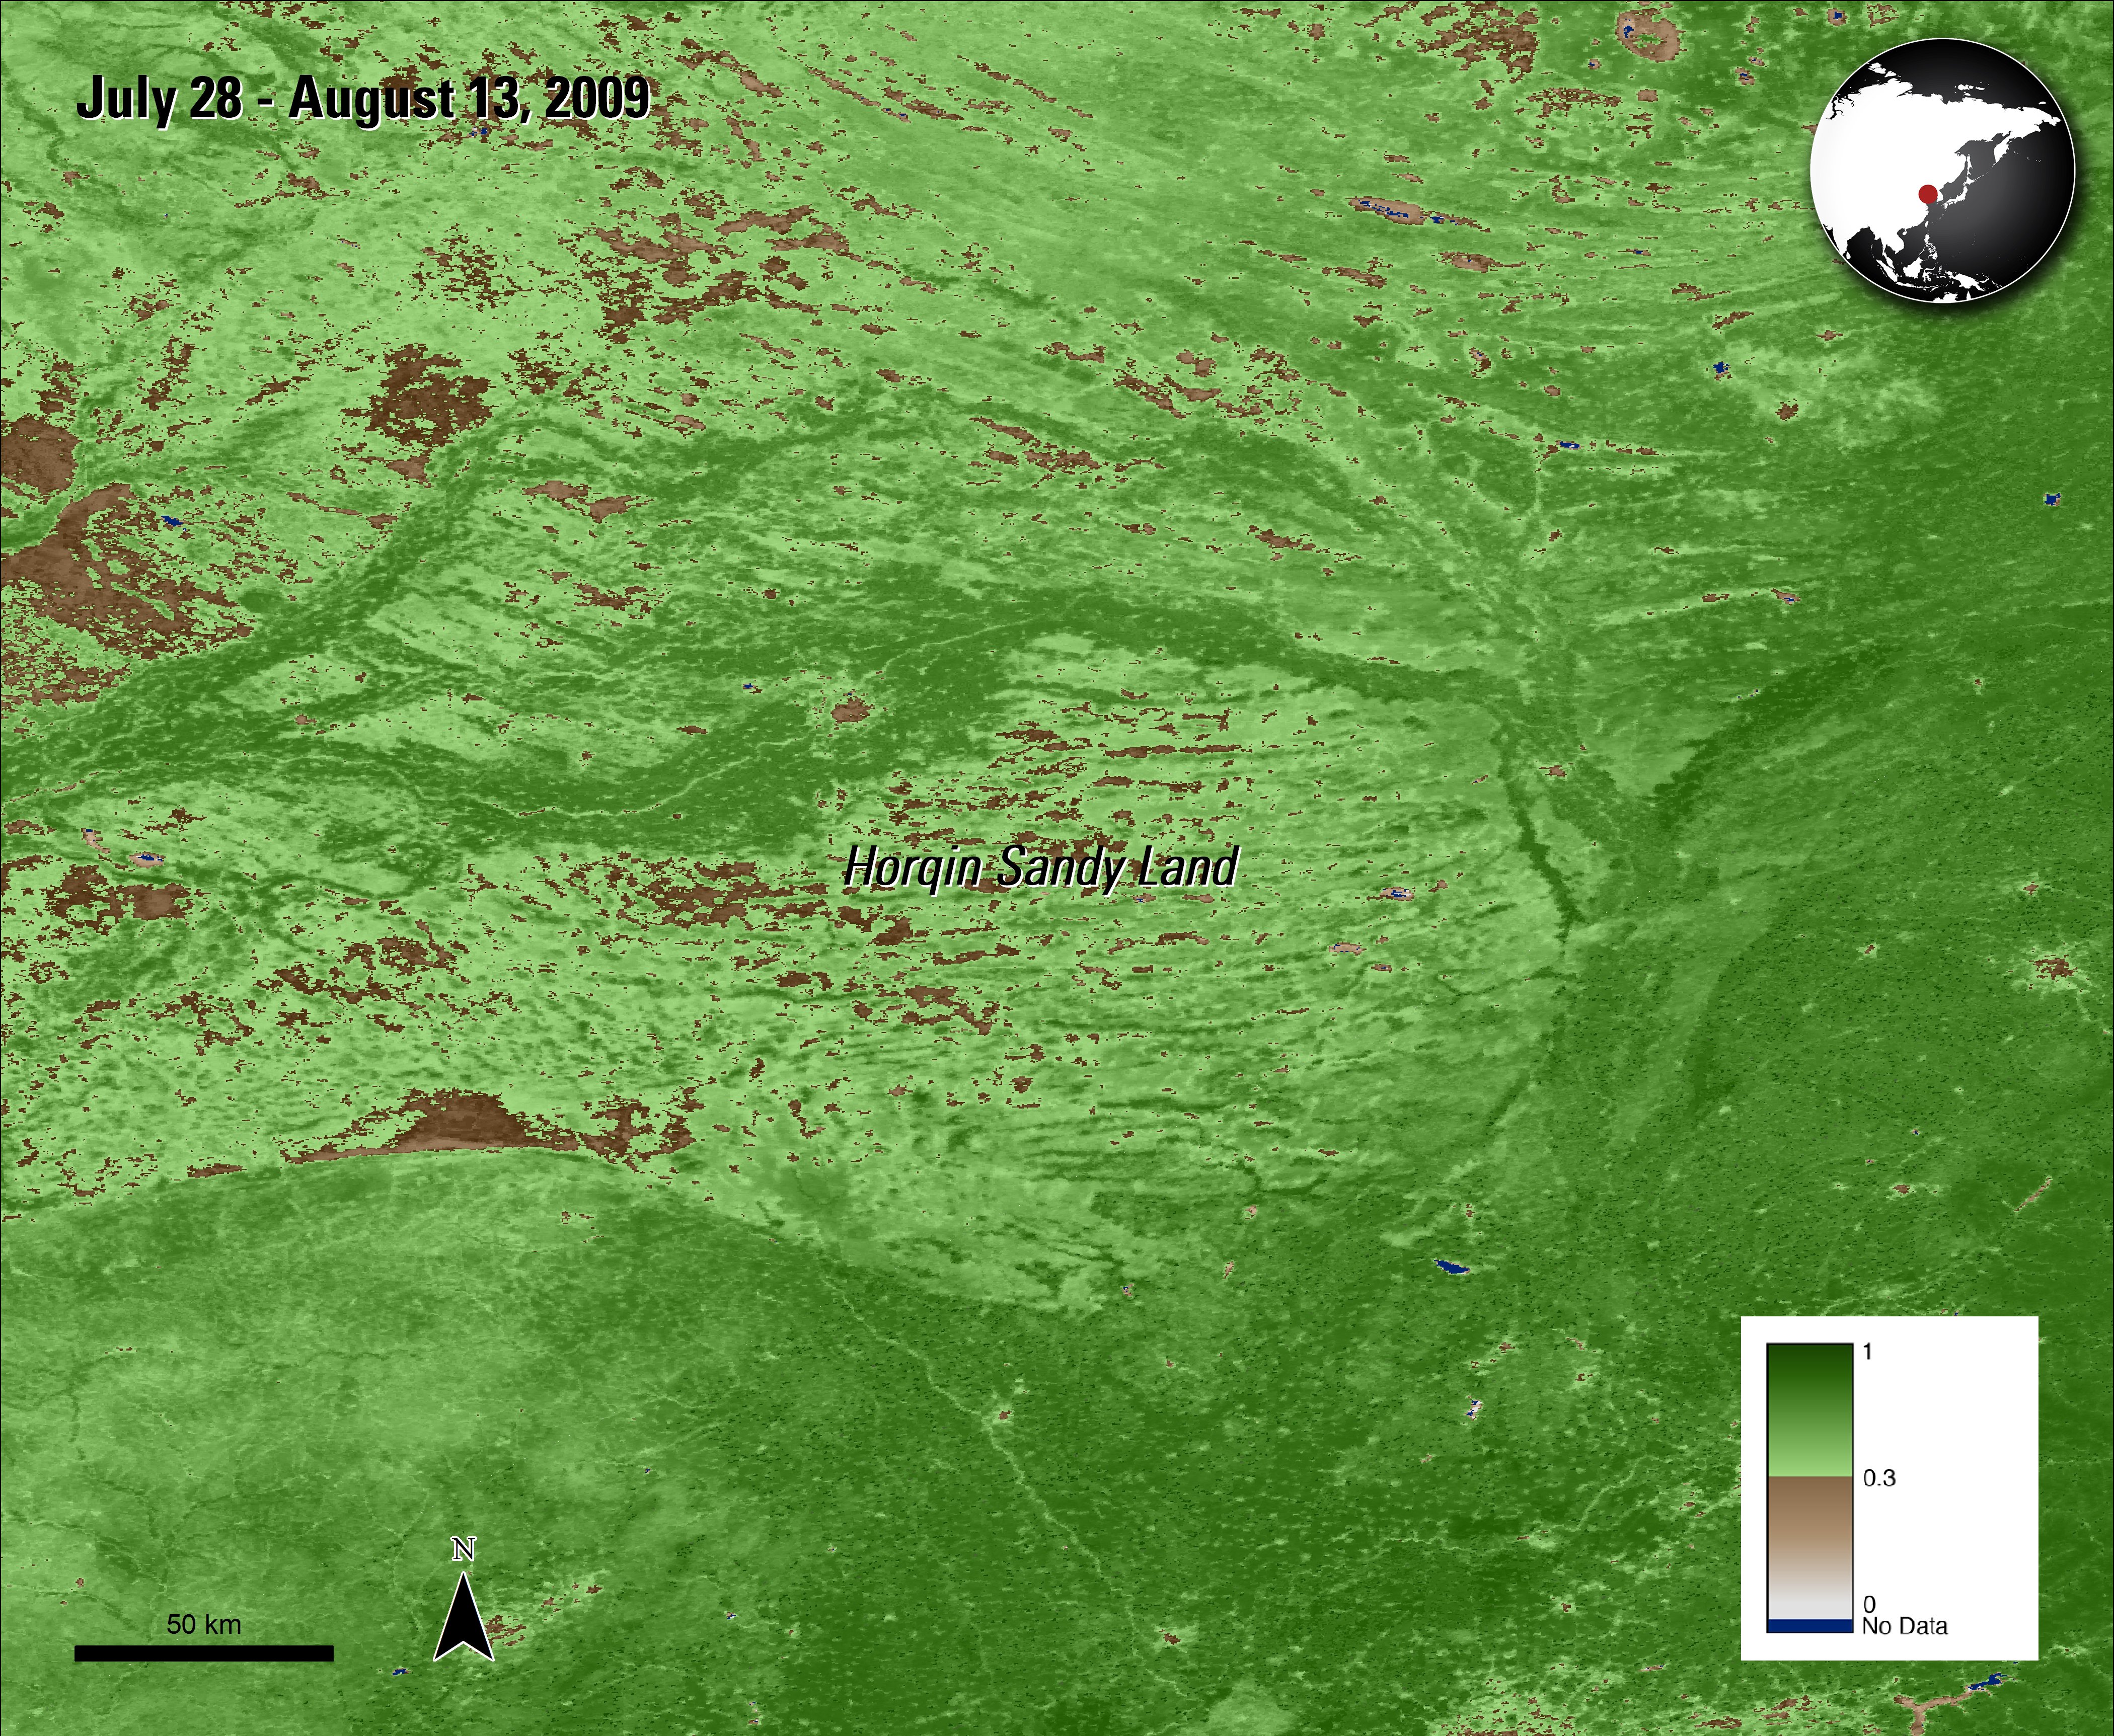
A composite Terra MODIS NDVI image of the Horquin Sandy Land in northern China from August, 2009.
A composite Terra MODIS NDVI image of the Horquin Sandy Land in northern China from August, 2009.
Duan L, Liu T, Wang X, Luo Y. (2015). Spatio-Temporal Patterns of Water Table and Vegetation Status of a Deserted Area. Water, 7, 5788-5805. [Also available at http://www.mdpi.com/2073-4441/7/10/5788]
In arid regions, groundwater availability is the main limiting resource for vegetation. This study examines the relationship of water table height and vegetation over a six-year study period (2003 – 2009) in a 9.71 square kilometer region of the Horquin Sandy Land in northern China. The authors analyzed the effect of several factors upon the water table and the effect of the water table upon various land cover types: meadowland, sandy dunes, and intermediate transitional zones. Data products used for the study include Moderate Resolution Imaging Spectroradiometer (MODIS) normalized difference vegetation index (NDVI) (MOD31Q1) and Landsat 4-5 Thematic Mapper data. The results of the study indicate that regions where the water table was closest to the surface tended to have higher maximum NDVI and that fluctuations to the water table had the greatest effect upon meadowlands and transitional zones but had the least effect upon sandy dunes.
Written by: Danae Verba1 and Lindsey Harriman2
1Virtuoso, Inc., contractor to the U.S. Geological Survey, Earth Resources Observation and Science (EROS) Center, Sioux Falls, South Dakota, USA. Work performed under USGS contract G15PD00766 for LP DAAC3.
2Stinger Ghaffarian Technologies, Inc. (SGT), contractor to the U.S. Geological Survey, Earth Resources Observation and Science (EROS) Center, Sioux Falls, South Dakota, USA. Work performed under USGS contract G15PD00766 for LP DAAC3.
3LP DAAC Work performed under NASA contract NNG14HH33I.