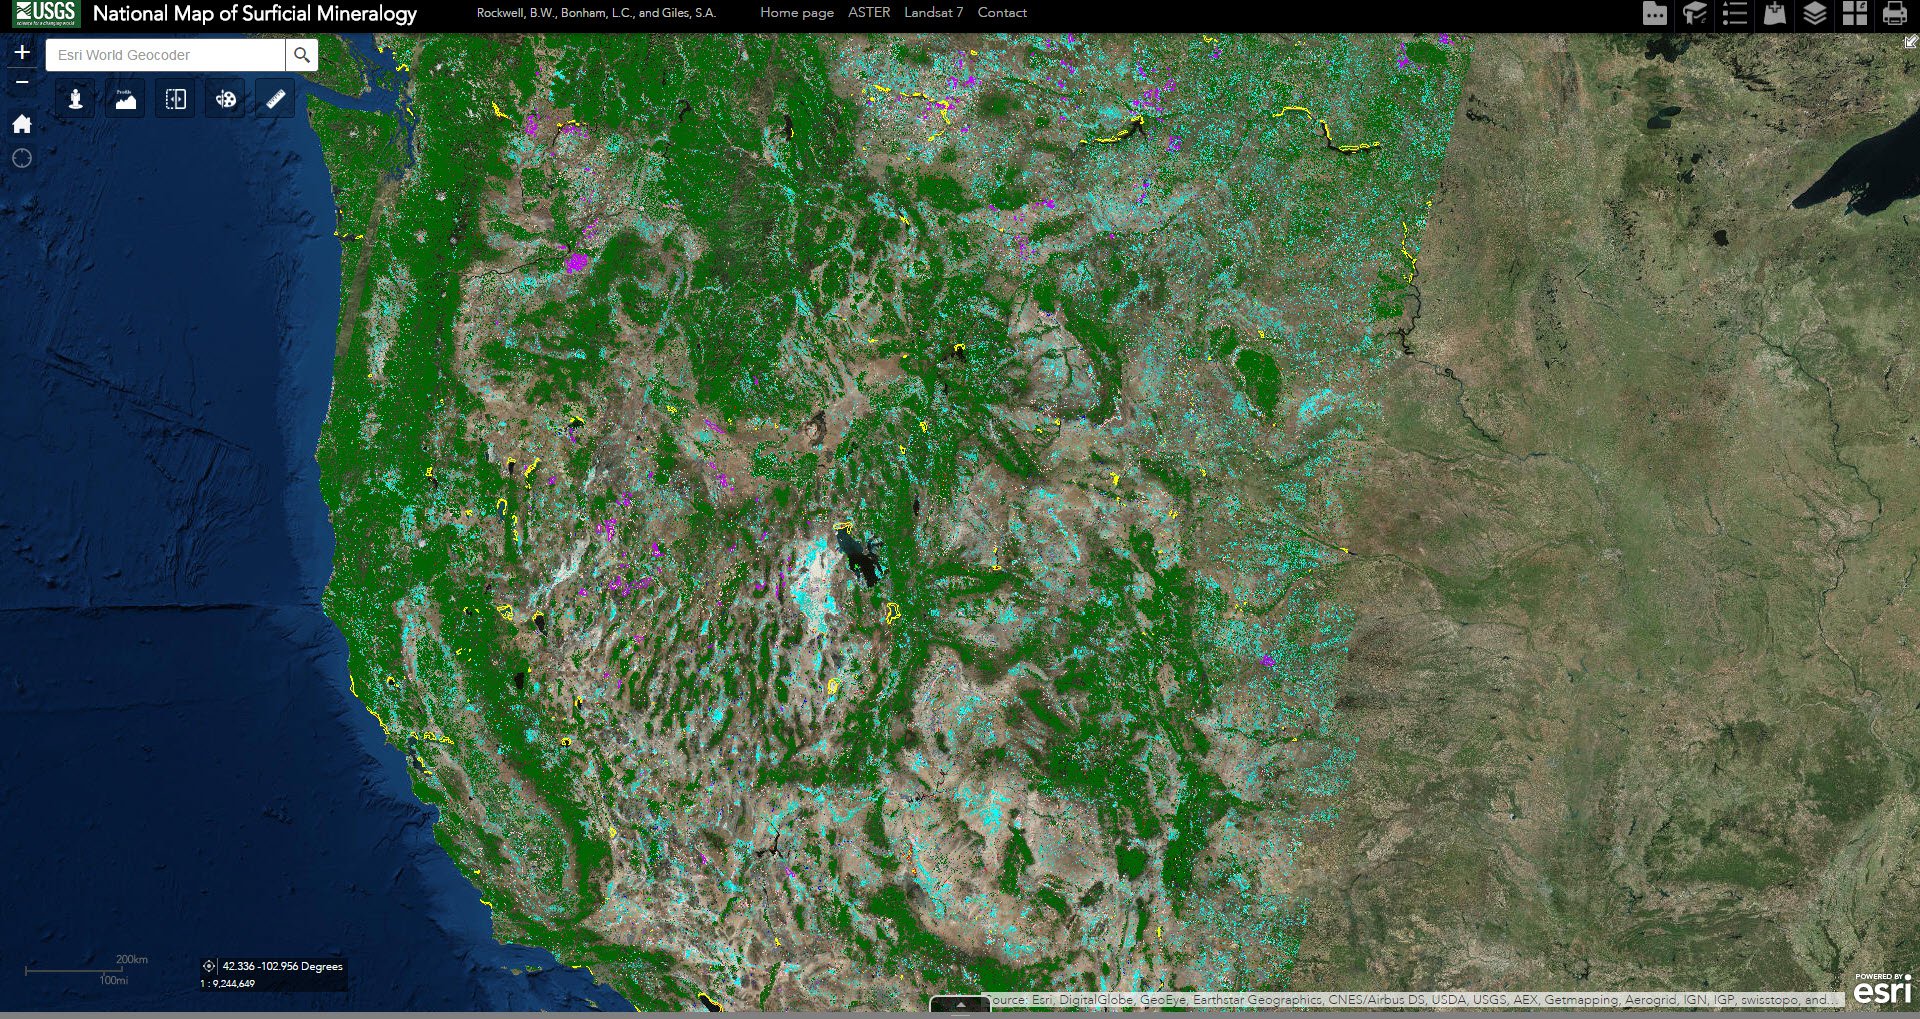
The ASTER data layer over the western United States on the National Map of Surficial Mineralogy.
The ASTER data layer over the western United States on the National Map of Surficial Mineralogy.
(Author's Note 2/15/2024: At the time of publishing these references were available online, some resources may no longer be available.)
Rockwell and others (2015) have created the National Map of Surficial Mineralogy, a project 5 years in the making, which identifies exposed minerals on the Conterminous United States (CONUS). The map was generated using automated spectral analysis of 1,630 Advanced Spaceborne Thermal Emission and Reflection Radiometer (ASTER) On Demand Orthorectified Registered Radiance at the Sensor (AST14OTH) scenes covering the western United States, 447 Landsat 7 Enhanced Thematic Mapper Plus (ETM+) scenes, and many more detailed material maps derived from analysis of airborne imaging spectrometer data covering CONUS. New material maps derived from analysis of Landsat 8 Operational Land Imager data covering western CONUS will be added soon.
The map has many geological purposes. It can be used to find undiscovered mineral deposits, to observe the environmental effects of mining and unmined hydrothermally altered rocks. The map can also be used to aid conservation efforts and in scientific studies. Geologists, and geology enthusiasts alike, can use the interactive National Map of Surficial Mineralogy in a web browser or by using GIS software where other data sources can be integrated as well. More information on the data used in the map can be found here.
ASTER data, collected by NASA’s Terra satellite, were chosen to create one of the main layers of the map because of ASTER’s high spectral resolution, particularly in the shortwave infrared (SWIR) region of the electromagnetic spectrum. The SWIR bands are advantageous for spectral analysis of minerals and can be used to create uniform mineral maps over large regions. Various ratios and calculations using bands from the visible and near-infrared (VNIR) and SWIR spectral regions can be used to identify different types of minerals. To create the map, Rockwell and others (2015) chose ASTER scenes from 2000 to the fall of 2007 that contained limited to no amounts of snow, clouds, haze, or smoke and were acquired near the Northern Hemisphere summer solstice during mid-June. The authors resampled the spatial resolution of the VNIR ASTER data from 15 meters to 30 meters to match the SWIR ASTER data. An automated algorithm (Rockwell, 2012) was used to extract mineral information from each ASTER scene. The extracted mineral data were then mosaicked together to build the ASTER layer for the map.
While this map can be used for many purposes, one of the ways it is currently being used is to study conservation and mineral resource potential for landscapes that contain Sagebrush vegetation in the Western United States. The Sagebrush vegetation often grows in or near areas of past and (or) current mining activity or fossil fuel extraction. However, Sagebrush also serves as an important animal breeding habitat. In 2015 the Bureau of Land Management (BLM) proposed to protect 10 million acres of Federal land from mineral exploration to conserve the Sagebrush critical habitat. This proposal resulted in creating the U.S. Geological Survey (USGS) Sagebrush Mineral-Resource Assessment (SaMiRA) project to study the mineral resources in these areas and estimate the potential for discovery of new deposits in the future. The ASTER- and Landsat 7-derived maps of hydrothermal alteration types and key mineral groups from the National Map of Surficial Mineralogy were integrated with other data to help define prospective areas for certain types of mineral deposits, particularly those of epithermal and intrusion-related origin. These maps provide initial information that allows researchers to further study areas that are both important in Sagebrush conservation but that also contain potential mineral resources. Below several screenshot maps are featured showing some of the Sagebrush study areas using the National Map of Surficial Mineralogy. Note that the map explanation (legend) is only partially shown in the images. Click through the images to view different areas.
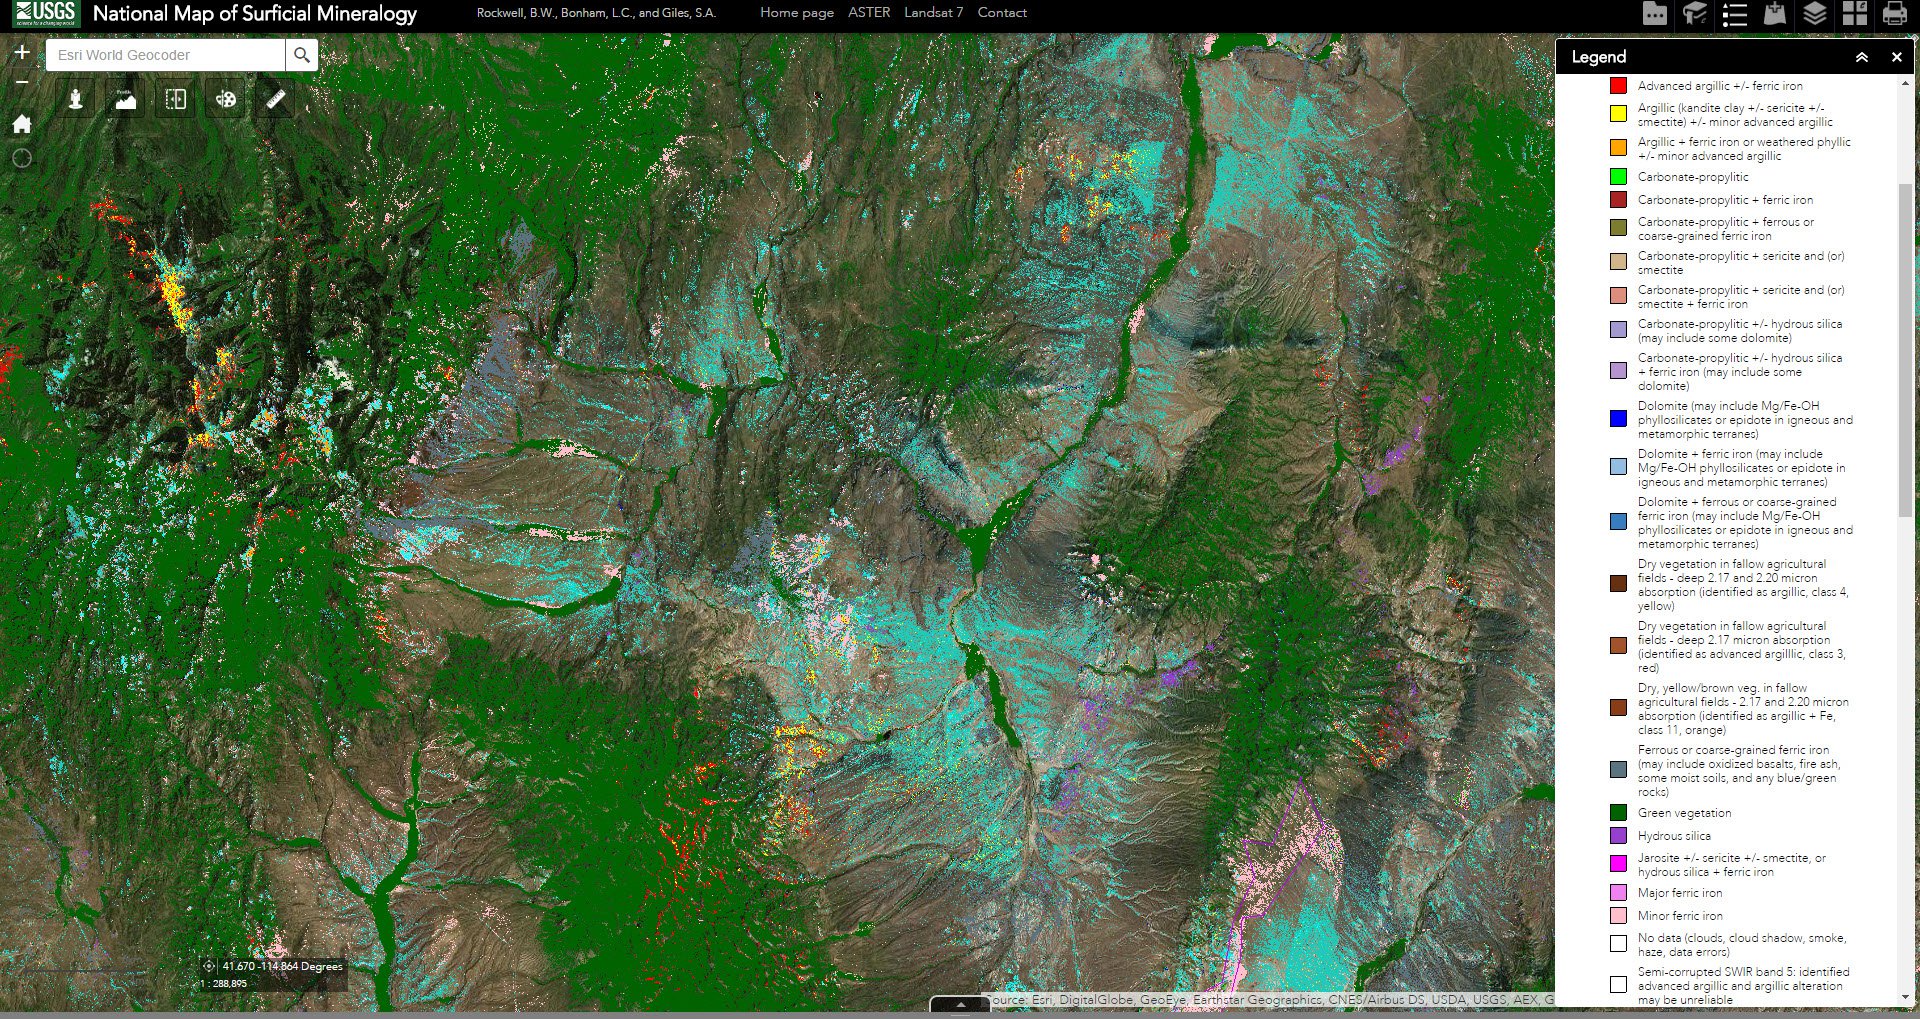
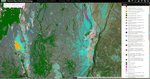
To view the ASTER data layer on the National Map of Surficial Mineralogy for yourself, click on the “Layer List” icon to turn on the ASTER data layer. The above image is a closer look at the types of minerals that can be identified using ASTER data in Elko County, Nevada. This area is part of the study area for the SaMiRA project.
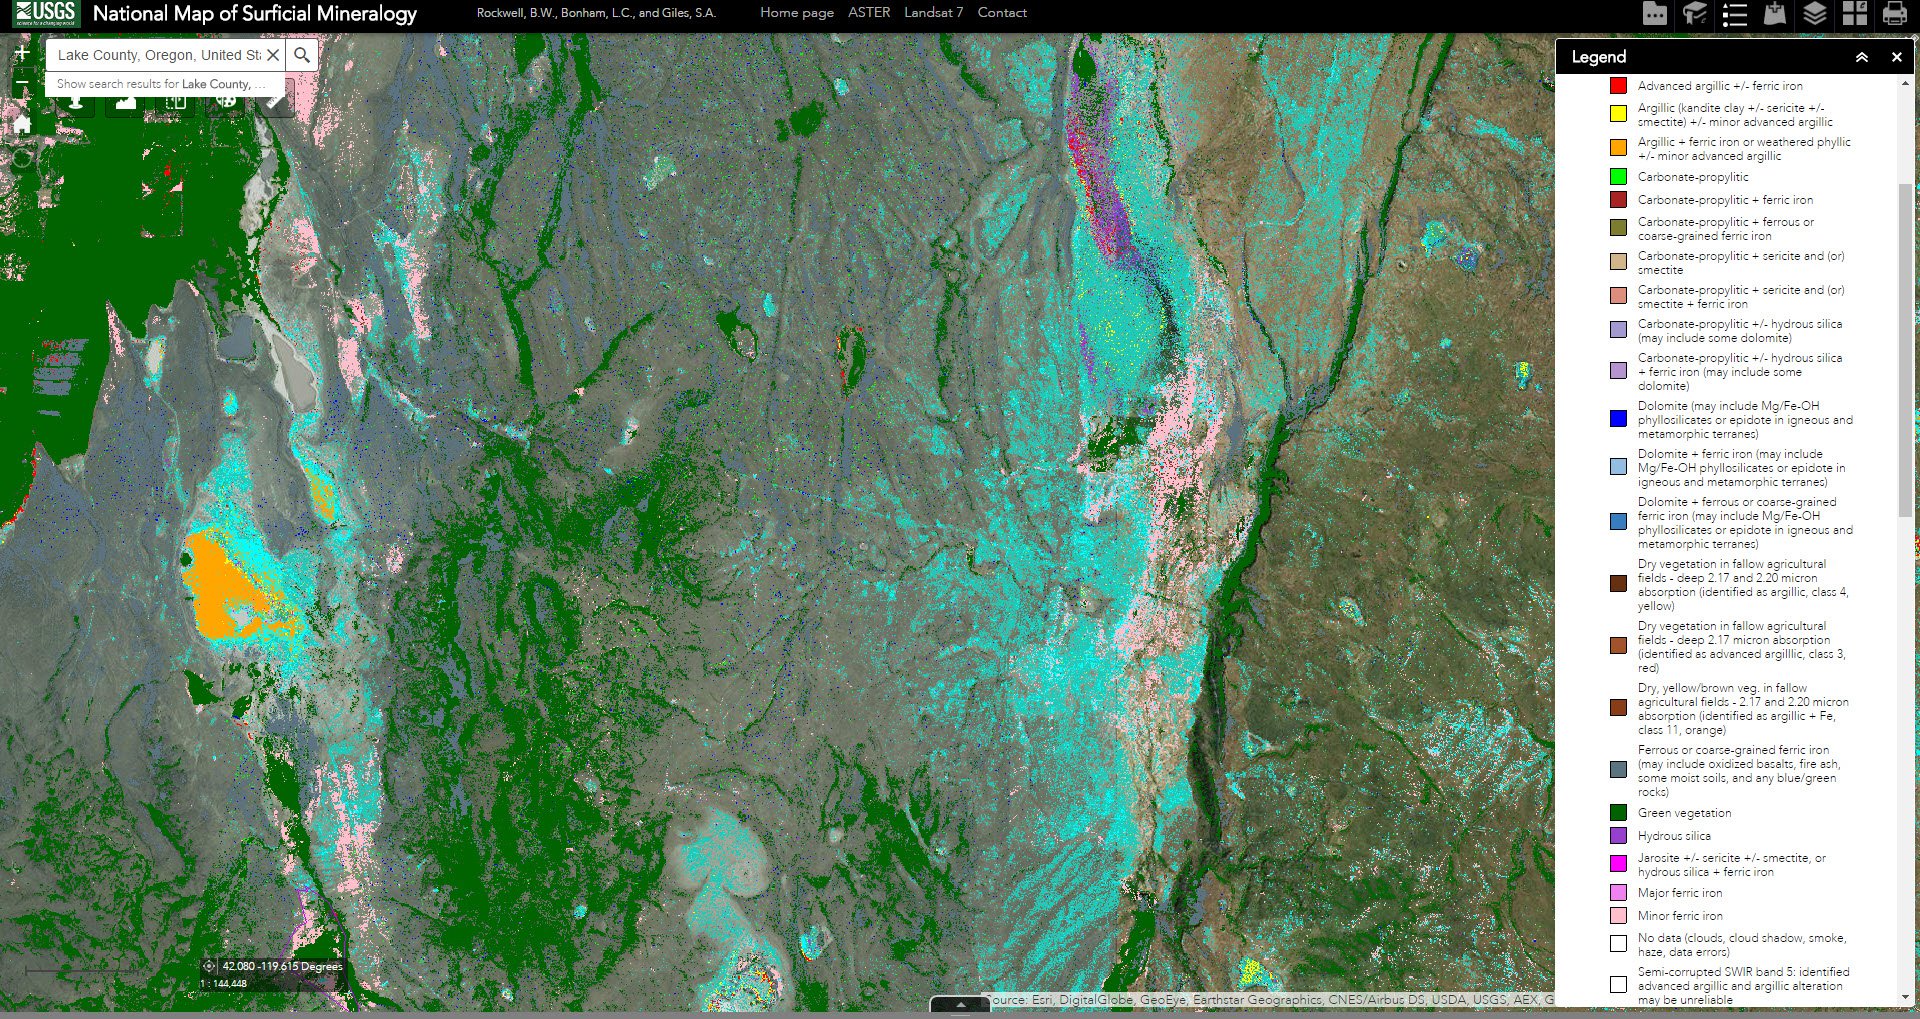
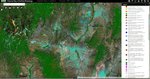
The above image is a closer look at the types of minerals that can be identified using ASTER data in the SaMiRA study area of Lake County, Oregon.
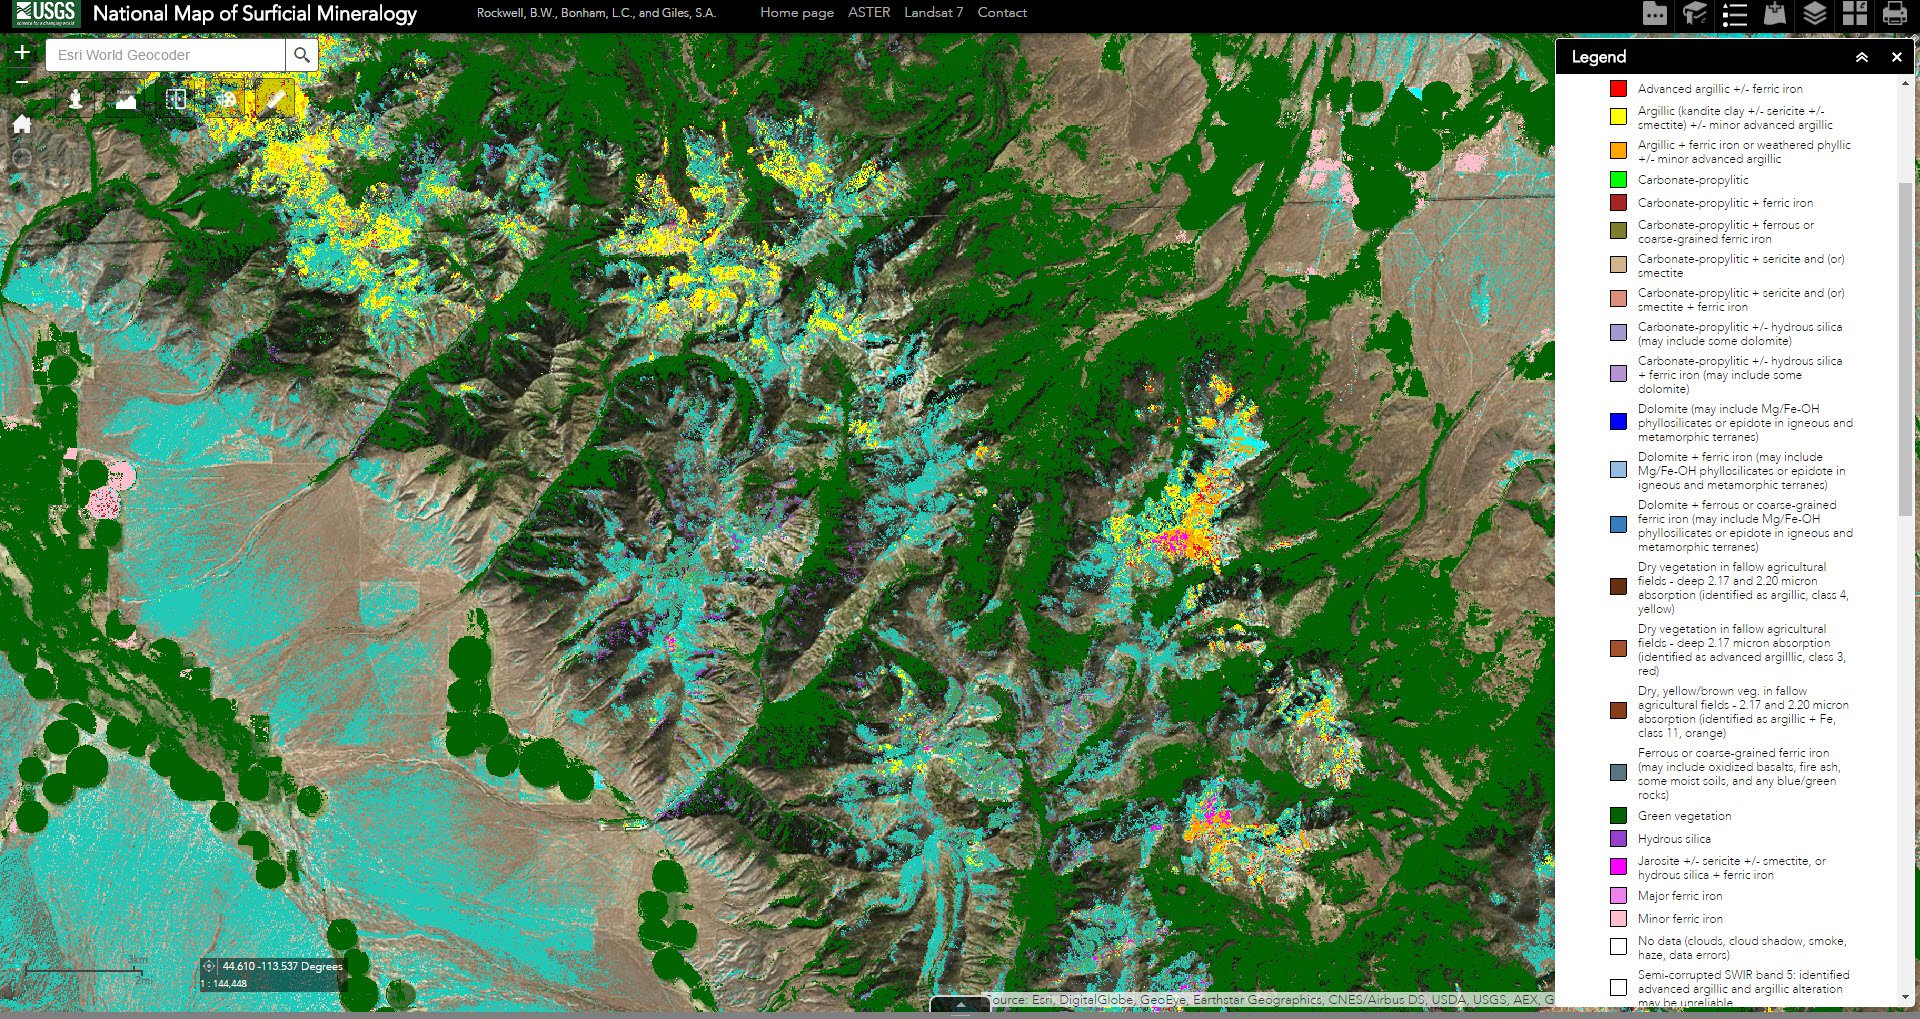
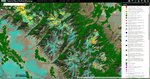
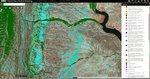
The above image is a closer look at the types of minerals that can be identified using ASTER data in the SaMiRA study area of Lemhi County, Idaho.
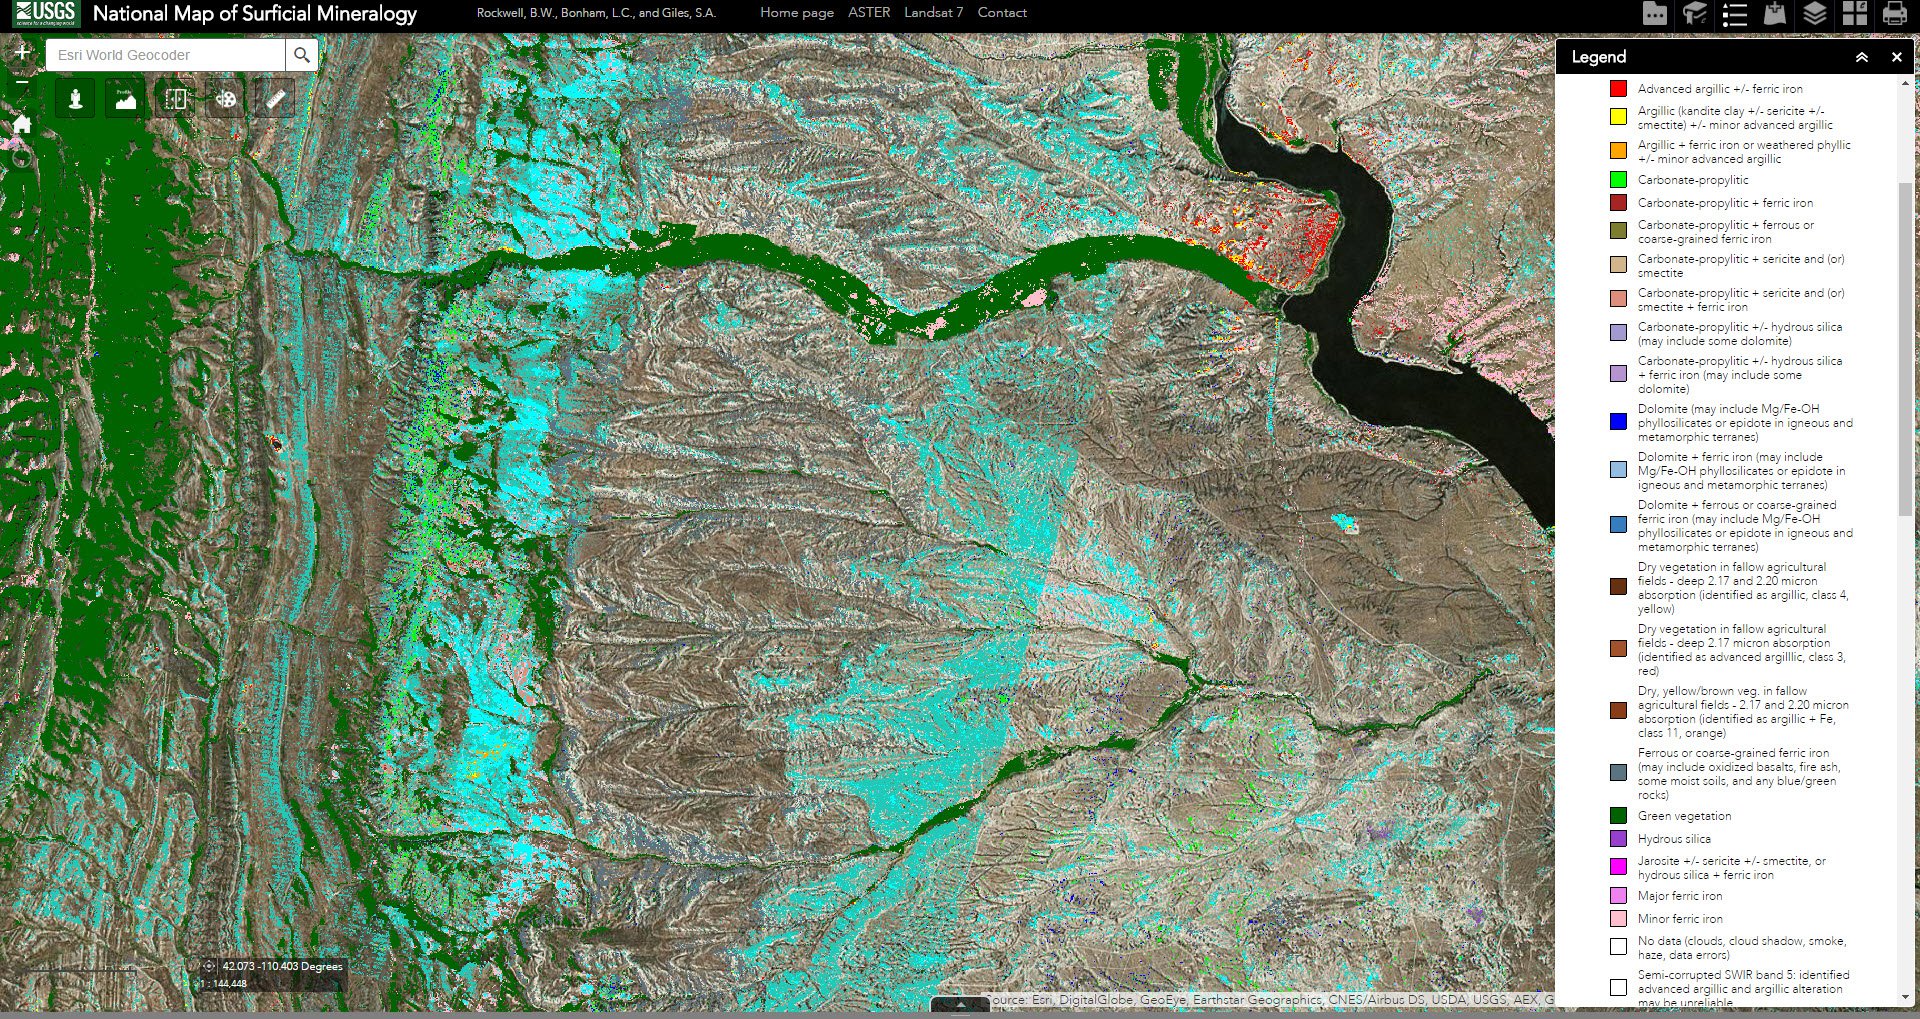
The above image is a closer look at the types of minerals that can be identified using ASTER data in the study area in Lincoln County, Wyoming.
To view the ASTER data layer on the National Map of Surficial Mineralogy for yourself, click on the “Layer List” icon to turn on the ASTER data layer. The above image is a closer look at the types of minerals that can be identified using ASTER data in Elko County, Nevada. This area is part of the study area for the SaMiRA project.
The above image is a closer look at the types of minerals that can be identified using ASTER data in the SaMiRA study area of Lake County, Oregon.
The above image is a closer look at the types of minerals that can be identified using ASTER data in the SaMiRA study area of Lemhi County, Idaho.
The above image is a closer look at the types of minerals that can be identified using ASTER data in the study area in Lincoln County, Wyoming.
References: (Author's Note 5/15/2020: At the time of publishing these references were available online, some resources may no longer be available.)
Abrams, M., Hook, S., and Ramachandran, R., ASTER user handbook version 2, accessed August 25, 2016, at https://asterweb.jpl.nasa.gov/content/03_data/04_Documents/aster_user_guide_v2.pdf.
Day, W.C., Frost, T.P., Hammarstrom, J.M., and Zientek, M.L., eds., 2016, Mineral Resources of the Sagebrush Focal Areas of Idaho, Montana, Nevada, Oregon, Utah, and Wyoming: U.S. Geological Survey Scientific Investigations Report 2016–5089, http://dx.doi.org/10.3133/sir20165089.
Dicken, C.L., and San Juan, C.A., 2016, Bureau of Land Management's Land and Mineral Legacy Rehost System (LR2000) mineral use cases for the Sagebrush Mineral-Resource Assessment, Idaho, Montana, Nevada, Oregon, Utah, and Wyoming: U.S. Geological Survey data release, http://dx.doi.org/10.5066/F7RX996K.
Gunther, G., Graeber, L., Drake, A., and Ii, R., 2016, Cumulative production per township – SaMiRa, accessed September 7, 2016, at http://certmapper.cr.usgs.gov/geoportal/catalog/search/resource/details.page?uuid=%7B96F45AD6-E1C5-43F3-A56F-7429DBE55963%7D.
NASA Jet Propulsion Laboratory, 2004, ASTER Instrument Characteristics, accessed August 25, 2016, at https://asterweb.jpl.nasa.gov/characteristics.asp.
NASA Jet Propulsion Laboratory, 2004, SWIR, accessed August 25, 2016, at https://asterweb.jpl.nasa.gov/swir.asp.
Rockwell, B.W., 2012, Description and validation of an automated methodology for mapping mineralogy, vegetation, and hydrothermal alteration type from ASTER satellite imagery with examples from the San Juan Mountains, Colorado: U.S. Geological Survey Scientific Investigations Map 3190, 35 p. pamphlet, 5 map sheets, scale 1:100,000. (Revised February 2013), accessed August 25, 2016, at http://pubs.usgs.gov/sim/3190/.
Rockwell, B., Bonham, L. and S. Giles., 2015, USGS National Map of Surficial Mineralogy Web Viewers: U. S. Geological Survey Online Map Resource accessed August 2, 2016, at http://cmerwebmap.cr.usgs.gov/USMinMap/ and http://cmerwebmap.cr.usgs.gov/flexviewers/USMinMap/.
Rockwell, B., Bonham, L. and S. Giles., 2015, USGS National Map of Surficial Mineralogy: U. S. Geological Survey accessed August 2, 2016, at http://cmerwebmap.cr.usgs.gov/usminmap.html.
Material written by Danielle Golon1
1 Innovate!, Inc., contractor to the U.S. Geological Survey, Earth Resources Observation and Science (EROS) Center, Sioux Falls, South Dakota, USA. Work performed under USGS contract G15PD00766 for LP DAAC2.
2 LP DAAC Work performed under NASA contract NNG14HH33I.